![]() ISSN 0798 1015
ISSN 0798 1015

![]() ISSN 0798 1015
ISSN 0798 1015
Vol. 40 (Number 14) Year 2019. Page 1
SINGH, Inderpal 1; NAYYAR, Anand 2; LE, Doan Hong 3 & DAS, Subhankar 4
Received: 10/08/2018 • Approved: 18/02/2019 • Published 29/04/2019
3. Objectives & research methodology
ABSTRACT: The Indian banking industry has witnessed a great success after the period of 1991 as the concept of LPG (Liberalization, Privatization, and Globalization) emerges. Electronic banking (e-banking) can be regarded as the grand innovation in the industry. Internet banking is treated as a major development in the financial service sector during recent years. It is a tool to attract as well as to retain the customers in the global banking sector. The purpose of this research was to empirically test the perceived benefits and users’ perception of internet banking of selected public and private sector banks in Punjab. The exploratory and descriptive research design was used for study. The sample was selected by quota sampling. 480 respondents in total became part of this study. The data were collected through the structured questionnaire and was filled up with the customers of selected banks with the help of the personal interview method. Descriptive analysis techniques and independent sample t-test were used to analyze the data collected through the questionnaires. Results showed that the overall internet banking service quality of public sector and private sector banks were not significantly different with respect to Perceived Effectiveness; Perceived Time and Perceived Employee Performance. |
RESUMEN: O setor bancário indiano testemunhou um grande sucesso após o período de 1991, quando surgiu o conceito de GPL (Liberalização, Privatização e Globalização). O banco eletrônico (e-banking) pode ser considerado a grande inovação do setor. Internet banking é tratado como um grande desenvolvimento no setor de serviços financeiros nos últimos anos. É uma ferramenta para atrair e reter os clientes no setor bancário global. O objetivo desta pesquisa foi testar empiricamente os benefícios percebidos e a percepção dos usuários de serviços bancários pela Internet de bancos selecionados do setor público e privado no Punjab. O delineamento exploratório e descritivo da pesquisa foi utilizado para estudo. A amostra foi selecionada por amostragem de cotas. 480 entrevistados no total passaram a fazer parte deste estudo. Os dados foram coletados por meio do questionário estruturado e preenchidos com os clientes dos bancos selecionados, com o auxílio do método de entrevista pessoal. Técnicas de análise descritiva e teste t para amostras independentes foram utilizadas para analisar os dados coletados através dos questionários. Os resultados mostraram que a qualidade geral do serviço bancário pela internet dos bancos do setor público e do setor privado não foi significativamente diferente em relação à Eficácia Percebida; Tempo Percebido e Desempenho do Funcionário Percebido. |

“Banking is necessary, but banks are not”. This statement is given by Bill Gates in 1994 when he was the chairman of Microsoft (Gandhi, 2016). This quote is supported by the increasing use of internet banking. Now internet banking has become one of the most revolutionized systems of today’s economic development. Internet banking is an influential value-added tool to attract new customers and retain the existing ones. Internet banking means to provide the information related to the bank’s products and services with the help of the website and provide the facility for customers to conduct various transactional and non-transactional activities (Daniel, 1999). With the aid of internet banking, a person can access the banking services any time and from anywhere as per his/her convenience. But while using internet banking there is a strong effect of perceptions and beliefs of internet banking users. These perceptions and beliefs also influence the adoption behavior of prospective customers.
The concept of perception is broad. It is very important to understand the customer's perception of internet banking. Perception is regarded as a process by which people choose, arrange and interpret stimuli into a meaningful and logical picture (Lamb et al., 2012). Perception is the initial impression that a person sketch and on the basis of it choose and interpret information to form a meaningful picture of the world (Munnukka, 2008). It is necessary to understand customer perceptions towards internet banking because it will help researchers and practitioners to identify the trend and patterns of adoption of internet banking. This can also help bank managers to devise suitable strategies intended for increasing internet banking use. Different researchers used different models for studying the perceptions of internet banking users. These are explained in Table 1.1.
Table 1.1
Models on Internet Banking Perceptions
S. No. |
Author |
Attributes Used in Study |
1. |
Gronroos, C., (1984) |
Technical quality; Functional quality and Image |
2. |
Parasuraman, A., Zeithaml, V. A., and Berry, L. L., (1988) |
Tangibles; Reliability; Responsiveness; Assurance and Empathy |
3. |
Cronin and Taylor (1994) |
Reliability; Responsiveness; Assurance; Empathy and Tangibles |
4. |
Amin, H., (2007) |
Perceived usefulness (PU); Perceived ease of use (PEOU); Perceived credibility (PC) and Computer self-efficacy (CSE) |
5. |
Raman, M., (2008) |
Ease of use; Appearance; Reliability; Customization; Communication and Incentive |
6. |
Kaur, R., (2010) |
Tangibles; Reliability; Responsiveness; Assurance and Empathy |
7. |
Kumbhar, V. M., (2010) |
System availability and acceptability; E-fulfillment; Accuracy; Efficiency; Security and assurance; Responsiveness; Easy to use and convenient; Cost effectiveness; Problem handling; Compensation and Contact |
8. |
Maenpaa, K., (2010) |
Convenience; Security; Status; Auxiliary features; Personal finances and Investment and Exploration. |
9. |
Safeena, R., and Abdullah, (2010) |
Perceived ease of use; Perceived usefulness; Awareness and Perceived risk |
10. |
Zheng, L. N., (2010) |
Internet experience; Perceived security; Web Design/Feature; Internet skill; Marketing exposure; Reliability and Internet prestige |
11 |
Elmayar, A., (2011) |
Effectiveness and assurance; Access; Price; Tangibles; Services Portfolio and Reliability |
12. |
Goyal, N., (2011) |
Reliability; Responsiveness; Empathy; Tangibles and Assurance |
13. |
Vaid, D., (2011) |
Reliability; Responsiveness; Empathy; Tangibles and Assurance |
14. |
Bebli, R. S., (2012) |
Speed of Delivery; Ease of use; Reliability; Pleasure; Control; Quality of service and Satisfaction |
15. |
Devi, S. K., (2012) |
Reliability; Accessibility; User-friendliness; Privacy/Security; Efficiency; Responsiveness and Fulfillment |
16. |
Hamidi, M., (2012) |
Perceived usefulness; Ease of use; Cost and time and Trust |
17. |
Dhillipan, J., (2013) |
Perceived usefulness; Perceived ease of use; Self efficacy; Relative advantage; Compatibility; Observability; Trialability; Intention to use; Awareness; Performance risk; Financial risk; Social risk; Time risk and Security risk |
18. |
Marakarkandy, B., (2013) |
Perceived ease of Use; Perceived usefulness; Trialability; Facilitating conditions; Privacy; Trust; Security; Cost; Self- efficacy and Bank initiative |
19. |
Rajyaguru, J., (2013) |
Service level; Trust; Useful; Satisfaction level and Behavior of Employees |
20. |
Makongoro, G., (2014) |
Perceived risk; Relative advantage; Trust and Convenience |
21. |
Laxman, T. S., (2015) |
Efficiency; Accessibility; Ease of use; Security and Reliability |
22. |
Rajput, U. D., (2015) |
Time; Ease of use; Access; Cost; Speed and Transparency |
23. |
Santhamoorthy, G., (2015) |
Efficiency; Accessibility; Easy use; Security; Responsiveness and Services |
The various empirical studies undertaken by various researchers were explained with the help of following table related to this research topic:
Table 2.1
|
Author, Country and Sample Size |
Objectives |
Results |
1. |
Akinci et al. (2004), Turkey, 1228 respondents
|
To develop an understanding of consumers' attitudes and adoption of Internet banking among sophisticated consumers. |
Internet banking users had a clear preference for convenience and technology-based channels than non-users.
|
2. |
Podder (2005), New Zealand, 157 respondents
|
To identify the factors influencing the adoption and usage of internet banking in New Zealand.
|
Perceived usefulness; Perceived ease-of-use; Self efficacy; Relative advantage; Compatibility and Result demonstrability had a signification impact on intentions of users to adopt internet banking. |
3. |
Amin (2007), Malaysia, 250 respondents
|
To study technology acceptance of internet banking among undergraduate students in Malaysia.
|
Perceived usefulness; Perceived ease of use and Perceived credibility had a significant relationship with behavioral intention.
|
4. |
Raman et al. (2008), Malaysia, 150 respondents
|
To evaluate consumer perceptions on the quality of e-services and Internet banking adoption in Malaysia.
|
Internet users and non-users have different perceptions regarding ease of use and reliability preference.
|
5. |
Kumbhar (2010), India, 190 Respondents
|
To observe the impact of alternate banking on customer’s satisfaction.
|
Efficiency; Responsiveness; Easy to use; Convenience; Cost Effectiveness; Compensation and Contact; Brand Perception and Perceived Value were major factors affecting overall customer satisfaction in alternative banking.
|
6. |
Al mohaimmeed (2012), Saudi Arabia, 430 respondents
|
To determine the factors that influence bank customers’ intentions to use internet banking.
|
Perceived usefulness and service visibility directly influence Saudi customers’ intention to use internet banking.
|
7. |
Abrol (2014), India, 400 respondents, 400 respondents
|
To analyze the impact of internet banking on customer satisfaction and business satisfaction. |
The study found no significant difference of private and public-sector bank customer’s responses towards website quality, customer oriented services, trust, courtesy, after sales services, responsiveness, security, perceived ease of use and behavioral intention.
|
8. |
Bashir et al. (2015), India, 420 respondents
|
To examine the factors affecting Indian consumers' intentions to adopt Internet banking services.
|
Perceived usefulness, perceive ease of use, perceived enjoyment, perceived image, social influence and trust in Internet banking have significant positive effects on behavioral intention.
|
9. |
Jolly (2016), India, 120 respondents
|
To analyze the influence of internet banking on the efficiency and cost savings for banks’ customers. |
Internet banking helps save time and money, mainly the transport charges. |
10. |
Mbrokoh (2016), 273 respondents |
To investigate the key determinants of the adoption of internet banking in Ghana |
The result of the study found support for the influence of performance expectancy; effort expectancy; social influence and perceived credibility on behavioral intention |
The study was undertaken to achieve the following objectives:
H01: There is no significant difference in the benefits drawn by internet banking users of public and private sector banks with respect to internet banking perceptions.
H02: There is no significant difference in the service quality of public and private sector banks with respect to each service benefit of internet banking.
The study was restricted to the customers’ perspectives regarding their perceptions on internet banking. Therefore, it does not cover any performance appraisal or opinion on internet banking services from a banker’s perspective. The results of the study were restricted to the state of Punjab and cannot be substantiated to other states of India.
The exploratory research design was used to study the internet banking user’s perceptions and their attitude towards using internet banking. Along with this descriptive research design was also used to describe the phenomenon.
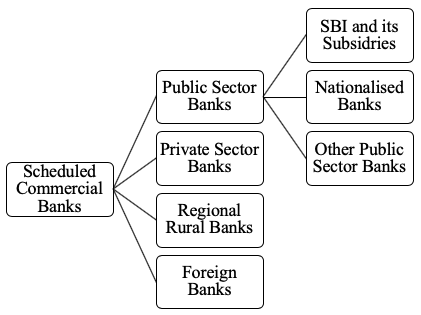
The universe of the study consisted of scheduled commercial banks. The scheduled commercial banks are divided into the public sector, the private sector, foreign banks and regional rural banks. For the data collection, only public and private sector banks were taken into consideration. The structure of the Indian banking system has been explained in figure 3.1:
Figure 3.1
Structure of Indian Banking System
The sample of the study was selected on the basis of quota sampling, i.e. non-probability method of data collection.
The sample size included 4 public sector banks named State Bank of India, Punjab National Bank, Punjab and Sind Bank and Oriental Bank of Commerce and 4 private sector banks named HDFC Bank, ICICI Bank, Yes Bank and Axis Bank. The banks operating in the Jalandhar District, Shaheed Bhagat Singh Nagar District, Moga District and Patiala district were covered from each district, i.e. One public and one private sector bank from each district. In this way, total 8 banks from each district were selected and total 32 banks became part of the study. 15 respondents were approached from each bank and accordingly 480 respondents in total became part of this study.
The sources of data included both the primary and secondary sources of study.
Primary data are collected mainly for the purposes to collect the first-hand responses of the respondents about research questions. The data were collected through the structured questionnaire to measure the perceived benefits and perception of users of internet banking of selected public and private sector banks in Punjab which were filled up from the customers of banks in Punjab. The questionnaire included 125 items from the 13 dimensions named Perceived Usefulness; Perceived Risk; Perceived Cost; Perceived Responsiveness; Perceived Reliability; Perceived Tangibility; Perceived Communication; Perceived Value; Perceived Security and Privacy; Perceived Time; Perceived Accessibility; Perceived Effectiveness and Perceived Employee Performance. All items were measured by responses on a Three-Point Scale in agreement/relevance to statements, ranging from3=Agree/Completely relevant, 2= Neutral and 1= Disagree/Completely irrelevant. Personal interview method was used to collect the necessary information on the questionnaire.
The required secondary data were collected from various journals; magazines; published literature of banks; thesis; dissertations; master projects of researchers; banks’ websites and RBI published literature.
The present study was conducted with the help of a structured questionnaire. Online and offline modes were used to collect the data. A pilot survey was conducted to test the content validity of the questionnaire and for this; the data were collected from 100 respondents. Revisions were made in the content and language of the questionnaire in order to make it more clear, easy and understandable. Reliability of the questionnaire was also checked with the aid of Cronbach’s Alpha. The test provided satisfactory results as the value for each dimension was more than 0.70
Descriptive analysis techniques and independent sample t-test were used to analyze the data collected through the questionnaires. The reliability of data was tested through Cronbach’s Alpha. The analysis of primary data was carried out using Statistical Package for the Social Sciences (SPSS) 21.
Table 4.1
Gender Wise Classification
|
Frequency |
Percent |
|
Gender |
Male |
240 |
50.0 |
Female |
240 |
50.0 |
|
Total |
480 |
100.0 |
|
Source: Primary Data
Table 4.1 showed the gender wise classification of the respondents of the study. Total 480 respondents were the part of the study. Among these 480 respondents, 240 respondents (50%) were male and 240 respondents were female (50%). It shows that male and female respondents were taken equal in number for the study.
Table 4.2
Residential Area Wise Classification
|
Frequency |
Percent |
|
Residential Area |
Urban Area |
324 |
67.5 |
Semi Urban Area |
106 |
22.1 |
|
Rural Area |
50 |
10.4 |
|
Total |
480 |
100.0 |
|
Source: Primary Data
Table 4.2 showed the residential area wise classification of the respondents of the study. Total 480 respondents were the part of the study. Among these 480 respondents, 324 respondents (67.5%) belonged to urban areas; 106 respondents (22.1%) belonged to the semi-urban area and 50 respondents belonged to the rural area (10.4%). It shows that maximum respondents were from the urban area in the study and least respondents belonged to the rural area.
Table 4.3
Occupation Wise Classification
|
Frequency |
Percent |
|
Occupation |
Service |
277 |
57.7 |
Business |
46 |
9.6 |
|
Professional |
157 |
32.7 |
|
Total |
480 |
100.0 |
|
Source: Primary data
The above table 4.3 explained the occupation wise classification of the respondents of the study. Total 480 respondents were the part of the study. Among these 480 respondents, 277 respondents (57.7%) belonged to service class; 46 respondents (9.6%) belonged to business class and 157 respondents (32.7%) were professionals. It shows that maximum respondents were from the service class in the study and least respondents belonged to business class.
Table 4.4
Age Wise Classification
|
Frequency |
Percent |
|
Age |
18-25 Years |
74 |
15.4 |
26-35 Years |
200 |
41.7 |
|
36-45 Years |
138 |
28.8 |
|
45 Years and above |
68 |
14.2 |
|
Total |
480 |
100.0 |
|
Source: Primary data
Table 4.4 exhibited the age wise classification of the respondents of the study. Total 480 respondents were the part of the study. Among these 480 respondents, 74 respondents (15.4%) belonged to 18-25 years age group; 200 respondents (41.7%) belonged to 26-35 years age group; 138 respondents (28.8%) belonged to 36-45 years age group and 68 respondents (14.2%) were of 45 years and above age group. It shows that maximum respondents came under 26-35 years age group in the study and least respondents belonged to 45 years and above.
Table 4.5
Classification According to Educational
Level of the Respondents
|
Frequency |
Percent |
|
Educational Level |
Up to Higher Secondary (12th) |
9 |
1.9 |
Graduate |
69 |
14.4 |
|
Post Graduate |
402 |
83.8 |
|
Total |
480 |
100.0 |
|
Source: Primary data
Table 4.5 showed the educational classification of the respondents of the study. Total 480 respondents were the part of the study. Among these 480 respondents, 09 respondents (1.9%) were educated up to higher secondary (12th); 69 respondents (14.4%) were graduate and the rest of the 402 respondents (83.8%) were postgraduate. It shows that maximum respondents were highly educated and were postgraduate who were using internet banking services.
Table 4.6
Income Wise Classification
|
Frequency |
Percent |
|
Income |
Less than 30,000 |
174 |
36.3 |
30,001-60,000 |
159 |
33.1 |
|
60,001-90,000 |
86 |
17.9 |
|
90,001 above |
61 |
12.7 |
|
Total |
480 |
100.0 |
|
Source: Primary data
Table 4.6 showed the income wise classification of the respondents of the study. Total 480 respondents were the part of the study. Among these 480 respondents, 174 respondents (36.3%) were earning less than 30,000; 159 respondents (33.1%) were having income between 30,001-60,000; 86 respondents (17.9%) were having income between 60,001-90,000 and remaining 61 respondents (12.7%) were having income 90,001 and above. It shows that maximum respondents were earning less than 30,000 in the study and least respondents were earning 90,001 and above.
Table 4.7
How Long have you used Internet Banking?
|
Frequency |
Percent |
|
Period of Usage |
Less than 1 year |
53 |
11.0 |
1-2 years |
78 |
16.3 |
|
2-3 years |
83 |
17.3 |
|
3-5 years |
112 |
23.3 |
|
More than 5 years |
154 |
32.1 |
|
Total |
480 |
100.0 |
|
Source: Primary data
Table 4.7 showed the period of internet banking usage of the respondents of the study. Total 480 respondents were the part of the study. Among these 480 respondents, 53 respondents (11%) were using internet banking services for less than 1 year; 78 respondents (16.3% respondents) were using internet banking services for the period 1-2 years; 83 respondents (17.3% respondents) were using internet banking services for the period 2-3 years; 112 respondents (23.3%) were using internet banking services for the period 3-5 years and 154 respondents (32.1%) were using internet banking services for the period 5 years and above. It shows that maximum respondents were using internet banking services for the period last 5 years and above in the study and least respondents were using internet banking services for less than 1 year.
Table 4.8
Problems Encountered by Internet Banking Users
|
Respondents Facing Problem (f) |
% |
Respondents not Facing Problem (f) |
% |
Total |
% |
Cannot log in |
182 |
37.9 |
298 |
62.1 |
480 |
100 |
Complicated websites |
203 |
42.3 |
277 |
57.7 |
480 |
100 |
Fake websites |
64 |
13.3 |
416 |
86.7 |
480 |
100 |
Transaction fraud |
40 |
8.3 |
440 |
91.7 |
480 |
100 |
Constant breakdown |
153 |
31.9 |
327 |
68.1 |
480 |
100 |
Source: Primary data
Table 4.8 showed the problems encountered by the respondents while using internet banking. Total 480 respondents were the part of the study. Among these services the problem which was faced by maximum number of respondents was complicated websites (203 respondents, 42.3%) followed by cannot log in (182 respondents, 37.9%); Constant breakdown (153 respondents, 31.9%); Fake websites (64 respondents, 13.3%) and Transaction fraud (40 respondents, 8.3%). It shows that the design and layout of internet banking websites were complicated, which became a hurdle in the internet banking usage.
Table 4.9
Reliability Analysis
|
Dimension Label |
Coefficient of Reliability |
1. |
Perceived Usefulness |
.861 |
2. |
Perceived Risk |
.875 |
3. |
Perceived Cost |
.790 |
4. |
Perceived Responsiveness |
.784 |
5. |
Perceived Reliability |
.821 |
6. |
Perceived Tangibility |
.792 |
7. |
Perceived Communication |
.809 |
8. |
Perceived Value |
.914 |
9. |
Perceived Security and Privacy |
.925 |
10. |
Perceived Time |
.825 |
11. |
Perceived Accessibility |
.925 |
12. |
Perceived Effectiveness |
.874 |
13. |
Perceived Employee Performance |
.913 |
Source: Primary data
Table 4.9 showed the result of Cronbach’s alpha to test the reliability of data collected from the respondents of the study. Each dimension taken in the study showed the value of Cronbach’s alpha more than 0.70 which means that the dimensions cleared the reliability test. Hence it can be concluded that the items reliably measured the defined constructs.
H01: There is no significant difference in the benefits drawn by internet banking users of public and private sector banks with respect to internet banking perceptions.
Table 4.10
Descriptive Statistics on Internet Banking Perceptions
|
Type of the banks |
N |
Mean |
Std. Deviation |
Std. Error Mean |
PU |
Private Sector Banks |
240 |
36.7125 |
3.32680 |
.21474 |
Public Sector Banks |
240 |
35.6583 |
3.91862 |
.25295 |
|
PR |
Private Sector Banks |
240 |
18.1750 |
3.20476 |
.20687 |
Public Sector Banks |
240 |
17.1708 |
3.64766 |
.23546 |
|
PC |
Private Sector Banks |
240 |
10.0958 |
2.24335 |
.14481 |
Public Sector Banks |
240 |
9.5750 |
2.14598 |
.13852 |
|
PRE |
Private Sector Banks |
240 |
17.8542 |
2.97542 |
.19206 |
Public Sector Banks |
240 |
17.2333 |
3.21407 |
.20747 |
|
PREL |
Private Sector Banks |
240 |
24.3917 |
3.00987 |
.19429 |
Public Sector Banks |
240 |
23.0083 |
3.58518 |
.23142 |
|
PT |
Private Sector Banks |
240 |
13.4458 |
2.06717 |
.13344 |
Public Sector Banks |
240 |
12.6750 |
2.41565 |
.15593 |
|
PCO |
Private Sector Banks |
240 |
21.0667 |
3.22577 |
.20822 |
Public Sector Banks |
240 |
19.7750 |
3.40062 |
.21951 |
|
PV |
Private Sector Banks |
240 |
28.4500 |
5.13638 |
.33155 |
Public Sector Banks |
240 |
27.0667 |
4.98489 |
.32177 |
|
PSP |
Private Sector Banks |
240 |
60.2875 |
8.66512 |
.55933 |
Public Sector Banks |
240 |
57.8917 |
8.82635 |
.56974 |
|
PTI |
Private Sector Banks |
240 |
9.0458 |
2.49895 |
.16131 |
Public Sector Banks |
240 |
9.0042 |
2.48426 |
.16036 |
|
PA |
Private Sector Banks |
240 |
46.4667 |
6.32381 |
.40820 |
Public Sector Banks |
240 |
45.2833 |
5.77425 |
.37273 |
|
PE |
Private Sector Banks |
240 |
27.2208 |
4.03297 |
.26033 |
Public Sector Banks |
240 |
27.0000 |
3.34739 |
.21607 |
|
PEP |
Private Sector Banks |
240 |
17.7458 |
3.97981 |
.25690 |
Public Sector Banks |
240 |
17.2042 |
3.81639 |
.24635 |
Source: Primary Data
Table 4.10 showed the descriptive statistics to show the level of differences in the benefits drawn by internet banking users of public and private sector banks with respect to internet banking perceptions. In case of private sector banks, the mean values of maximum dimensions under study were higher as compared to mean values of public sector banks. The mean value of ‘Perceived Usefulness’ was 36.7125 for private sector banks and 35.6583 for public sector banks; for ‘Perceived Risk’ the mean value was 18.1750 for private sector banks and 17.1708 for public sector banks; for ‘Perceived Cost’ the mean value was 10.0958 for private sector banks and 9.5750 for public sector banks; for ‘Perceived Responsiveness’ the mean value was 17.8542 for private sector banks and 17.2333 for public sector banks; for ‘Perceived Reliability’ the mean value was 24.3917 for private sector banks and 23.0083 for public sector banks; for ‘Perceived Tangibility’ the mean value was 13.4458 for private sector banks and 12.6750 for public sector banks; for ‘Perceived Communication’ the mean value was 21.0667 for private sector banks and 19.7750 for public sector banks; for ‘Perceived Value’ the mean value was 28.4500 for private sector banks and 27.0667 for public sector banks; for ‘Perceived Security and Privacy’ the mean value was 60.2875 for private sector banks and 57.8917 for public sector banks; for ‘Perceived Time’ the mean value was 9.0458 for private sector banks and 9.0042 for public sector banks; for ‘Perceived Accessibility’ the mean value was 46.4667 for private sector banks and 45.2833 for public sector banks; for ‘Perceived Effectiveness’ the mean value was 27.2208 for private sector banks and 27.0000 for public sector banks and for ‘Perceived Employee Performance’ the mean value was 17.7458 for private sector banks and 17.2042 for public sector banks. The high mean values of private sector banks clearly depict that the internet banking users of private sector banks were more benefitted as compared to internet banking users of public sector banks. Hence, the results also proved that significant differences existed in the benefits drawn by internet banking users of public and private sector banks with respect to internet banking perceptions.
H02: There is no significant difference in the service quality of public and private sector banks with respect to internet banking users’ perceptions.
Table 4.11 tested the significant difference between the dependent variables and types of banks. The dependent variables were Perceived Usefulness; Perceived Risk; Perceived Cost; Perceived Responsiveness; Perceived Reliability; Perceived Tangibility; Perceived Communication; Perceived Value; Perceived Security and Privacy; Perceived Time; Perceived Accessibility; Perceived Effectiveness and Perceived Employee Performance. The types of banks were independent variables of the study. The type of banks consisted of two categories, i.e. Public-sector banks and private sector banks. The independent sample t-test was applied to test the significant differences. It was found that the observed value was more than 0.05 for the dimensions named Perceived Time (0.855); Perceived Effectiveness (0.514) and Perceived Employee Performance (0.129). So, the null hypotheses were accepted for these three dimensions. For the dimensions named, Perceived Usefulness (0.002); Perceived Risk (0.001); Perceived Cost (0.010); Perceived Responsiveness (0.029); Perceived Reliability (0.000); Perceived Tangibility (0.000); Perceived Communication (0.000); Perceived Value (0.003); Perceived Security and Privacy (0.003) and Perceived Accessibility (0.033), the observed value was less than 0.05 and the null hypotheses had been rejected and the alternate hypotheses were accepted for all these internet banking perceptions.
Table 4.11
Independent Sample t-test on Internet Banking Perceptions
|
Levene's Test for Equality of Variances |
t-test for Equality of Means |
||||||||
F |
Sig. |
TIME ALLOWED |
Df |
Sig. (2-tailed) |
Mean Difference |
Std. Error Difference |
95% Confidence Interval of the Difference |
|||
Lower |
Upper |
|||||||||
PU |
EVA |
4.813 |
.029 |
3.177 |
478 |
.002 |
1.05417 |
.33181 |
.40218 |
1.70615 |
EVNA |
3.177 |
465.735 |
.002* |
1.05417 |
.33181 |
.40214 |
1.70619 |
|||
PR |
EVA |
15.031 |
.000 |
3.204 |
478 |
.001 |
1.00417 |
.31342 |
.38831 |
1.62002 |
EVNA |
3.204 |
470.208 |
.001* |
1.00417 |
.31342 |
.38829 |
1.62005 |
|||
PC |
EVA |
1.654 |
.199 |
2.599 |
478 |
.010* |
.52083 |
.20039 |
.12707 |
.91460 |
EVNA |
2.599 |
477.062 |
.010 |
.52083 |
.20039 |
.12707 |
.91460 |
|||
PRE |
EVA |
1.148 |
.284 |
2.196 |
478 |
.029* |
.62083 |
.28272 |
.06531 |
1.17636 |
EVNA |
2.196 |
475.183 |
.029 |
.62083 |
.28272 |
.06530 |
1.17637 |
|||
PREL |
EVA |
8.321 |
.004 |
4.578 |
478 |
.000 |
1.38333 |
.30216 |
.78960 |
1.97707 |
EVNA |
4.578 |
464.087 |
.000* |
1.38333 |
.30216 |
.78955 |
1.97711 |
|||
PT |
EVA |
8.398 |
.004 |
3.756 |
478 |
.000 |
.77083 |
.20523 |
.36757 |
1.17410 |
EVNA |
3.756 |
466.851 |
.000* |
.77083 |
.20523 |
.36755 |
1.17412 |
|||
PCO |
EVA |
1.370 |
.242 |
4.269 |
478 |
.000* |
1.29167 |
.30256 |
.69716 |
1.88617 |
EVNA |
4.269 |
476.674 |
.000 |
1.29167 |
.30256 |
.69716 |
1.88618 |
|||
PV |
EVA |
1.044 |
.307 |
2.994 |
478 |
.003* |
1.38333 |
.46202 |
.47549 |
2.29118 |
EVNA |
2.994 |
477.572 |
.003 |
1.38333 |
.46202 |
.47549 |
2.29118 |
|||
PSP |
EVA |
2.117 |
.146 |
3.001 |
478 |
.003* |
2.39583 |
.79841 |
.82701 |
3.96465 |
EVNA |
3.001 |
477.838 |
.003 |
2.39583 |
.79841 |
.82701 |
3.96466 |
|||
PTI |
EVA |
.003 |
.955 |
.183 |
478 |
.855 |
.04167 |
.22745 |
-.4052 |
.48860 |
EVNA |
.183 |
477.983 |
.855 |
.04167 |
.22745 |
-.4052 |
.48860 |
|||
PA |
EVA |
.020 |
.889 |
2.141 |
478 |
.033* |
1.18333 |
.55277 |
.09718 |
2.26949 |
EVNA |
2.141 |
474.103 |
.033 |
1.18333 |
.55277 |
.09716 |
2.26951 |
|||
PE |
EVA |
.222 |
.637 |
.653 |
478 |
.514 |
.22083 |
.33832 |
-.4439 |
.88560 |
EVNA |
.653 |
462.315 |
.514 |
.22083 |
.33832 |
-.4439 |
.88566 |
|||
PEP |
EVA |
.278 |
.598 |
1.522 |
478 |
.129 |
.54167 |
.35592 |
-.1577 |
1.24104 |
EVNA |
1.522 |
477.162 |
.129 |
.54167 |
.35592 |
-.1577 |
1.24104 |
|||
* Significant at 5 per cent level
Source: Primary Data
The use of internet banking services among banking customers has been rapidly growing and getting more and more popular as it becomes easy for them now to manage their finances and to transact with their banks. Customer friendly policies of Indian banks for their customers have made their routine life easier as compared to traditional banking policies. This study was conducted to measure the perceived benefits and perceptions of users of internet banking of the selected public and private sector banks in the state of Punjab. The researcher tried to measure the overall internet banking service quality of selected banks from public and private sector with regard to each service benefit of internet banking services. It was found during the research that the internet banking users of private sector banks were more benefitted as compared to internet banking users of public sector banks. In this research, it was also found that the internet banking services provided by banks to its customers were found efficient and satisfactory. The dimensions taken under study also showed the positive perceptions of internet banking users. The dimensions named Perceived Effectiveness; Perceived Time and Perceived Employee Performance were not found significant and results proved that the overall internet banking service quality of public sector and private sector banks were not significantly different with respect to these three dimensions only. But the remaining ten dimensions named Perceived Usefulness; Perceived Risk; Perceived Cost; Perceived Responsiveness; Perceived Reliability; Perceived Tangibility; Perceived Communication; Perceived Value; Perceived Security and Privacy and Perceived Accessibility were found significant and results proved that the overall internet banking service quality of banks from public and private sector were significantly different with regard to these ten dimensions of the study.
Abrol, S., (2014), “Impact of Internet Banking on Customer Satisfaction and Business Performance”, Ph.D Thesis, University of Jammu, Jammu.
Akinci, S., Aksoy, S., and Atılgan, E., (2004), “Adoption of Internet Banking among Sophisticated Consumer Segments in an Advanced Developing Country”, International Journal of Bank Marketing, 22 (3), pp. 212-32.
Almohaimmeed, B. M., (2012), “Customer Behaviour towards Internet Banking: A Study of the Dormant Users of Saudi Arabia”, Ph.D Thesis, Birmingham Business School, University of Birmingham, United Kingdom.
Amin, H., (2007), “Internet Banking Adoption among Young Intellectuals”, Journal of Internet Banking and Commerce, 12(3), pp. 1-13.
Bashir, I., and Madhavaiah, C., (2015), “Trust, Social Influence, Self-Efficacy, Perceived Risk and Internet Banking Acceptance: An Extension of Technology Acceptance Model in Indian Context”, Metamorphosis: A Journal of Management Research, 14(1), pp. 25-38.
Bebli, R. S., (2012), “The Impact of Internet Banking Service Quality on Customer Satisfaction in the Banking Sector of Ghana”, Master Thesis, Blekinge Institute of Technology, Sweden
Cronin, J., and Taylor, S. A., (1994), “SERVPERF versus SERVQUAL: Reconciling Performance-Based and Perceptions–Minus–Expectations Measurement of Service Quality,” Journal of Marketing, 58(1), pp. 125-31.
Daniel, E., (1999), “Provision of Electronic Banking in the UK and the Republic of Ireland”, International Journal of Bank Marketing, 17(2), pp. 72-82.
Devi, S. K., (2012), “Customers’ Satisfaction with Internet Banking in Public and Private Sector Banks – With Special Reference to Tirunelveli District”, Ph.D Thesis, Manonmaniam Sundaranar University, Tirunelveli.
Dhillipan, J., (2013), “A Study on Adoption of Internet Banking in Public and Private Sector Banks with Special Reference to Chennai”, Ph.D Thesis, Manonmaniam Sundaranar University, Tirunelveli.
Elmayar, A., (2011), “Assessing the Perceived Service Quality Levels in the Libyan Private and Public Banking Sectors: A Customer Perspective”, Ph.D Thesis, Northumbria University, England.
Gandhi, R., (2016), “New Paradigm in Banking: Banking is Necessary, Not Banks – Really?” FIBAC 2016: New horizons in Indian banking, Mumbai, India.
Goyal, N., (2011), “Customer Satisfaction with IT-Enabled Services in the Banking Sector–An Exploration and Strategies for Gaining Corporate Leadership” Ph.D Thesis, Panjab University Chandigarh, India.
Gronroos, C., (1984), “A Service Quality Model and its Marketing Implications”, European Journal of Marketing, 18 (4), pp. 36-44.
Hamidi, M., (2012), “A Study on Customer Perception towards Internet Banking in Iran”, Master Thesis, Luleå University of Technology, Sweden.
Jolly, V., (2016), “The Influence of Internet Banking on the Efficiency and Cost Savings for Banks’ Customers”, International Journal of Social Sciences and Management, 3(3), pp-163-170.
Kaur, R., (2010), “Indian Banking: Managing Transformation through Information Technology– Problems and Prospects”, Ph.D Thesis, Punjabi University, Patiala, India.
Kumbhar, V. M., (2010), “An Empirical Study of Alternative Banking and Its Impact on Customers’ Satisfaction: A Case Study of Public and Private Sector Banks in Satara City”, Ph.D Thesis, Shivaji University, Kolhapur.
Lamb, C. W., Hair, J. F., and McDaniel, C., (2012), Essentials of Marketing, South-Western Cengage Learning, Mason, USA, p. 215.
Laxman, T. S., (2015), “A Study of Customers’Perception and Awareness about E-Banking in Solapur District”, Ph.D Thesis, Solapur University, Maharashtra, India.
Maenpaa, K., (2010), “User Perceptions of Internet Banking”, Academic Dissertation, University of Tampere, Finland.
Makongoro, G., (2014), “Factors Influencing Customer Adoption of Mobile Banking Services in Tanzania Grace Makongoro”, M.B.A. Dissertation, Open University of Tanzania.
Marakarkandy, B., (2013), “Internet Banking in India: A Model For User Acceptance”, Ph.D Thesis, Narsee Monjee Institute of Management Studies University, Mumbai, Maharashtra.
Mbrokoh, A. S., (2016), “Exploring the Factors that Influence the Adoption of Internet Banking in Ghana”, Journal of Internet Banking and Commerce, 21(2), pp. 1-20.
Munnukka, J., (2008), “Customers' Purchase Intentions as a Reflection of Price Perception”, Journal of Product & Brand Management, 17(3), pp. 188-196.
Parasuraman, A., Zeithaml, V. A., and Berry, L. L., (1988), “SERVQUAL: A Multiple-Item Scale for Measuring Consumer Perceptions of Service Quality”, Journal of Retailing, 64(1), pp. 12-40.
Podder, B., (2005), “Factors Influencing the Adoption and Usage of Internet Banking: A New Zealand Perspective”, Ph.D. Thesis, Auckland University of Technology.
Rajput, U. D., (2015), “Customer Perception on E-Banking Service”, Pacific Business Review International, 8(4), pp. 85-94.
Rajyaguru, J., (2013), “An Exploratory Study Based on Selected Consumer on E-Banking Services in Selected Cities of Gujarat State”, Ph.D Thesis, Saurashtra University Rajkot, Gujrat, India.
Raman, M., and Stephenaus, R., Alam, N., and Kuppusamy, M., (2008), “Information Technology in Malaysia: E-service quality and Uptake of Internet banking”, Journal of Internet Banking and Commerce, 13(2), pp. 1-18.
Safeena, R., (2011), “Internet Banking Adoption in an Emerging Economy: Indian Consumer’s Perspective”, International Arab Journal of e-Technology, 2(1), pp. 56-64.
Santhamoorthy, G., (2015), “Customers’ Perception towards E-Banking Services - A Comparative Study on the Public and Private Sector Banks in Chennai”, Ph.D Thesis, Manonmaniam Sundaranar University Tirunelveli, Tamilnadu, India.
Vaid, D., (2011), “Customers’ Expectations and Perceptions of Service Quality: A Comparative Study of Selected Public, Private and Foreign Banks”, Ph.D Thesis, Panjab University Chandigarh, India.
Zheng, L. N., (2010), “An Empirical Analysis of Factors that Influence the Adoption of Internet Banking in China: A Case Study of Zhengzhou”, M. Com Thesis, Lincoln University, Canterbury, New Zealand.
1. Associate Prof. KCLIMT Jalandhar, Punjab, India. arora_inderpal@yahoo.co.in
2. Professor. Graduate School, Duy Tan University, Da Nang, Vietnam. anandnayyar@duytan.edu.vn
3. Professor. Graduate School, Duy Tan University, Da Nang, Vietnam. dlehong@yahoo.com
4. Research Scholar in Faculty of Management Studies, IBCS. SoA (Siksha ‘O’ Anusandhan University), Bhubaneswar, India. info.subhankardas@gmail.com