![]() ISSN 0798 1015
ISSN 0798 1015

![]() ISSN 0798 1015
ISSN 0798 1015
Vol. 40 (Number 14) Year 2019. Page 9
SHIRINKINA Elena 1 & KODINTSEV Alexander 2
Received: 04/11/2018 • Approved:03/03/2019 • Published 29/04/2019
ABSTRACT: The present article is devoted to the problem of managing human capital in regional development - the creation of a multifactor model of the return of human capital. The relevance of the study stems from the disputes taking place in the scientific community as for the value of human capital and the assessment of its return. The subject of the research is the investigation of the processes of accumulation, development and transformation of human capital at the macro- and mesoeconomic levels. Theoretical and methodological basis of the research is the modern economic theory, modern concepts of the human capital management, a systematic approach, a dialectical method of cognition, methods of deduction and induction, analysis and synthesis, comparison. In the course of the study, the authors personally achieved the following results: based on the empirical material of the Russian Longitudinal Monitoring Survey of the NRU HSE (RLNS), a number of hypotheses have been confirmed about the effect of accumulation of individual human capital elements on the earnings of industrial workers in 29 regions of Russia. Scientific novelty of the research consists in the confirmation of the accumulated education's positive influence on the wage increase in Russia, the standard hypothesis on the obsolescence of human capital with age, as well as the influence of the special skills sets (knowledge of the language, computer skills) formation on the earnings changes throughout the life. Practical significance of the research results consists in the fact that the accurate interpretation of the indicators influencing the return of human capital will allow us to choose the right tools to influence the efficiency of its use as a factor of the region's economic growth. |
RESUMEN: El presente artículo está dedicado al problema de la gestión del capital humano en el desarrollo regional: la creación de un modelo multifactorial del retorno del capital humano. La relevancia del estudio se deriva de las disputas que tienen lugar en la comunidad científica en cuanto al valor del capital humano y la evaluación de su retorno. El tema de la investigación es la investigación de los procesos de acumulación, desarrollo y transformación del capital humano en los niveles macro y mesoeconómico. Las bases teóricas y metodológicas de la investigación son la teoría económica moderna, los conceptos modernos del manejo del capital humano, un enfoque sistemático, un método dialéctico de cognición, métodos de deducción e inducción, análisis y síntesis, comparación. En el curso del estudio, los autores lograron personalmente los siguientes resultados: sobre la base del material empírico de la Encuesta de Monitoreo Longitudinal de Rusia del NRU HSE (RLNS), se confirmaron varias hipótesis sobre el efecto de la acumulación de capital humano individual Elementos sobre las ganancias de los trabajadores industriales en 29 regiones de Rusia. La novedad científica de la investigación consiste en la confirmación de la influencia positiva de la educación acumulada en el aumento salarial en Rusia, la hipótesis estándar sobre la obsolescencia del capital humano con la edad, así como la influencia de los conjuntos de habilidades especiales (conocimiento del idioma, habilidades informáticas) la formación sobre los ingresos cambia a lo largo de la vida. La importancia práctica de los resultados de la investigación consiste en el hecho de que la interpretación precisa de los indicadores que influyen en el retorno del capital humano nos permitirá elegir las herramientas adecuadas para influir en la eficiencia de su uso como factor del crecimiento económico de la región. |
The traditional qualitative characteristics of human capital, such as the level of education, production experience and qualifications, the distribution of manpower by occupation, its role in providing innovation activities, and some general indicators of the labor investment dynamics are used in most modern studies. The definition of the application of human capital effectiveness is always tied to the identification of the studied qualitative indicators of its value (with a generally accepted approach it is determined through the level of income of the population). As a rule, a monetary valuation, even conducted according to a recognized methodology, does not provide sufficient insight into the impact of individual quantitative and qualitative factors on the return of human capital reserves, therefore any monetary valuation of human capital should be complemented by a study of the resulting indicator dependencies on the individual factors. That is why we use the traditional methodology of econometric modeling based on regression equations to study the formation and development of human capital.
The study of the accumulation and use of human capital, measurement, and evaluation of the efficiency of the investment in human capital becomes actual in conditions of enhancement of the intellectual workers' role in economic development [Abakumova, 2016. Р. 369; Baigulov, 2016. Р. 322]. Currently, the term human capital is used universally - both in social and some humanitarian studies, but its economic significance has remained unchanged and has not undergone significant transformations for over 60 years, in the works of Russian researchers as well [Shirinkina, 2018. Р. 73; Shirinkina, 2018. Р. 182]. Human capital means a set of knowledge, skills, and abilities that bring their owners' income over a certain period, that is, they can be effectively applied in the labor market [Becker, 1964]. Theoretical and methodological views on the nature of human capital in the writings of neoclassical labor economics representatives suggest its temporary dimension: the efficiency of the investment in human capital is determined by the difference in earnings for workers with different levels of accumulated human capital, expressed in years of training or production experience [Mincer, 1983. Р.12; Psacharopoulos, 2004]. The determination of the accumulation of human capital parameters' influence on the workers' earnings remains a promising direction of economic analysis since it allows us to understand the effectiveness of the reproduction processes of human capital and the degree of its use at the macroeconomic level.
Parametric analysis of the dependence of labor compensation on educational level and level analysis of the returns to education for various occupations and qualifications is carried out using regression analysis. The traditional tool to determine the level of returns to education is the equation proposed by J. Mincer [Mincer, 1974]. The equation is a logarithmic function of wages depending on several parameters; the standard equation includes such variables as the number of accumulated years of education and the number of years of production experience:
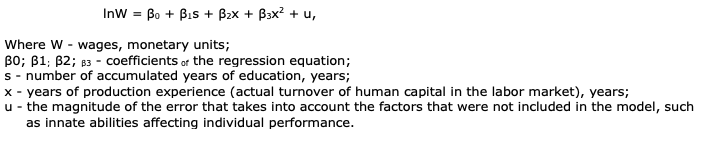
It should be noted that various modifications of the equation, depending on the purpose of the analysis, can include the unemployment rate (for the analysis of the Phillips curve), employment of the population, etc. R.J. Willis notes that the coefficient of the regression equation β1 in Equation 1 , or the education coefficient, reflects the rate of return on education, showing an increase in the return on each additional year of education [Willis, 1987. Р. 526; Shu-Chi Lin, Yin-Mei Huang, 2005. Р. 192; Vryonides, Lamprianuou, 2013. Р. 79]. This equation best approximates the real earnings function, reflecting the efficiency of the investment in human capital, that is why a mixed, quadratic and linear representation of the accumulated number of production experience years indicator is given. Naturally, the most important problem in determining the parameters of the Mincer equation is the collection of relevant statistical data, while preserving a significant sample size for validity. From the point of view of labor economics, the function, approximating the value of earnings by educational level and the level of work experience can be represented as a special case of Rosen's hedonic functions, reflecting the balance of demand and supply of employees with a certain level of education and experience. In dynamics, the level of demand for a certain quality of human capital can be reflected in the rate of wage increase and the correlation of wages for different periods.
The analysis with the help of the standard Mincer model allows very limited results; therefore, most modern researchers propose modified forms of the considered equation with additional quantitative and qualitative variables [Kapelyushnikov, 2009]. The inclusion of qualitative variables in the equation allows increasing the coefficient of determination while observing satisfactory values of the statistical criteria. For in-depth analysis, we proposed two initial linear models, the first of which included quantitative and qualitative variables:
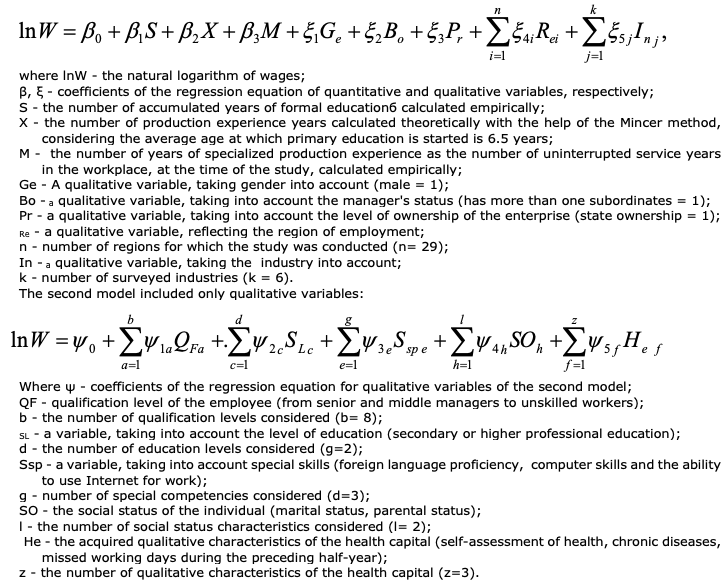
Additionally, the basic indicators of social capital (social status) and health capital, such as lost time due to illness and self-assessment of health, are included in equation. Estimates of the coefficients of all the regression equations considered in the study for different models will be given below and will form the basis for studying the trends in the formation and development of human capital in different regions of Russia. Next, we will give a description of the proposed models' individual factors. The study of the wages dynamics for the first model was carried out from 2003 to 2013, for the second model - from 2006 to 2013 due to the lack of some key variables in the empirical base of the study.
The transformation of human capital in Russian society from 1994 to 2008 is most fully considered in the last joint work of R.I. Kapelyushnikov and A.L. Lukyanova [Kapelyushnikov, 2013. Р. 44; Kapelyushnikov, 2006. Р.166]. Analysis of a significant amount of statistical material using the extended parametric equation of earnings allows the authors to draw some conclusions about the peculiarities of national human capital. In addition to confirming all the standard empirical effects of investing in human capital, the authors note a number of negative effects, such as "reinvestment" in human capital, leading to negative premiums from formal education [Kapelyushnikov, 2004. Р. 48].
As can be seen from Figure 1, the largest gap in wages (as a deviation from the average level in the economy as a whole) is observed in the sphere of extraction of fuel and energy minerals. To a certain extent, these trends reflect the real demand for skilled labor: export-oriented industries can attract workers on relatively more favorable terms.
Figure 1
Average monthly nominal wages of Russian industry workers (in thousands of rubles).
PCE 2017: statistical compilation / Rosstat. - P76, M., 2014. - 693 p.

Figure 2 reflects the change in wages, depending on the qualification level of employees. A significant gap in earnings is observed among managers and specialists of the highest qualification level. The indicator of the education premium, calculated as the deviation of the earnings level for workers with a certain level of education from the earnings of workers with a secondary general education, for them averages 61% and 32% in 2016, respectively.
Figure 2
The earnings level of the employees working in the economy, depending on the level
of qualifications for ISCO-2008 in thousands of rubles in Russia in 2016 (Levels of qualification
are indicated by numbers on the x-line). Education indicators: 2017: statistical collection. -
Moscow: National Research University: "Higher School of Economics", 2017, p. 62.
Note to figure 2: the 6th qualification group (agriculture) is excluded in the diagram.
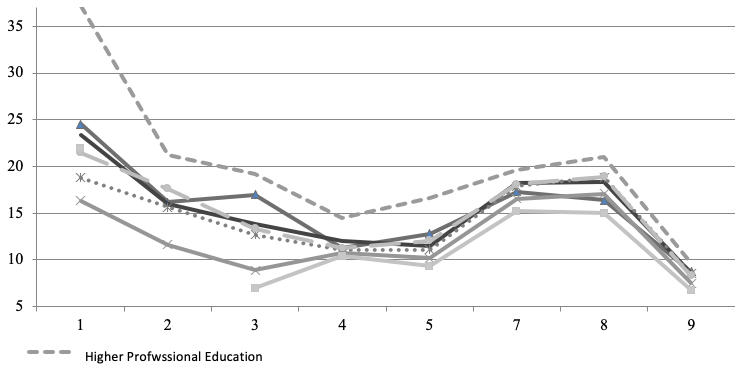
Further, based on the available statistical data, it is necessary to form empirical profiles of the dependence of wages on the level of education, which, as noted above, will give some idea of the demand for labor with a certain level of education in the labor market (Figure 3). As can be seen from the empirical curves, in the Russian conditions, the greatest breakaway in earnings is observed among workers with higher education aged 30 to 40, with the largest increase in the curve in the period of 25 to 30 years, when college graduates are actively entering the labor market. The Russian labor market features low impact of secondary and initial vocational education, as can be seen from Figure 3, wages of people with these education levels are stable at a low level throughout the whole period of their activity in the labor market.
Figure 3
Average monthly wages of employees with different
levels of education in 2016 (in thousands of rubles)
A detailed analysis of educational premiums in comparison with the general secondary education (Table 1) allows us to conclude on the selective efficiency of investment in certain levels of education for different qualification categories of workers.
Table 1
The size of educational premiums for employees of various
qualifications (secondary education = 100%) in 2016
Occupational group |
Total |
HPE |
IHPE |
SVO |
PVO |
BGE |
No BGE |
All the workers |
22.5 |
61.4 |
7.7 |
2.0 |
6.5 |
-13.9 |
-21.5 |
Heads of organisations |
60.9 |
76.0 |
27.6 |
12.4 |
-4.7 |
-7.3 |
9.0 |
Specialists of the highest qualification level |
10.1 |
46.0 |
-9.9 |
-14.4 |
-13.6 |
-24.9 |
--- |
Specialists of the intermediate qualification level |
19.8 |
49.9 |
16.5 |
10.2 |
-6.0 |
-41.6 |
-22.6 |
Employees (office workers) |
11.1 |
32.6 |
5.5 |
5.7 |
-3.2 |
-3.8 |
-16.9 |
Qualified industrial workers |
-0.7 |
10.1 |
-0.4 |
-2.9 |
-0.9 |
-6.9 |
-10.3 |
Operators, instrumentation worker |
-0.2 |
9.0 |
0.8 |
-2.2 |
1.3 |
-7.2 |
-16.4 |
Unskilled workers |
1.2 |
15.3 |
6.0 |
1.2 |
5.8 |
-8.3 |
-12.2 |
Compiled according to the collection "Indicators of Education: 2017". Note to Table 1: HPO - Higher Professional Education; IHPO - Incomplete Higher Professional Education; SVO - Secondary Vocational Education; PVO - Primary Vocational Education; BGE - Basic General Education.
Higher- and middle-level managers receive the highest return from education, while the qualification potential of top-level specialists is not fully realized, and industrial workers (especially skilled workers) are in the worst situation due to the raising of the education level to secondary vocational education. These trends discourage skilled workers from carrying out their professional activities, and for young specialists, as we will show later, these trends are a negative educational signal.
The Initial sample for in-depth analysis of data from all RLMS, longitudinal study of households on the basis of stratified multistage sampling. RLMS databases opened for access in 2016, plan for about 18 years (21 waves), the average sample for the wave is about 20 000 observations. The basic data includes about 800 variables, including information on the social and economic situation of individuals, a detailed description of their level of education, information on employment, including qualification, professional and industrial affiliation, health information, etc. For the purposes of this study, a section was used that included individual data, while in the analysis of the various restrictions imposed on age and employment, in addition, seizures for various independent variables, including extreme ones, were excluded using the analysis of box diagrams. In order to study the state of human capital, only data on the employed population at working age (currently employed or on paid leave) were taken for analysis from 2003 to 2016 (covering 12-21 waves of RLMS). On the basis of cross-sectional data for the period from 2003 to 2016, we constructed regression equations based on two initial models. The calculations were based on the statistical data of the base of the Russian Monitoring of the Economic Situation and Health of the Population (RLMS)
The results of the regression analysis carried out for the initial sample given in Table 2.
Table 2
Regression analysis results for the proposed model 5
Variables |
2016 |
2015 |
2014 |
|||
Coefficient. |
Coefficient. |
Coefficient. |
||||
β, ξ |
t- stat. |
β, ξ |
t-stat. |
β, ξ |
t-stat. |
|
(Сonstant) |
8,481 |
157,0 |
8,534 |
178,6 |
8,433 |
170,6 |
Number of years of education |
,073* |
22,8 |
,064* |
21,2 |
,063* |
19,9 |
Experience of production |
,001 |
1,3 |
,002 |
3,4 |
,002 |
4,0 |
Special experience of production |
,008* |
9,5 |
,006* |
7,2 |
,005* |
5,9 |
Gender male |
,275* |
20,7 |
,315* |
24,2 |
,302* |
24,0 |
Chiefs |
,263* |
16,2 |
,297* |
19,2 |
,280* |
18,2 |
State property |
-,078* |
-5,7 |
-,085* |
-6,2 |
-,118* |
-8,9 |
Penza region |
-,359* |
-6,8 |
-,451* |
-8,5 |
-,458* |
-9,1 |
Altai region |
-,275 |
-7,2 |
-,255* |
-6,5 |
-,458* |
-8,6 |
Kaluga region |
-,075 |
-1,4 |
-,079 |
-1,6 |
-,225** |
-4,9 |
Volgograd region |
-,279* |
-5,9 |
-,223 |
-4,7 |
-,264* |
-5,8 |
Kabardino-Balkaria |
-,254** |
-4,0 |
-,239 |
-3,2 |
-,425* |
-6,1 |
Tambov Region |
-,131 |
-2,9 |
-,219 |
-4,9 |
-,253* |
-5,7 |
Amur region |
-,073 |
-1,6 |
-,204 |
-4,3 |
-,093 |
-2,0 |
Stavropol region |
-,159 |
-3,3 |
-,182 |
-3,9 |
-,232** |
-4,8 |
Chuvash Republic |
-,200** |
-4,5 |
-,215 |
-4,8 |
-,242* |
-5,3 |
Udmurt Republic |
-,128 |
-3,1 |
-,145 |
-3,5 |
-,137** |
-3,4 |
Saratov region |
-,080 |
-2,2 |
-,094 |
-2,7 |
-,150** |
-4,3 |
Orenburg region |
-,002 |
0,0 |
-,086 |
-2,0 |
-,081 |
-1,9 |
Kurgan region |
,062 |
1,3 |
,046 |
,9 |
,037 |
,8 |
Tver region |
,017 |
0,4 |
-,041 |
-,9 |
-,017 |
-,4 |
Perm Region |
-,001 |
0,0 |
-,070 |
-1,7 |
,009 |
,2 |
Krasnodar region |
,203** |
4,2 |
,152 |
3,3 |
,156** |
3,6 |
Lipetsk region |
-,031 |
-0,7 |
-,098 |
-2,6 |
-,003 |
-,1 |
Chelyabinsk region |
,075 |
2,1 |
,012 |
,3 |
,017 |
,5 |
Smolensk region |
,134 |
2,6 |
,095 |
1,7 |
-,025 |
-,5 |
Tatarstan Republic |
,127** |
3,1 |
,116 |
2,8 |
,126** |
3,0 |
Tula region |
,099 |
2,2 |
,206 |
4,2 |
,128 |
2,7 |
Novosibirsk region |
,206** |
4,3 |
,080 |
1,6 |
,170** |
3,5 |
Krasnoyarsk region |
,365* |
8,3 |
,209 |
4,6 |
,295* |
6,6 |
Nizhny Novgorod Region |
,197** |
4,5 |
,158 |
3,5 |
,130 |
2,9 |
Tomsk Region |
,204** |
4,9 |
,180 |
4,3 |
,144 |
3,5 |
Leningrad region |
,452* |
12,5 |
,405* |
11,6 |
,404* |
12,1 |
Primorsky region |
,491* |
10,0 |
,371* |
7,4 |
,418* |
8,0 |
Komi Republic |
,541* |
15,2 |
,524* |
15,0 |
,509* |
15,1 |
Moscow region |
,620* |
22,1 |
,615* |
22,5 |
,618* |
22,6 |
Light industry |
,024 |
0,9 |
,015 |
,6 |
,031 |
1,2 |
Civil mechanical engineering |
-,002 |
-0,1 |
,005 |
,1 |
,050 |
1,4 |
Military-industrial complex |
,113 |
2,5 |
,073 |
1,7 |
,021 |
,5 |
Oil and gas industry |
,302* |
8,1 |
,381* |
9,9 |
,362* |
9,7 |
Heavy industry |
,137** |
4,0 |
,139** |
4,1 |
,134** |
4,1 |
Power industry |
,107 |
2,6 |
,152 |
3,6 |
,117 |
2,8 |
R2 |
0,354 |
0,308 |
0,311 |
|||
Adjusted R2 |
0,350 |
0,306 |
0,306 |
|||
F- statistics |
98,780 |
59,851 |
62,521 |
|||
Fcr (p=0,01) |
1,59 |
1,59 |
1,59 |
|||
Statistics of Durbin-Watson |
1,852 |
1,785 |
1,998 |
|||
Number of observations |
7626 |
7845 |
8852 |
|||
* – significant at 1% level** – significant at 5% level.
As can be seen from the above analysis, when more factors are included in the nonlinear model, the determination coefficient increases, however, the newly introduced variables are not significant in most cases, which is reflected in the F-statistic index [Shirinkina, 2018. Р. 20]. On average, in the period under review in industrial sectors, the return on education was at the level of 6-8% for each additional year of education, while the returns from accumulated production experience are insignificant, and in some cases negative. The obtained indicators of the level of output from education differ somewhat (by 2-3%) from the results considered in the studies [Sumarokova, 2002; Leslie, 1988; Prokushev, 2008; Karatkevich, 2011]. It is possible that the discrepancies arise from the incompatibility of the results when different models are used, the table shows that with an increase in the number of variables and the introduction of nonlinear independent parameters, the recoil rate increases, approaching the value of 8%.
Further, we give the results of regression analysis from the model reflected in equation 6.
Table 3
Regression analysis results for the proposed model 6
Variables |
2016 |
2015 |
2014 |
|||
Coefficient. |
Coefficient. |
Coefficient. |
||||
ψ |
t-stat. |
ψ |
t-stat. |
ψ |
t-stat. |
|
(Сonstant) |
9,977 |
142,2 |
9,578 |
136,6 |
9,556 |
117,5 |
Senior and middle management |
-,045 |
-,6 |
,225 |
3,1 |
,185 |
2,2 |
Specialists of the highest qualification level |
-,283 |
-4,0 |
-,124 |
-1,8 |
-,129 |
-1,6 |
Specialists of intermediate skill level |
-,411 |
-5,9 |
-,178 |
-2,6 |
-,188 |
-2,4 |
Office workers |
-,556 |
-7,4 |
-,341 |
-4,7 |
-,351 |
-4,3 |
Workers in the sphere of trade and services |
-,505 |
-7,1 |
-,307 |
-4,4 |
-,418 |
-5,3 |
Skilled workers (manual labor) |
-,256 |
-3,6 |
,011 |
,1 |
,007 |
,1 |
Skilled workers (automated labor) |
-,229 |
-3,2 |
,052 |
,7 |
,031 |
,4 |
Unskilled workers |
-,600 |
-8,3 |
-,342 |
-4,9 |
-,389 |
-4,7 |
Secondary vocational education |
-,136 |
-4,8 |
-,102 |
-4,6 |
-,112 |
-2,9 |
Higher vocational education |
-,080 |
-4,8 |
-,097 |
-5,6 |
-,075 |
-3,5 |
Knowledge of foreign languages |
,170 |
9,3 |
,219 |
12,1 |
,173 |
8,6 |
Using your computer at work |
,128 |
4,0 |
,116 |
3,8 |
,224 |
8,1 |
Using the Internet at work |
,179 |
5,9 |
,198 |
6,9 |
нет |
нет |
Married |
0,27 |
3,0 |
,050 |
2,7 |
,065 |
2,7 |
Have children |
0,64 |
3,1 |
,063 |
3,1 |
,083 |
3,4 |
The days of work on sick leave are missed |
,013 |
0,7 |
,008 |
0,4 |
,036 |
1,5 |
Health self-esteem is good |
,022 |
0,4 |
,089 |
1,8 |
,052 |
1,0 |
Presence of chronic diseases |
,009 |
0,6 |
,014 |
0,9 |
,000 |
0,0 |
R2 |
0,139 |
0,187 |
0,177 |
|||
Adjusted R2 |
0,137 |
0,181 |
0,171 |
|||
F- statistics |
87,335 |
81,026 |
40,290 |
|||
Fcr (p=0,01) |
1,936 |
1,936 |
1,968 |
|||
Statistics of Durbin-Watson |
1,854 |
1,925 |
1,642 |
|||
Number of observations |
8673 |
8971 |
5814 |
|||
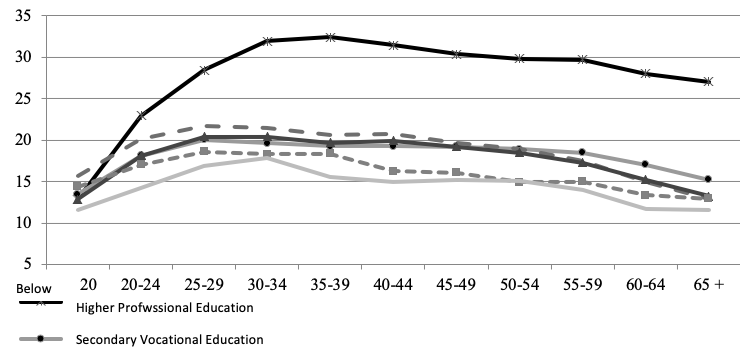
Analysis of the distribution diagrams of the average salary by age groups showed that the effect of age on earnings is significant only on the interval from 20 (in some cases - 16) to 30 years, the point of inflection of the earnings profile falls on the age of 31-32 years, after which the earnings dynamics become damped. The identification of this trend, which is also confirmed by the general sample in Russia, cited above, makes it necessary to single out in the first model two stages - exit and adaptation in the labor market of young specialists (up to 31 years) and the stage of normal functioning in the labor market (normal participation in the labor force, from 31 to 55 years). For workers of industrial enterprises, this dynamics of changes in wages remains with age. Thus, in the future, three sets of data (with two age limits) were considered for the first variant - the aggregate set of observations, for the second - the age restriction in the interval from 15 to 30 years, for the third - in the interval from 31 to 55 years. A detailed regression analysis is given in Appendix D, and general comments and conclusions on the analysis of the labor market of young specialists are given below (Figure 4).
Figure 4
Dependence of the logarithm of wages on age (2016)
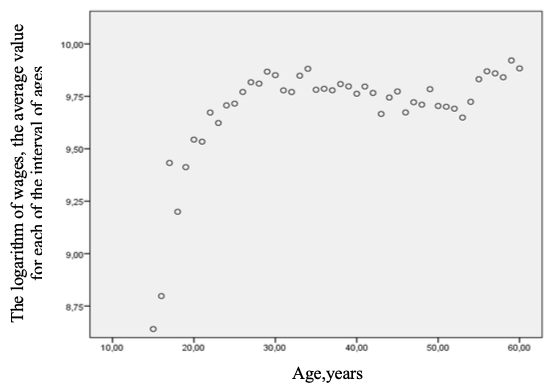
As can be seen from the diagrams, the entry to the labor market is accompanied by a significant increase in earnings, similar trends are observed in all sectors of the economy, especially a significant drop in earnings at the age of 22-25 is observed for workers in high-tech industries, IT and communications. In some countries (for example, the USA), the excess of the earnings function with age (the highest point of earnings), as a rule, is shifted in the direction of 40-50 years, and not 30-35 as in the Russian conditions.
Actually, this indicator is one of the key to understanding the trends in the accumulation and use of human capital, however, as the study showed, its contribution compared with some qualitative variables remains insignificant. In this study, we used an empirical form of estimating the number of accumulated years of education, which became possible due to the substantial detail of all the data on education in the RLMS. In this indicator were also included the passage of training in special courses, etc. The average amount of return from accumulated years of education, calculated on the basis of the proposed models, is at a consistently low level.
Table 4
The level of return from accumulated education for the employed population aged 16 to
60 years, in percent for each accumulated year of education
(calculated on the basis of the first proposed model)
Rate of return by group |
2016 |
2015 |
2014 |
2013 |
2012 |
2011 |
2010 |
All employed population aged 16-60 years |
6,4 |
6,3 |
7,3 |
8,0 |
8,5 |
7,6 |
7,7 |
Workers of industry, men |
3,9 |
4,1 |
4,9 |
5,8 |
4,0 |
5,8 |
3,3 |
Workers of industry, women |
5,3 |
5,5 |
6,3 |
7,4 |
7,3 |
6,2 |
7,5 |
Workers of industry, 15-30 years old |
10,3 |
11,0 |
10,9 |
11,4 |
8,7 |
8,6 |
8,8 |
Workers of industry, 31-50 years old |
4,6 |
4,9 |
5,7 |
4,8 |
5,7 |
5,4 |
5,1 |
Analysis of the influence of this factor made it possible to calculate the level of individual returns from each accumulated year of education (Table 4). The average amount of accumulated years of education for the initial sample in 2016 was 12.9 years, slightly higher than the average for Russia (11.73 years in 2012).
As can be seen from Table 4, education increased its contribution to wages throughout 2012 through 6.5-8.5%, the greatest impact was with the weakening influence of other factors in crisis and post-crisis years. The return on individual human capital for industrial workers is generally lower than for those employed in the economy as a whole. In general, women receive a greater return for each year of education, as well as young people under the age of 30: for this category of employed (considered mostly as recent graduates of vocational schools), the return from formal education becomes higher for natural reasons. For workers at the age of 31, the level is approaching the industry average for both sexes, as will be seen later, in this period the negative contribution to the return is made by the production experience, it also explains the decline in the role of the accumulated formal education. Additional analysis shows that the greatest gap in the return on human capital is observed in light industry, military-industrial complex and civil engineering. Thus, it can be concluded that industrial enterprises throughout the period under review use human capital with a lower efficiency than the economy as a whole.
Production experience. This indicator is also one of the key characteristics of human capital, it reflects the ability of firms to reproduce human capital through investment in training in the workplace or additional short-term vocational training, thus developing the foundation of formal education. In most cases, formal education only serves as a signal to the employer about the ability of employees to learn further, so the production experience reflects the quality of human capital accumulated by a particular branch of the economy, that is, its ability to meet the current and strategic objectives of the enterprise. Analysis of the Russian labor market shows that the return on each year of production experience is a very unstable indicator, the study of box diagrams shows that there is no clear pattern in the change in the logarithm of wages due to the accumulation of production experience. The analysis of production experience among the employed population aged 15 to 30 (about 2-4% during the period under review) shows somewhat better results, with age the regression coefficient in this indicator becomes negative and not significant at the level of up to 10%. For developed countries, this indicator is in the range of 6-8% for the initial period of labor activity and tends to zero, and reaching the level of 34-35 years becomes negative.
Special production experience. Work in one enterprise for a certain period leads to accumulation of special human capital, which can be used only within the framework of the particular enterprise under consideration. The theoretical definition of special human capital, reflected in years of special production experience, is somewhat different from the empirical approaches to its identification. In the latter case, they usually consider years of continuous work experience, which for the sample of RMEZ for industrial workers is about 6.7 years in 2015 (when compared with previous studies, this indicator has no clearly pronounced dynamics and has fluctuated over the past 10 years in the range of 6.5-7% . For developed countries, this indicator is close to the level of 11-12 years on average per employed person in the economy. The contribution of special experience (or seniority) to increasing earnings remains practically insignificant within 0.5% per year.
Gender. In this case, by gender, we will understand biological sex to a greater extent than to take into account its social significance (since otherwise is not indicated in the initial comments on the description of the sample data). Gender is one of the most significant factors contributing to the level of earnings, while this qualitative indicator does not refer to the characteristics of human capital. In different years during the period under review, the gender supplement to wages was about 35% with a positive sign (gender "male" = 1), not lowering, however, below the 26% mark.
Chiefs (management positions). In this case we took into account those employed in the economy, who have 1 or more subordinates at work (the definition of the category of employed "chiefs"). The ability to exercise leadership is a special qualitative characteristic of human capital, which reflects the ability to solve specific organizational tasks. Naturally, this factor also made a significant contribution (in comparison with the traditional indicators of human capital) in the growth of earnings. The increase in wages for this category is on average about 30%, sometimes reaching 40%. Unlike the gender parameter, this indicator was more affected by the impact of the 2008 economic crisis, taking into account the lag effect in 2012, the economic situation in the labor market led to a significant reduction in the contribution of this factor to the growth of wages.
As can be seen from Table 5, the highest premiums to wages are earned by experienced industry executives (over the age of 31), in this respect employers are conservative throughout the study period, because young leaders receive on average a 4-5% to wages, all other things being equal. When considering the dynamics of premiums for managers in the gender perspective, there is no pronounced dynamics, however, in recent years there has been a tendency to equalize the salaries of male and femaleleaders.
Table 5
The level of premiums to wages for managers of various categories, depending
on age and sex, in percent (with a positive value of the sign "bosses" = 1)
Category of employed |
2016 |
2015 |
2014 |
2013 |
2012 |
2011 |
2010 |
All employed population from 15 to 55 years old |
29,7 |
28,0 |
27,3 |
25,4 |
30,3 |
28,9 |
32,6 |
Workers of industry, men |
31,8 |
26,6 |
27,2 |
25,0 |
31,1 |
21,8 |
30,6 |
Workers of industry, women |
30,9 |
25,9 |
35,4 |
25,4 |
30,7 |
29,5 |
46,9 |
Workers of industry, 15-30 years |
30,5 |
23,1 |
23,6 |
25,9 |
26,9 |
20,3 |
38,8 |
Workers of industry, 31-55 years old |
30,7 |
25,8 |
31,5 |
26,4 |
30,2 |
27,5 |
31,4 |
Form of ownerships of the enterprise. Inclusion of this indicator in the overall model allows determining the effectiveness of the use of human capital organization of various forms of ownership - public (in whole or in part, which is relevant for certain industries, especially the military-industrial complex) and private. As the research shows, with other things being equal, employees of state enterprises receive a consistently lower salary (negative premium). However, the marked "loss" in earnings is reduced evenly during the period under review, from -21% in 2010 and coming to a minimum of -8.5% in 2016. During the last five years, this indicator was at a stable level and did not exceed -12%.
Regional factor. Proceeding from an elementary analysis of the average wage and the regression analysis we have given, we can conclude that the distribution of salaries in the territorial division is uneven. The latter testifies to the high efficiency of investments in the mobility of individual human capital, which consists in finding work in regions that have adequate infrastructure that can provide the maximum return on the realization of their own knowledge and skills in the labor market. The reasons for the observed territorial differentiation can be, on the one hand, a large concentration of capital and a focus on financial flows that promote the development of the local labor market and make it more competitive - a similar situation is observed. For example, in the Moscow and Leningrad regions (in them territorial "premiums" to wages. Other conditions being equal, the payments are from 20 to 70% In addition to the high degree of concentration of capital; these regions tend to have a developed institutional environment. On the other hand, there are regions that are free with respect to the average wage level, but at the same time having higher values of district coefficients and a significant amount of income from the sale of products with low added value, for example, hydrocarbon raw materials (from those considered to the Republic of Komi belongs to it.) For the purpose of a more in-depth analysis, based on the average territorial award in the period from 2010 to 2016, we divided the regions into four categories, The first involves very affluent (regional prize average 25% or more), affluent (premium is from 0 to 25%), dysfunctional (negative premium to 25%) and depressive (negative premium below 25%).
Table 6
Distribution of the impact of education on the studied regions
from 2006 to 2012,% for each year of formal education
Region category by salary level |
2016 |
2015 |
2014 |
2013 |
2012 |
2011 |
2010 |
Very prosperous |
6,8 |
6,6 |
8,1 |
7,4 |
6,7 |
6,6 |
7,2 |
Prosperous |
6,8 |
5,3 |
6,0 |
6,5 |
5,7 |
6,2 |
9,7 |
Unfortunate |
4,9 |
5,6 |
7,4 |
7,1 |
6,5 |
7,0 |
8,1 |
Depressive |
7,7 |
7,2 |
8,3 |
8,7 |
6,0 |
8,1 |
7,8 |
Table 6 shows the analysis of the returns to the level of education for different categories of regions, the return on human capital is increased in depressed regions due to the weakening of other factors considered in the first model.
One of the observed regularities is related to the level of accumulated years of education (Table 7): with a decrease in the category of the region, this indicator is evenly reduced, the gap in this indicator for extreme categories is up to 0.6 years (in 2016).
Table 7
The distribution of the number of accumulated years of
education by studied regions, years per employed person
Region category by salary level |
2016 |
2015 |
2014 |
2013 |
2012 |
2011 |
2010 |
Very prosperous |
13,2 |
13,0 |
13,1 |
13,1 |
13,1 |
13,2 |
13,2 |
Prosperous |
13,1 |
13,1 |
13,2 |
13,2 |
13,2 |
13,1 |
13,1 |
Unfortunate |
12,8 |
12,9 |
13,1 |
13,1 |
12,9 |
12,9 |
12,8 |
Depressive |
12,6 |
12,8 |
12,9 |
12,9 |
12,8 |
12,8 |
12,7 |
Industries. The first of the proposed models also takes into account the sectoral factor, for the purposes of the study, six industries, including the military-industrial complex and the oil and gas industry, were examined in detail. The most negative impact on export-oriented industries in terms of the level of wages, primarily oil and gas, was the impact of the global economic crisis, as can be seen in the comparative analysis of the first model, the decrease in salaries was more than 15% in 2012 compared to the previous year and the order 10% in 2013. These industries, as a rule, are insensitive to the loss of accumulated human capital and the situation in them largely depends on the conjuncture of world markets.
The restriction of the number of observations in individual sectors makes it difficult to make an in-depth regression analysis of the return on human capital, so special attention was paid to estimating the sample size and the corresponding coefficients of the regression equation (for t-statisticians). As can be seen from Table 8, for some industries for a number of years it was not possible to obtain correct values of the recoil indicator.
Table 8
The rate of return on education for different industries
from 2006 to 2013, in % for each year of education
Industries |
2016 |
2015 |
2014 |
2013 |
2012 |
2011 |
2010 |
Light industry |
5,5 |
6,0 |
7,0 |
7,9 |
- |
7,3 |
7,1 |
Civil mechanical engineering |
6,5 |
4,9 |
6,4 |
5,4 |
- |
6,9 |
- |
Military-industrial complex |
4,9 |
3,6 |
3,8 |
- |
5,7 |
- |
6,8 |
Oil and gas industry |
6,1 |
4,0 |
3,3 |
- |
6,0 |
7,7 |
4,6 |
Heavy mechanical engineering |
4,7 |
4,2 |
4,1 |
4,2 |
- |
- |
6,0 |
Power industry |
5,6 |
5,5 |
3,6 |
3,6 |
5,8 |
5,2 |
5,7 |
Further in Table 9 data on the weighted average indicator of accumulated years of education for the industries under consideration are given. Taking into account the previous analysis, the military-industrial complex uses the accumulated human capital least efficiently, the level of salaries in the industry is low, as well as the level of return from accumulated education. The workers of heavy engineering receive a stably low return on human capital, in recent years; it does not exceed 4.7%.
Table 9
The distribution of the number of accumulated years of education
for different industries, years per employed person
Industries |
2016 |
2015 |
2014 |
2013 |
Light industry |
12,4 |
12,7 |
12,7 |
12,6 |
Civil mechanical engineering |
12,9 |
13,1 |
13,0 |
13,0 |
Military-industrial complex |
13,4 |
13,4 |
13,3 |
13,4 |
Oil and gas industry |
13,1 |
13,4 |
13,3 |
13,4 |
Heavy mechanical engineering |
12,6 |
12,7 |
12,7 |
12,8 |
Power industry |
13,1 |
13,5 |
13,6 |
13,0 |
The majority of those employed in the military-industrial complex excessively invest in individual human capital, which is evident from the consistently high level of formal education, while human capital in light industry and civil engineering is underutilized.
Qualification level of employees. The second of the proposed models included the analysis of qualitative parameters, among which the qualification level of employees plays a crucial role. Positive impact on earnings (as already noted above) renders the status of a leader; this factor has the greatest influence among the others considered. Regression coefficients for skilled workers are usually not significant; however, workers who are engaged in automated labor receive a greater return on accumulated human capital.
Special types of human capital. To this factor, within the framework of the study, we attributed the knowledge of foreign language (language competence) and the use of computers and the Internet for the purposes of work (the so-called innovative components of human capital). Knowledge of a foreign language, as analysis shows, leads to an increase in wages in different years in the range of 14-22% in all industrial sectors. For some industries, this indicator is unstable, for example, for the military-industrial complex it has a negative value, and for oil and gas and energy - the maximum positive (up to 24%). In general, unstable results are obtained for innovative components of human capital, the use of computers and the Internet for work brings a gain in earnings also for workers in the oil and gas industry and heavy engineering.
Social capital. One of the components of human capital is social capital, which by definition includes values, attitudes, communication skills and social status that have a certain value in the labor market. In some modern works on the topic of social capital, the role of the latter in complex interactions within the organization, the influence of communicative competencies on the probability of career advancement, the effectiveness of the performance of team work, etc. are studied. For the purposes of this study, selected elements of social capital were used: marital status and the presence of relatives or adopted children. Inclusion of these indicators in the regression model makes it possible to study the indirect influence of the social policy of enterprises on the capabilities of employees in the reproduction of human resources and the formation of human capital in the early stages through upbringing.
The capital of health. The only significant factor of the three health studies examined was health self-assessment (in the RMEZ questionnaire, the evaluation was conducted on a scale of 1 to 5). A good and very good self-assessment of health in 2012 led to an increase in wages of 8%, in 2009, the presence of chronic diseases, all other things being equal, led to a decrease in wages by 5-6%. In general, we note that the employees' health status is of little interest to employers, since the presence of missed sick days and the presence of chronic diseases do not worsen the competitiveness of industrial workers in the labor market.
Based on the results of the regression analysis carried out using the proposed models, it is possible to draw conclusions about certain features of the factors that contribute to the growth of wages. In general, specific indicators of human capital, such as the level of education, the availability of special expertise and special competencies play a significant but not decisive role in the growth of incomes of the employed population. Formally, the level of stocks of human capital remains very high. However, the gender dimension, industry affiliation of the enterprises and the region in which the work is carried out, as a rule, play a key role in the distribution of earnings in the Russian labor market. In all industries, human capital is used with low efficiency, with a generally high level of formal education and production experience; the individual returns from each of these indicators remain rather low. It follows that employees of Russian enterprises excessively invest in their own human capital, which employers are not able to fully engage in economic turnover. Indicators of special human capital remain also relatively low and suggest that the employed population in Russia is 1.5-2 times more likely than in developed countries to change jobs during the period of labor activity.
Abakumova I.V., Antonova E.K., Baigulov R.M., Belyaeva, S.V. (2016). Nauchnye issledovaniya v sfere social'no-ehkonomicheskih i gumanitarnyh nauk: mezhdisciplinarnyj podhod i konvergenciya znanij. [Scientific researches in the field of socio-economic and humanitarian sciences: interdisciplinary approach and convergence of knowledge], Samara, 369 р.
Baigulov R.M., Belyaeva S.V., Golubeva G.F. (2016). [The results of socio-economic and interdisciplinary scientific research of the XXI century], Samara, OOO "Etching", 2016, 434 p.
Balatsky E.V. (2000). Diskontirovanie pri ocenke ehffektivnosti investicij v chelovecheskij kapital [Discount factor in calculating the profitability of investments in human capital, «Society and Economics»]. № 11, рр. 11-12.
Becker G.S. (1964). Human Capital: A Theoretical and Empirical Analysis. Columbia University Press for NBER, 424 р.
Kapelyushnikov R.I. (2006). Obrazovatel'nyj potencial i ego svyaz' s harakteristikami rynka truda: opyt Rossii [Educational potential and its relationship with the characteristics of the labor market: the Russian experience, «Economic Policy»]. No. 4, рр.166-195.
Kapelyushnikov R.I. (2004). Politika zarabotnoj platy rossijskih predpriyatij [The policy of wages of Russian enterprises / R.I. Kapelyushnikov, «Bulletin of Public Opinion. Data. Analysis. Discussions»]. No. 4, рр. 48-69.
Kapelyushnikov R.I. (2009). Transformaciya chelovecheskogo kapitala v rossijskoj ehkonomike [Transformation of human capital in Russian society], Moscow: The Liberal Mission Foundation, 2009. 196 p.
Kapelyushnikov R. I. (2013). Okazyvaet li ehkonomicheskij ehffekt obrazovanie? [Has the economic impact of education fallen? «Economics of Education»]. No. 1, рр. 44-50.
Karatkevich S.G. (2011). Sistema pokazatelej ocenki chelovecheskogo kapitala [The system of indicators of human capital assessment, «Issues of Economics and Law”]. No. 7, рр.76-78.
Leslie L., Brinkman P. (1988). The Economic Value of Higher Education. N. Y . Macmillan Publishing Company, 1988.
Mincer J. (1985). Intercountry Comparisons of Labor Force Trends and Related Developments: An Overview [Journal of Labor Economics], Vol. 3, No. 1, pp. 1-32.
Mincer J. (1974). Schooling, experience and earnings. N.Y. Columbia University Press, 246 р.
Shirinkina E.V. (2018). Upravlenie chelovecheskim kapitalom v cifrovoj ehkonomike [Human capital management in the digital economy, «Human resource and intellectual resources management in Russia»]. Vol 7, No. 2, рр. 18-22.
Shirinkina E.V. (2018). Povyshenie konkurentosposobnosti vypusknikov vuzov kak nositelej chelovecheskogo kapitala v ehkonomike znanij [Enhancing the competitiveness of university graduates as carriers of human capital in the knowledge economy, «Economics of Education»]. No. 4 (107), рp. 70-78.
Shirinkina E.V. (2018). [The role of the human factor in the digital development of the Russian economy, «Economics and Entrepreneurship»]. No. 8 (97), рp. 182-185.
Shu-Chi Lin, Yin-Mei Huang. (2005). The role of social capital in the relationship between human capital and career mobility. Vol. 6 No. 2, 2005, pp. 191-205.
Sumarokova, E.V. (2002). Metodologiya investirovaniya v issledovanii chelovecheskogo kapitala [Methodology of investing in human capital research] / Dis ... Cand. Econ. Sci., Moscow, 2002, 121 р.
Prokushev, E.F. (2008). Ocenka chelovecheskogo kapitala organizacii [Assessment of the human capital of the organization], Belgorod: Cooperative Education, 2008.- 126 pp.
Psacharopoulos G., Patrinos H.A. (2004). Returns to investment in Education: a further update. Education economics, Vol. 12, No. 2, рр. 76-90
Vryonides M., Lamprianuou I. (2013). Education and social stratification across Europe. International Journal of Sociology and Social Policy. Vol. 33 No. 1/2, 2013, pp. 77-97.
Willis R.J. (1987). Wage determinants: A survey and reinterpretation of human capital earnings functions. O. Ashenfelter & R. Layard (ed.), Handbook of Labor Economics, ed. 1, vol. 1, ch. 10. , pp. 525-602.
1. Surgut State University, Lenin Street, 1, Surgut, Russia 628412. Email: shirinkina86@yandex.ru
2. Surgut State University, Lenin Street, 1, Surgut, Russia 628412. Email: balsak1@yandex.ru
3. Surgut State University, Lenin Street, 1, Surgut, Russia 628412