![]() ISSN 0798 1015
ISSN 0798 1015

![]() ISSN 0798 1015
ISSN 0798 1015
Vol. 40 (Number 14) Year 2019. Page 11
PRATO, José G. 1; MILLÁN, Fernando 2; LUCENA, María E. 3; GONZÁLEZ, Luisa C. 4; ARAQUE, Judith 5; DJABAYAN, Pablo 6 y USTARIZ, Javier 7
Received: 15/11/2018 • Approved: 10/04/2019 • Published 29/04/2019
ABSTRACT: The Albarregas river flows through the city of Mérida and receives wastewater from urban sewage. The objective of this study was to evaluate physical, chemical and biological parameters along the river. The Results showed a diminished water quality downstream of the river. Dissolved oxygen decreased by 3 mg L-1 and dissolved H2S increased between 8 and 17.4 mg L-1. Biological analysis showed the presence of coliforms and fungi in considerable amounts. |
RESUMEN: El río Albarregas atraviesa la ciudad de Mérida y recibe aguas residuales provenientes de los desechos urbanos. El presente trabajo tuvo como objetivo evaluar algunos parámetros físicos, químicos y biológicos, a lo largo del rio. Los resultados muestran un deterioro de la calidad del agua del río aguas abajo. Hay una disminución de 3 mg L-1 de oxígeno disuelto y un incremento entre 8 y 17,4 mg L-1 de H2S disuelto, el análisis biológico muestra presencia de coliformes y hongos en cantidades apreciables. |

The Albarregas river flows through Mérida city, in Venezuela, from northeast (NE) to southwest (SW). It has its origin at 4,200 m of altitude (Páramo Los Conejos) and flows for 31 km until it reaches the Chama river at 1,000 m of altitude at the south side of the city (CCD-UPC/rediALA, 2005). As the river flows downwards through the city, receives wastes coming from the urban sewage system causing an environmental problem that affects not only the Albarregas itself, but the city and the Chama river, to which the Albarregas is an affluent. Finally, the Chama empties into the Maracaibo Lake, becoming the last receptor of this contaminated water. Up to the year 1994, more than 40 wastewater discharges to the Albarregas were identified, from which 80 % were direct discharges and 20 % were indirect discharges through other affluents like the Milla, Gavidia and La Pedregosa rivers. This situation has raised the concern of the population owing to an environmental problem that keeps getting worse in time. During the decade of eighties several studies were carried on the Albarregas river and its water quality, most of which were not published in specialized literature. (Moreno, 1980; Ballester, 1980; Amundaraín, 1985; Duran et al., 1995 and Vivas, 2000). Their main goal was to quantify biological parameters. The presence of pathogenic microorganism and fecal coliforms were reported. Biochemical Oxygen Demand (BOD) levels did not comply the normative. One of the first publication on this matter was made by Burguera and coworkers (Burguera et al., 1986), they carried out a physicochemical and biological characterization along the urban area of the river during 6 months. Results showed no chemical contamination with all parameters complying the normative. However, bacterial pollution did grow as the river flowed through the city. After this publication, additional information about this problem has not been well documented. Rivas and Ramoni (2007), made a contingent valuation study to estimate the citizen’s willingness to pay a tax for the cleaning of the river. Results showed that 75 % of the city’s population would be open to pay one fifth of their water bill to contribute with a sanitation project because it is believed that the official water department cannot manage the cost of this kind of project alone. Such initiative will allow for the recovering of a touristic and recreational space in the city, like a Central Park, which is already officially approved by Presidential decree from 1979 (ULA – PAMALVA Project, 2009), but it still lacks political willingness to be accomplished. The biggest concern of the community is the fact that an increasing number of poor families have established their homes along the edges of the river becoming exposed to this contaminated water. Not only that, but they have also become a source of contamination since they use this water for their daily household needs. These settlements are located on a municipally-owned-soil which belongs to the Albarregas Central Park. Even though, there is a headquarters of an environmental agency located very close to the settlements, and no action has been taken yet to tackle the problem. The most recent study on Albarregas´ river water quality was conducted by Mayorga et al., in 2017, where the effects of wastewater generated by the urban population on two of the four rivers that flow through the city, Milla and Albarregas, were studied. Results indicated that during the sampling period, upstream, both bodies of water presented a Water Quality Index (ICA) above 80 (ranging from 0: poor to 100: excellent) indicating that the water quality was good and that it can be used for human consumption. However, when passing through the city, the index rapidly decreased (below 50 in some cases), meaning that the water quality diminished being categorized as either regular or bad.
The Albarregas river basin is located in the city of Merida in Venezuela, between 080 33´ 00´´ and 080 43´00´´ north latitude and 710 07´40´´ and 710 13´10´´ west longitude, covering an area of approximately 12,000 ha.
Water classification: According to official decree 883 (Gaceta Oficial 5021 República de Venezuela, 1995) about classification and control of water bodies and liquid effluent discharges, Albarregas’ water could be classified as type 4C, destined for entertainment and aquatic sports like fishing, because the river is part of the so called “Albarregas Metropolitan Park”. Nevertheless, with the current river situation, a more accurate classification (although debatable) would be type 7, which is the category designated for aquatic transportation and the dispersion of pollutants without negatively impacting the environment.
Figure 1 shows the geographical location of the 4 equally spread sampling points along the river. The first one is located at the Plaza de Toros (PT), the second at the La Cruz Verde Bridge (CV), third at the Santa Bárbara neighborhood (SB) and the last one on the southside of the city in a place called La Mata Bridge (LM). For 2 months (from May to July, 2018) samples were taken each fifteen days (4 sampling acts: S1, S2, S3 and S4) at the center and right edge of the river.
Samples sites were chosen to match with areas of the city where the urban activity was greatest. It is believed that some of the largest amounts of wastes and sewage discharges into the river take place around these points.
Figure 1
Sampling points along the
Albarregas river in Mérida city
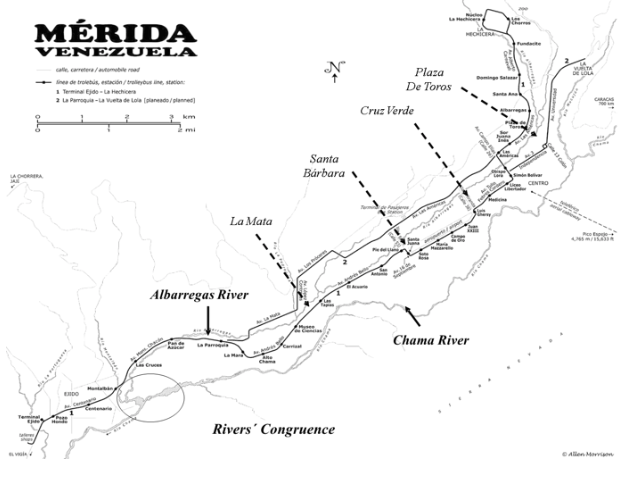
Last sampling point (LM) should have the highest pollution levels due to its location (downstream of the city), meaning that it has probably received the greatest amount of discharges throughout its journey. Samples for Dissolved Oxygen (DO) and Biochemical Oxygen Demand (BOD5d at 20 ºC) analysis were taken in 250 mL Winkler bottles and kept in ice baths until processing. Samples for all other analysis were collected in 5 L plastic bottles and kept at 4 oC until their analysis (in the following 5 days). For metal profile determination 6 samples of the edge and middle of the river at LM sampling point were taken and acidified with 1 mL of 1 % HNO3 to keep metallic species in their ionic form.
Dissolved oxygen (DO) and Biochemical oxygen demand (BOD5d) were determined using the Winkler method (Crosson and Giba, 1992). The latter was only done on samples 4 and 6. pH was determined with a Hanna 211 pHmeter. A Trans Instrument HC3010 Conductimeter was used to measure conductivity in the samples, and metallic profile was determined by AE ICP. Total Solid (TS) and Mineral Solid (MS) were quantified gravimetrically using a 0.1 mg Ohaus Pioneer balance, TS: evaporation to dry until constant weight, MS: calcination at 500 oC, cooled at desiccator and weighted to constant weight).
Water samples were collected in 250 mL sterilized glass bottles, kept at 4 oC and analyzed within 48 hours. Quantification of the number of total coliform bacteria present in the water samples was determined by the Most Probable Number (NMP) technique, using a series of 3 tubes and incubation at 37 °C for 48 hours (APHA, 2005). The detection of mold and yeast cells was carried out by culture technique in depth, using Potato Dextrose agar and incubation at 25 °C for 7 days (APHA, 2005). For coliform bacteria, results were expressed in probabilistic values of NMP/100 mL, obtained for a series of 3 tubes in the corresponding probabilistic tables (APHA, 2005). The presence of mold and yeast cells was verified macroscopically once the incubation was completed and the colony obtained at the genus level was identified by microscopic observations after coloring the samples with lactophenol blue (Pitt and Hocking, 1997).
Figure 2 shows temporal and spatial variations of temperature at the center and right edge of the river. Temperature and temporal variability increase as the river flows through the city. Thermal difference between PT and LM sampling points was 3.8 ± 0.9 oC at the center river and 3.6 ± 0.9 oC for the right edge. Temporary thermal variability at PT sampling point was low, 0.69 and 1.2 % at the center and right edge respectively, but at LM sampling point, thermal variability increased up to 4.5 % at both sides of the river.
Figure 2
Spatial and temporary variations of water
temperature at center and right edge of the river
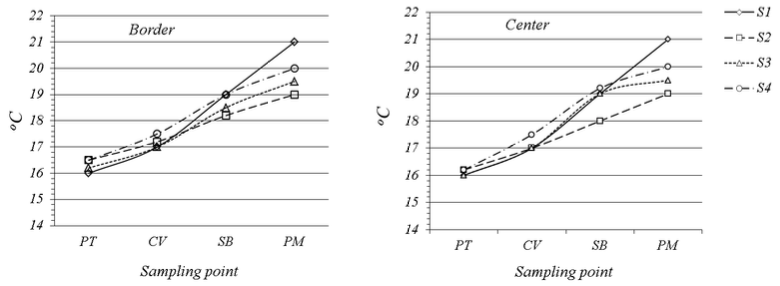
According to these results, it seems that there is a thermal effect, and water temperature rises is not only due to altitude thermal gradient (altitude: PT 1,700 m and LM 1,500 m and 6 km between them) but to the sewage discharges. Taken the Chama River as reference, water thermal variation is approximately 3.2 oC between two points located at an altitude difference of 2,000 m and 50 km apart.
Figure 3 shows the temporal and spatial variation of water conductivity at the center and right edge of the river. Temporal variations were reproducible for both sampled sides of the river, but spatial variations were significant. At the first sampling point, conductivity was mainly due to dissolved ionic constituent, cations and anions commonly found in fresh waters. However, along the first segment PT – CV, water conductivity decreased approximately 35 dS m-1 compared to the first PT sampling point in both sides of the river and so did temporary variability, from 11.9 % to 2.8 % at the center of the river and from 9.9 % to 4.80 % at the right border. These results, together with the fact that the CV sampling point was a permanent white water discharge place, show that wastewater could be mostly nondisociated or nonionic organic pollutants.
Figure 3
Spatial and temporary variations of water’s electric
conductivity at the center and right edge of the river
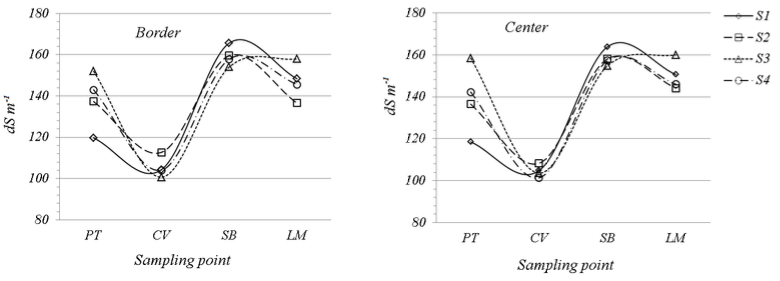
Along the second segment of the river, SB sampling point, water conductivity increased significantly, approximately 54 dS m-1 for both sides of the river compared to the previous sampling point, CV. This could be associated with the dissociation of pollutants received at CV sampling point. The final positive balance between extreme sampling points was 11.2 and 9.1 dS m-1 at the center and edge, respectively, and a temporary variability of 5 % measured at LM sampling point.
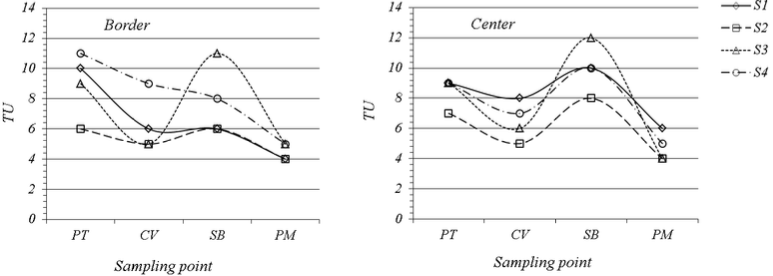
Water turbidity was produced by suspended organic or inorganic matter of variable size. Most of these particles serve as micro capsules that hold microorganisms and protect them from thermal and disinfection treatments. International Normative for potable water sets acceptable levels of turbidity between 1 and 5 NTU. Figure 4 shows values between 4 up to 12 NUT and spatial and temporal variations range between 10 and 30 %, being higher at the right edge of the river.
Variations in turbidity are different at the edge and at the center of the river where turbulence is greater. Water at the edge of the river did not move as much and sedimentation occurs. Nevertheless, on the third week of sampling, along the second segment (CV – SB) an important turbidity peak value (12 NTU) was reported for both sides of the river. These results agreed with those reported by Burguera et al., in 1984, where turbidity values ranging between 12 – 15 NTU were reported at the same sampling point, whereas other turbidity values along the river ranged between 2 and 6 NTU, meaning that since eighties water turbidity values had increased.
Figure 4
Spatial and temporary variations of water
turbidity at the river center and right edge.
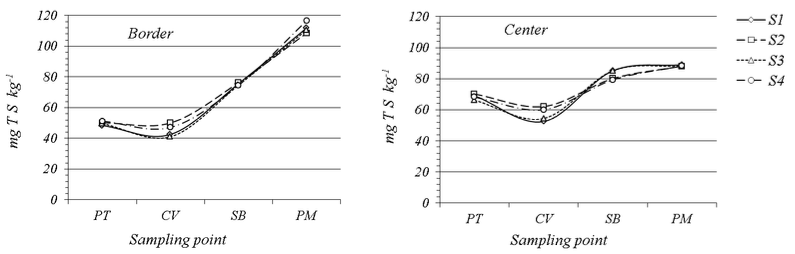
3.1.4. Total, mineral and organic solids
Figures 5, 6 and 7 show temporal and spatial variations of total, organic and mineral solids in the water at the center and right edge of the river. Temporary variations were also low and reproducible in this case. Total solids were below 4 % for temporary variations between the center and the edge of the river. As the river flows down through the city, the amount of total solids increased, especially at the edge where they accumulated.
At LM sampling point, TS were determined obtaining a value of 62.07 ± 3.60 mg kg-1, which represents an increment of 124 % in comparison to values at PT sampling point, whereas in the center of the river, TS level were 19.97 ± 1.95 mg kg-1, representing an increase of 29.20 % compared to the first sampling point, PT. Characterizing these TS at LM, it was found that at the edge of the river 15.35 % of the solids were organic matter and 85.87 % mineral solids, this pattern was also found at the center of the river mineral solids represented 86.77 % of TS and only 13.40 % were organic solids.
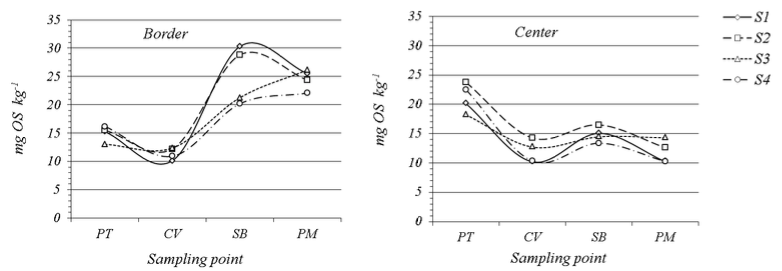
At the center of the river, temporary variations were greater, between 7 and 17 %, organic solids diminished along the river. A 44 % decrease in organic solids (OS) was observed when compared to PT sampling point. This could be explained due to dilution caused by an increasing water flow as the river passes through the city. On the other hand, these organic solids accumulated at the edge of the river. This was observed by an increment of 9.53 ± 2.26 mg OS kg-1 downstream, which represents a 64 % increase compared to what was determined at the first sampling point (PT).
Figure 5
Spatial and temporary variations of water total
solids at the center and right edge of the river
-----
Figure 6
Spatial and temporary variations of water organic
solids at the center and right edge of the river
-----
Figure 7
Spatial and temporary variations of water mineral solids at the center and right edge of the river
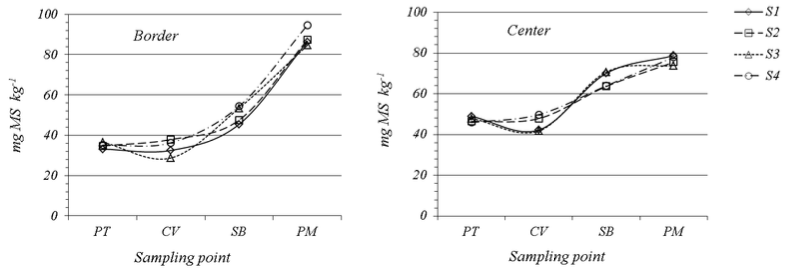
Temporary variation of the mineral solids were below 10 %. There was an increase of 29.23 ± 2.63 mg MS kg-1 at the center of the river and 53.30 ± 4.59 mg MS kg-1 at the edge, which represent an increase of 62 and 152 % respectively.
Figure 8 shows spatial and temporary variations of water’s pH at the center and right edge of the river. They ranged between 10 and 20 % and a significant increase of 0.31 and 0.35 pH units was observed between the first (PT) and last (LM) samples for both the center and edge of the river, respectively. (Coupled data test for a = 0.05 and FD = 3). The increase on pH values could be caused by the presence of carbonates coming from urban sewage or by dissolution of calcareous minerals from the soil in contact with water.
Figure 8
Spatial and temporary variations of water’s pH
at the center and right edge of the river
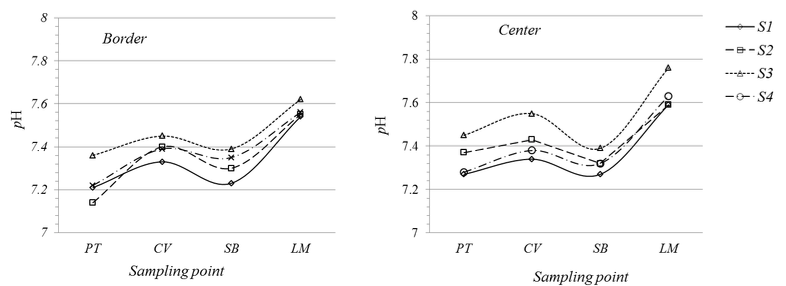
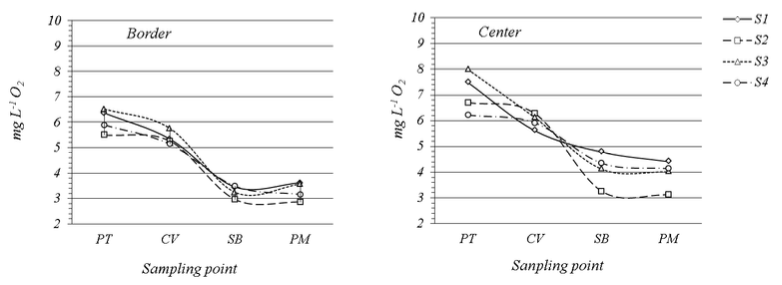
Figure 9 shows spatial and temporary variations of dissolved oxygen at the center and right edge of the river. Dissolved oxygen level should be around 9 to 10 ppm when pollutants and chlorine are absent, according to measured temperatures. Burguera et al., (1986) reported levels of dissolved oxygen along the river ranging from 9 to 10 mg L -1 with the exception of SB sampling point, where it was 8 mg L-1.
At this study, dissolved oxygen level at the first sampling point was below 7 ppm, exactly 6.07 ± 0.46 mg L-1 at the right edge and 7.10 ± 0.79 mg L-1 for the center of the river. Along the river, dissolved oxygen levels diminished, only reaching 3.28 ± 0.24 mg L-1 and 4.13 ± 0.64 mg L-1 at the edge and center of the Albarregas river, respectively, in the last sampling point, LM. This means that since the eighties dissolved oxygen levels in the water had diminished by approximately 5 mg L-1. It was difficult to find aquatic life with current levels of dissolved oxygen, being the trout an example which needs a minimum of 8 ppm of dissolved oxygen for survival.
Figure 9
Spatial and temporary variations of dissolved
oxygen at the center and right edge of the river
Temporary variations of dissolved oxygen ranged from 10 to 15 % for the center of the river while at the edge, these variations range between 7 and 10 %. It is believed that variations at the center of the river are greater to water turbulence. At the edges of the river turbulence decreases significantly, therefore, dissolved oxygen variations were less important.
Table 1 shows BOD5d values for the chosen samples. Although BOD5d values comply to official normative at the first three sampling points, growing pollution conditions as the river flows through the city cause for the last sampling point BOD5d values to be out of official normative (60 mg L-1). BOD5d and DO values show the negative effects of urban sewage discharges to the river.
Table 1
DBO5d (mg L-1) values at the center
of the river for sampling acts 4 and 6.
|
PT |
CV |
SB |
LM |
blanc |
S4 |
39.01 |
38.61 |
41.92 |
69.42 |
11.82 |
S6 |
39.35 |
41.73 |
47.28 |
64.97 |
11.90 |
Figure 10 show spatial and temporary variations of dissolved hydrogen sulfide at the center and right edge of the river. Sulfide ions were formed by sulfate ions reduction in an aquatic media without enough dissolved oxygen, equilibrium was established with hydrogen ions to form hydrogen sulfide, causing great “rotten eggs” odor problem. At current pH values at the river, equilibrium was displaced to the non-dissociated H2S form, which does not contribute to the water acidity but it was responsible for water bad odors (Sawyer et al., 2001).
Results showed growing quantities of H2S along the river, especially at the edge of the river. At the LM sampling point, increased levels of H2S were found at 17.38 ± 1.14 mg L-1 at the edge of the river, while for the center of the river it was an increase of 7.99 ± 2.00 mg L-1. Temporary variations were low; at the first sampling point were 1.94 % and 3.4 % for the edge and center of the river, respectively. For the last sampling point were 0.73 % and 1.75 % respectively.
Figure 10
Spatial and temporary variations of dissolved hydrogen
sulfide at the center and right edge of the river
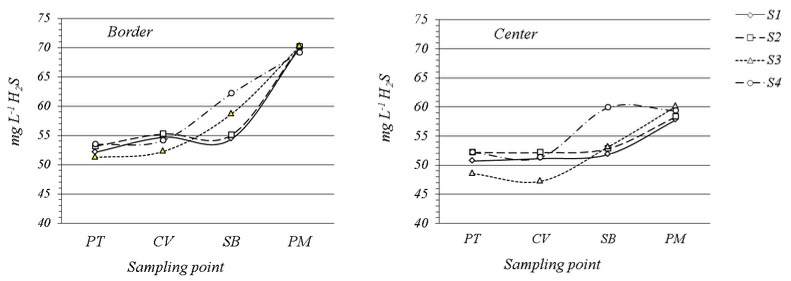
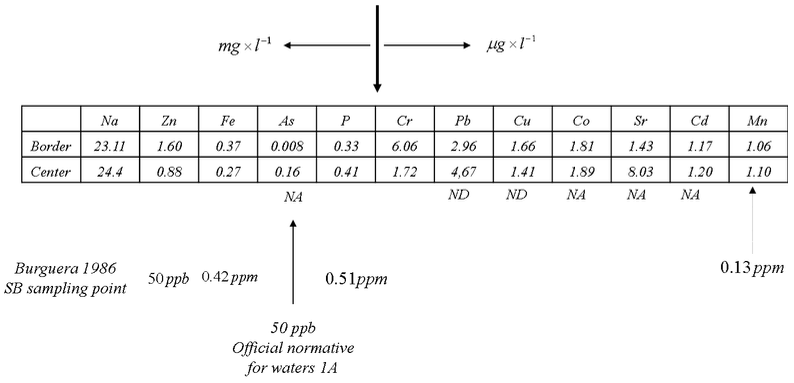
Figure 11 shows water metallic profile at LM sampling point during 6th sampling act at the center and right edge of the river. Left side of the Table shows metallic elements in ppm and the right side shows metallic elements at trace levels. Some of them presented differential concentration levels at the center and the right edge of the river. Strontium, phosphor, arsenic and lead were in higher concentrations at the center of the river. All others analyzed metallic elements were somewhat equally distributed between the center and the edge of the river.
Figure 11
Water metallic profile at LM sampling point
(ND: not detected; NA: not analyzed)
Figure 11 also shows comparatively metallic elements that were analyzed by Burguera et al in 1986 and their concentration for CV sampling point where they found the greatest concentration of certain metallic species at that moment, lead and copper were not detected (ND) and arsenic strontium and cadmium were not analyzed (NA). In the present study, concentrations of those metals remained low; nevertheless, there is no official normative about metallic concentrations for water type 4C or type 7. However, for official normative about water types 1A, 1B and 1C, only arsenic was out of permitted range. In fact, as was found at the center of the river with a concentration 16 times higher than the official normative. (Decree 883, 1995).
After a three-week-incubation time, a qualitative observation and identification of several microorganisms was made. Tables 2 and 3 shows the results of these observations and identification of microorganisms present in samples from both the edge and center of the river. The average value obtained in the quantification of total coliforms for each of the evaluated sampling point was ≥ 1100 NMP/100 mL. In the case of the study of mold and yeast, it was possible to isolate and identify in all the sampling points colonies of mold belonging to the Aspergillus and Curvularia genera. In the same way, it was possible to isolate colonies of Candida yeast in all of the sampling cases. All these are pernicious contaminants, potentially dangerous for health. Either alone or associated with other organisms, they may cause skin damage and could affect digestive and respiratory systems in humans and animals. Curvularia and Aspergillus are cellulite decomposers. Burguera et al., (1980), reported levels ranging between 103 NMP/100 mL and 105 NMP/100 mL for total coliform in some places along the river, and proved that the affluent of Albarregas river were the mayor contributors to such contamination in the river. It is well known, that the water of the Albarregas River and its effluents has not received any sort of treatment by governmental organisms in many years, meaning that current results of ≥ 1100 NMP/100 mL for total coliform seem to agree with the reality of the situation. This kind of contamination has continuously increased in time due to the growing population.
Table 2
Incubation timeline of samples taken at the edge of the river
|
Week 1 |
Week 2 |
Week 3 |
PT |
Bacteria growing Presence of Fungi |
Moderated bacteria growing
|
Presence of curvularia |
CV |
Presence of bacteria and fungi |
Growing of Aspergillus fungi |
Bacteria growing Presence of Candida |
SB |
Bacteria and fungigrowing |
Moderated bacteria and fungi growing |
Presence of Drosophyla (flies) |
LM |
Bacteriacoloniesdevelopment |
99 % bacteriagrowing |
Presenceof Candida |
-----
Table 3
Incubation timeline of samples taken at the center of the river
|
Week 1 |
Week 2 |
Week 3 |
PT |
Presence of bacteria |
Colonies development |
Presence of Candida and Diatomeas |
CV |
Coloniesdevelopment |
90 % bacteria growing |
Bacteria growing Presence of Candidiasis |
SB |
Moderated presence of bacteria and fungi |
Moderated bacteria growing |
Massivepresence of penicillium |
LM |
Coloniesdevelopment Presenceofbacteria |
99 % bactéria growing, Presenceoffungi |
Massive presencia de Candida |
According to the Venezuelan Official Normative for Water Classification and its uses, the water of the Albarregas River should be classified as water type 4C, for entertainment and aquatic sports. This study have shown that the quality of the water of the Albarregas river is rather poor due to constant urban sewage discharges. The quality diminishes as the river flows through the city, especially at the edges where there is accumulation of the mayor part of pollutants.
The principal indicator of progressive pollution is the diminished dissolved oxygen in the water. In the last 25 years, levels of dissolved oxygen have dropped by 5 mg O2 L-1 in the most critical zone of the river, meaning an average of 0.15 mg O2 L-1 drop every year. Increasing quantities of H2S along the river, especially at the edges are produced by accumulation of organic solids. High turbidity values and low dissolved oxygen concentrations produce favorable conditions for fungi and bacteria growth, as well as, for organic matter decomposition which releases methane and hydrogen sulfide that are responsible for water odor problems.
Although official normative for water types 4 and 7 management does not include limits for heavy metal content, attention should be paid to these kind of pollutants, especially considering the high concentrations that were found. These metal species are somewhat equally distributed at the center and the edge of the river. However, arsenic is more concentrated in the center of the river, being 16 times higher than the limit set by the Venezuelan Official Normative for water type 1A and 1B.
It was proved by these results that residential, commercial and semi industrial activities near and along the Albarregas River are the mayor contributors to the its pollution through more than 40 direct and indirect waste discharges to the river. This situation has been concerning people owing to an environmental problem that is getting worst in time. There seems to be no hope, at least in the near future, for the river and for the Metropolitan Park of Merida City.
These results should strongly encourage other scientists and official organisms to take action on this problem. The recommended solution to this problem had been proposed several times, a derivation of urban discharges to a treatment plant and reactivation of Albarregas Metropolitan Park project which has been paralyzed for a very long time.
American Public Health Association (APHA). Standard methods for the examination of water and wastewater 21th ed. American Public Health Association. Washington. USA. (2005).
Amundarain, S., D´agostini, C., D´alessio, A., Espejo, J., Oliveros, D. Páez, D. (1985). Evaluación preliminar del grado de polución del río Albarregas. Universidad de Los Andes, Facultad de Ingeniería, Mérida.
Ballester, L. (1980). Investigación de indicadores fecales y de salmonella en aguas del río Albarregas de la ciudad de Mérida. Facultad de Farmacia, Universidad de Los Andes, Mérida.
Burguera, J.L; Burguera, M; Rivas, C. y Wilhelm, L. (1986). Estudio sobre la contaminación del río Albarregas. Acta Científica Venezolana, Nr. 37, 657 – 666.
Centro de Cooperación para el Desarrollo, Universidad Politécnica de Cataluña y Alcaldía Municipio Libertador, Mérida, Venezuela, (CCD-UPC/rediALA), (2005). Jornada de Estudio Previo, Plan Especial Parque Metropolitano Albarregas. www.rediala.org/ambito albarregas_completo A4 141.pdf
Crosson, M y Giba, R., (1992). Microscale Experiments: Disolved Oxygen and Chloride determination in water. J. of Chem. Educ. vol. 69, Nr. 10, p 830 – 832.
Decreto de Ley Nr. 883 (1995). Gaceta Oficial 5021. Normas para la Clasificación y el Control de la Calidad de los Cuerpos de Agua y Vertidos o Efluentes Líquidos.
Durant, P. et al. (1995). Mesofauna dulceacuícola como indicadora de calidad de agua en el río Albarregas, Mérida. III Congreso Latinoamericano de Ecología, Mérida.
Fontana, L., Burguera, J.L., Burguera, M. y Burguera, J.A., "Estudio sobre la Contaminación del Río Albarregas. II. Contaminación Bacteriológica". XXXV CONVENCION DE AsoVAC, 17-22 de noviembre (1985), Universidad de Los Andes, Mérida, Abstract p. 128.
Mayorga, O., Ramírez, M., Mayorga, J. (2017). Nota técnica: Índice de calidad de agua de los ríos Albarregas y Milla del Estado Mérida, Venezuela. Revista Ingeniería UC, Vol. 24, No. 3.p .428 – 432.
Moreno, H. (1980). Grado de contaminación de las aguas del Río Albarregas. Tesis MsC, Facultad de Ingeniería Forestal, Universidad de Los Andes, Mérida.
Pitt, J.L.; Hocking, A.D. (1997). Fungi and food spoilage. Ed. Blackie Academic and Professional. London. UK.
Rivas, A. y Ramoni, J. (2007). Valoración contingente aplicada al caso del Río Albarregas, Mérida – Venezuela. Rev. Vzlana de Soc. y Ant. Vol. 17 (49), 478 – 502.
Rivas, C., Burguera, J.L., Burguera, M., Oropeza, J. y Fontana, L., "Estudio sobre la Contaminación del Río Albarregas. I. Contaminación Físico-Química". XXXV CONVENCION DE AsoVAC, 17-22 de noviembre (1985), Universidad de Los Andes, Mérida, Abstract p. 128.
Rivas, Z; Márquez, R; Troncote, F; Sánchez, J; Colina, M y Hernández, P. (2005). Contribución de los principales ríos tributarios a la contaminación y eutrofización del Lago de Maracaibo. CIENS. vol. 13, Nr 1.
Sawyer, C. N; McCarty, P.L. y Parkin, G.F. (2001). Química para Ingeniería Ambiental, 4ta ed. McGraw Hill, México. p 639.
ULA – PAMALBA, (2009). Proyecto LOCTI LC – 11 – 07 – 01: Investigación y formulación de propuestas para gestionar e integrar ejes estructurantes ambientales en el desarrollo urbano de ciudades alto andinas. Caso Parque Metropolitano Albarregas, ciudad de Mérida. Centro Interamericano de Desarrollo e Investigación Ambiental y Territorial., CIDIAT, Universidad de Los Andes, Mérida, Venezuela.
Vivas, M. (2000). Análisis de la calidad del agua que circundan a la ciudad de Mérida. Centro Interamericano de Desarrollo e Investigación Ambiental y Territorial., CIDIAT, Universidad de Los Andes. Mérida.
1. Universidad Nacional de Chimborazo (UNACH), Facultad de Ingeniería, Vicerrectorado de Postgrado, Vinculación e Investigación. Universidad de Los Andes (ULA), Facultad de Ingeniería, Escuela de Ingeniería Química. pratoj@gmail.com
2. Queensborough Community College (CUNY), Chemistry Department, Bayside, New York, USA.
3. Universidad Nacional de Chimborazo (UNACH), Facultad de Ciencias de la Salud, Laboratorio Clínico e Histopatológico
4. Universidad Nacional de Chimborazo (UNACH), Facultad de Ciencias de la Salud, Carrear de Laboratorio Clínico e Histopatológico. Universidad de Los Andes, Facultad de Farmacia y Bioanálisis, Departamento de Microbiología y Parasitología
5. Universidad de Los Andes (ULA), Facultad de Farmacia y Bioanálisis, Postgrado de Química de Medicamentos
6. Universidad Nacional de Chimborazo, Facultad de Ciencias de la Salud, Carrera de Medicina
7. Departamento de Ingeniería Química y Bioprocesos. Pontificia Universidad Católica de Chile. Santiago, Chile