![]() ISSN 0798 1015
ISSN 0798 1015

![]() ISSN 0798 1015
ISSN 0798 1015
Vol. 40 (Number 14) Year 2019. Page 27
KUVAEVA, Yulia V. 1; PISHCHULOV, Victor M. 2 & SEREBRENNIKOVA, Anna I. 3
Received: 05/02/2019 • Approved: 11/04/2019 • Published 29/04/2019
2. Specificity of the indicator ‘MONEY SUPPLY/ GRP’ as an indicator of financial depth
ABSTRACT: Considerable debate over the part of the financial system in development of national economies has been discussed in the economic literature during recent years. This article focuses on possible dependence of development of local authorities within the country on financial depth of a region concerned. The data obtained in the analysis reveal the main trend of the system ‘money supply/ gross regional product (hereinafter referred to as ‘GRP’) and ‘region's economic development’. Some assumptions about reasons of this trend were made. |
RESUMEN: En los últimos años se ha discutido un considerable debate sobre la parte del sistema financiero en el desarrollo de las economías nacionales en la literatura económica. Este artículo se centra en la posible dependencia del desarrollo de las autoridades locales dentro del país con respecto a la profundidad financiera de la región en cuestión. Los datos obtenidos en el análisis revelan la tendencia principal del sistema "oferta de dinero / producto regional bruto (en adelante," PRF ") y" desarrollo económico de la región ". Se hicieron algunas suposiciones sobre los motivos de esta tendencia. |

The idea of positive influence of financial sector on economic growth was revealed and described in detail for the first time by Joseph Schumpeter at the beginning of the 20 century. He explained that banks as financial intermediaries perform some functions, for example, saving of economic agents, estimating the profitability of the investment project, risk monitoring, which are important for economic development. This idea was tested in some works and the conclusions of them confirmed a positive correlation between indicators of financial system and long-term rate of economic growth, according to data from some countries.
According to research carried out by the World Bank, attempts were made to prove the linear positive dependence of economic development on ‘financial depth’ in 1980. Financial depth is commonly understood as the number of financial relations in economy, amount of money, financial instruments and institutions, indicator of finance (formation, investment) in comparison with production volumes.
The empirical evidence of the non-linear influence of the financial development on economic growth were made during the period from 2012 to 2015. Researches agreed that increase in financial depth not necessarily lead to accelerate economic growth. The development of the financial market contributes to economic growth which increases investment in economy, solves the problem with information asymmetry and allows economic agents to diversify sources of funding. However, the development of financial sector becomes excessive because of the threshold in terms of increase in the number of risks. These risks lead to decrease in stability and economic growth, increase in volatility of economic growth. It is a very topical issue for countries where regulation and monitoring of the financial market are undeveloped. For example, according to various studies, the threshold of the ratio of the private sector credit to gross domestic product (hereinafter referred to as ‘GDP’) is the range from 80 to 100 %. After this threshold is reached, the negative macroeconomic effects are realized. In individual economists’ opinion, increase in financial sector is only as a form of ‘by-product’ of overall economic development and it explains the link between them.
As far as Russia is concerned, the observations of the financial development in comparison with more than 115 countries have been carried out almost 20 years. Author’s Ono (2012) verifies a hypothesis of the linear link between development of financial sector and economic growth studying data from Russia. The results of the study show that increase in money supply stimulates economic growth and the latter one in turn creates conditions for development of banking credit. The author explains that this conclusion is based on the indicators of Russian economy. Positive oil price shock causes the strengthening of the ruble. The latter one increases in GDP per capita under the lack of financial instruments of reduction in money supply.
The main indicator of financial depth is the monetization ratio which is a ratio of GDP to a measure of the money supply. Taking into account the discussion on influence of financial depth on economic development, it is worth noting that different countries have the different monetization and there is the obvious truth which should be recognized. For example, this situation was among the former East-European countries of the Soviet Union and the countries in the post-Soviet area, whose economies was similar to the Russian one during the period from 1999 to 1994. But at the same time the issue of the unequal distribution of money supply among the countries with a federal structure and influence of the monetization as an indicator of financial depth on economic development was not sufficiently explored to date.
There are rather small territories where notionally closed cash flows to occur. It means that a part of cash flows does not go beyond these territories. Therefore, the certain money supply is required in these territorial entities for the formation of closed cash flows mentioned above.
Let us consider rather large territories, according to the administrative division as it provided in the Constitution of the Russian Federation, in order to analyze of the link between the monetization ratio and economic development in Russia. They are the territories within the borders of the constituent entities set by law (85 entities). The practical value of the choice of such constituent entities is that there are the statistics sufficient to this research.
Most researches support the idea that the modification at the macroeconomic level is based on the indicator (in the numerator) of so-called broad money in national currency, according to the indicator ‘money supply/GDP. This indicator much fully characterizes such components of money supply as cash and pay on account and is calculated with a unified methodology in the programme of the International Financial Statistics (IMF) by central banks of most countries. In that case, M2 (a key indicator) is used as this indicator in macroeconomics in Russia.
The aim of this research is to study influence of the monetization of closed territories on their economic development. That is why there is a problem that the statistics of the Central Bank of Russia do not offer the indicators of money supply. With this in mind, we tried to find an alternative to M2 for regions. The most difficult problem is to determine such component of money supply as cash (the share of cash in M2 in Russia ranged in the vicinity of 20 % in 2017).
However, there is the statistical information concerning the balance in the accounts by entity. In addition, statistics take into account the indicator ‘The budget of organizations, bank deposits (funds) and other funds attracted from individuals and entities’ which amounted to 34120,9 billion rubles as at 1st January 2017. The official figures reflect that M2 amounted to 38418,0 billion rubles. A part of the non-cash equaled to 30703,2 billion rubles and cash reached 7 714,8 billion rubles. Thus, this indicator can be considered as a sample which covers almost all the non-cash part of M2.
We've got to proceed under the assumption that cash part of M2is about20% by considering the statistics on the structure of M2 in 2017. The monetary condition in the country's entities (regions) is implemented as a credit from the banking system to businesses. The Central Bank of Russia offers data on the amounts of credit provided to legal entities and private entrepreneurs across regions. It is important to note that the indicators of the volume of credit provided to businesses across regions are well correlated with the outlined previously one ‘The budget of organizations, bank deposits (funds) and other funds attracted from individuals and entities’ in the same regions. A positive ratio of correlation of these two indicators is extremely high for the regions and is approaching to the functional dependence accounting for 0,99.
Thus, it is permissible to use the selected indicator ‘The budget of organizations, bank deposits (funds) and other funds attracted from individuals and entities’ to measure money supply in the country’s regions with a view to further calculation of the monetization ratio as one of the indicators of financial depth of the region.
The distribution of money supply by Russian entity can be provided after ranking of numerical and percentage values of its distribution across the country (the table 1).
The sample of 10 regions with the highest and lowest amounts of the indicator ‘The budget of organizations, bank deposits (funds) and other funds attracted from individuals and entities’, which, in our opinion, are the most informative in order to further analysis, is explained in this study.
The fact that maximum share of this indicator of money supply (14816,2 billion rubles) in Moscow (43,4%) to be expected because this entity has economically featured prominently among other territories. Even this indicator of St. Petersburg differs almost six times from the capital (2536,8 billion rubles) and its share of total money supply is 7,4%.And the last ones are the Republic of Altai with its indicator (0,025%),the Republic of Tuva (0,028%) and the Republic of Ingushetia (0,023%).
It is clear that the entities in Russia are in the different socio-economic conditions. And the most significant of them should be taken into account in this study. First of all, any territory has certain resources, the most important of which is the population. Let us consider the distribution of this indicator of money supply ‘The budget of organizations, bank deposits (funds) and other funds attracted from individuals and entities’ per inhabitant of the corresponding entity in that regard (the table 1).
Table 1
The distribution of the budget of organizations, bank deposits (funds) and other funds
attracted from individuals and entities as at 1 January 2017 by entity in Russia.
Region |
The budget of organizations, bank deposits (funds) and other funds attracted from individuals and entities as at 1 January 2017, mln.,rubles
|
Share of the budget of organizations, bank deposits (funds) and other funds attracted from individuals and entities as at 1 January 2017, % |
Population of the entity in Russia, |
The budget of organizations, bank deposits (funds) and other funds attracted from individuals and entities per inhabitant of the corresponding entity as at 1 January 2017 thsd, rubles / pers. |
Moscow |
14 816 203 |
43,243 |
12 380,7 |
1196,7 |
St. Petersburg |
2 536 766 |
7,434 |
5 281,6 |
480,3 |
Moscow Region |
1 394 450 |
4,087 |
7 423,5 |
264,0 |
Tyumen Region |
925 057 |
2,711 |
3 660,0 |
252,7 |
Republic of Tatarstan |
848 824 |
2,488 |
3 885,3 |
218,5 |
Sverdlovsk Region |
788 088 |
2,300 |
4 329,3 |
182,0 |
Krasnodar Territory |
734 754 |
2,100 |
5 570, 9 |
131,9 |
Samara Region |
576 009 |
1,700 |
3 203,7 |
179,8 |
Nizhny Novgorod Region |
539 979 |
4,500 |
3 247,7 |
166,3 |
Rostov Region |
517 405 |
1,500 |
4 231,4 |
122,3 |
etc. |
||||
Chechen Republic |
25 588 |
0,070 |
1 414,9 |
18,0 |
Republic of Adygeya |
21 951 |
0,060 |
453,4 |
48,4 |
Karachayevo-Circassian Republic |
18 230 |
0,050 |
466,4 |
39,1 |
Chukotka Autonomous Area |
13 248 |
0,030 |
49, 8 |
266,0 |
Jewish Autonomous Region |
12 210 |
0,030 |
164,2 |
74,4 |
Republic of Kalmykia |
9 750 |
0,026 |
277,0 |
35,2 |
Republic of Tuva |
9 626 |
0,028 |
318,6 |
30,2 |
Altai Territory |
8 740 |
0,026 |
217, 0 |
40,2 |
Nenets Autonomous Area |
8 654 |
0,025 |
43, 9 |
197,1 |
Republic of Ingushetia |
7 872 |
0,023 |
480,5 |
16,4 |
Russian Federation |
34 120 946 |
100,000 |
146 804,4 |
232,42 |
Some paradoxical conclusions have been made after the range of territories, according to the indicator ‘The budget of organizations, bank deposits (funds) and other funds attracted from individuals and entities’ per inhabitant of the corresponding entity as at 1 January 2017. The main entity of the Russian Federation is still Moscow with 1196,7 thsd. rubles per person, even though the average of this indicator in Russia is 232,4 thsd.rubles./pers. (the excess is more than 5 times). St. Petersburg lags behind Moscow two and a half times, according this indicator (480,3 thsd. rubles./pers.). The relatively industrially developed regions comprise the group with the highest money supply per inhabitant (the Moscow Region, Tyumen Region, Republic of Tatarstan, and Sverdlovsk Region). However, the indicator turned out to be surprisingly high (among developed regions) for historically assisted regions such as Chukotka and the Nenets Autonomous Areas.
The indicator related to the indicator ‘money supply/GDP’ for national economies is necessary to the quantitative feature of financial depth by entity. The ratio of the indicator ‘The budget of organizations, bank deposits (funds) and other funds attracted from individuals and entities’ in the regions to GRP is used in this research.
The indicator of financial depth of the region (the monetization ratio) differs among the regions (the table 2), driving the unevenness of financial depth of regional economies. Moscow is in the first place, as usual, according to this indicator (104%). Moreover, this indicator is twice as high, on average for the country.
The amount of money supply per inhabitant in Moscow is five times higher than an average for the country. That is why the difference is not significant, according to the monetization ratio. If we calculate GRP per inhabitant for the territory (the table 2) and compare with the indicator ‘The budget of organizations, bank deposits (funds) and other funds attracted from individuals and entities’ (the table 1), it appears that there is the different use of money supply during creation of GRP. So in other words, money ‘works’ more effectively during creation of GRP in the regions where an amount of money is less than, for example, in Moscow where there is the relative abundance.
Table 2
The ranking of the regions in Russia according
to the monetization rate as at 1 January 2017
Region |
The budget of organizations, bank deposits (funds) and other funds attracted from individuals and entities as at 1 January 2017, mln.,rubles |
Share of the budget of organizations, bank deposits (funds) and other funds attracted from individuals and entities as at 1 January 2017, % |
Population of the entity in Russia, |
The budget of organizations, bank deposits (funds) and other funds attracted from individuals and entities per inhabitant of the corresponding entity as at 1 January 2017 thsd, rubles / pers. |
Moscow |
14 816 203 |
43,243 |
12 380,7 |
1196,7 |
St. Petersburg |
2 536 766 |
7,434 |
5 281,6 |
480,3 |
Moscow Region |
1 394 450 |
4,087 |
7 423,5 |
264,0 |
Tyumen Region |
925 057 |
2,711 |
3 660,0 |
252,7 |
Republic of Tatarstan |
848 824 |
2,488 |
3 885,3 |
218,5 |
Sverdlovsk Region |
788 088 |
2,300 |
4 329,3 |
182,0 |
Krasnodar Territory |
734 754 |
2,100 |
5 570, 9 |
131,9 |
Samara Region |
576 009 |
1,700 |
3 203,7 |
179,8 |
Nizhny Novgorod Region |
539 979 |
4,500 |
3 247,7 |
166,3 |
Rostov Region |
517 405 |
1,500 |
4 231,4 |
122,3 |
etc. |
||||
Chechen Republic |
25 588 |
0,070 |
1 414,9 |
18,0 |
Republic of Adygeya |
21 951 |
0,060 |
453,4 |
48,4 |
Karachayevo-Circassian Republic |
18 230 |
0,050 |
466,4 |
39,1 |
Chukotka Autonomous Area |
13 248 |
0,030 |
49, 8 |
266,0 |
Jewish Autonomous Region |
12 210 |
0,030 |
164,2 |
74,4 |
Republic of Kalmykia |
9 750 |
0,026 |
277,0 |
35,2 |
Republic of Tuva |
9 626 |
0,028 |
318,6 |
30,2 |
Altai Territory |
8 740 |
0,026 |
217, 0 |
40,2 |
Nenets Autonomous Area |
8 654 |
0,025 |
43, 9 |
197,1 |
Republic of Ingushetia |
7 872 |
0,023 |
480,5 |
16,4 |
Russian Federation |
34 120 946 |
100,000 |
146 804,4 |
232,42 |
The final group of the distribution, according the indicator of region monetization, includes the entities of Russia as territories, originally, with the lowest indicator ‘The budget of organizations, bank deposits (funds) and other funds attracted from individuals and entities’ among 85 entities in Russia. However, there is the Tyumen Region in this group where GRP ranks second after Moscow in Russia. It proves the thesis that less money ‘works’ more effectively in the regions.
Figure 1
The range of the regions in Russia according to the monetization ratio as at 1 January 2017.
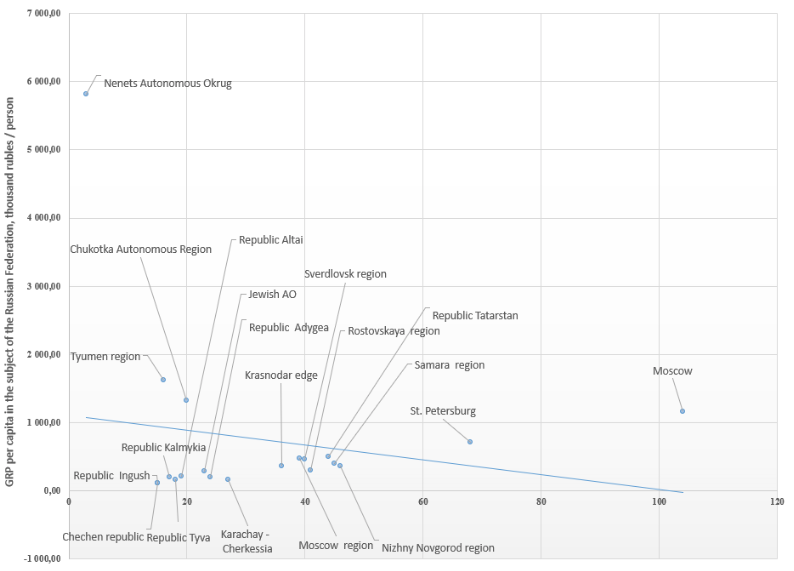
The analysis of the link between the monetization ratio of the corresponding region in Russia and economic development per inhabitant in the relevant region to be undertaken in the final stage of the study (figure 1).
To summarize, the indicator of determination was calculated in the process of identifying of the link of two rows of the indicators. The indicator of determination indicates how the monetization ratio in Russia influences on GRP per inhabitant of the sample. The specified indicator for 20 regions of this sample is 0,0381, reflecting little impact of the corresponding factor on the indicator. Eventually the indicator of determination also indicates the necessity of analysis of other indicators which illustrate financial depth of the territorial entities within the State with the federal system.
The calculation of the monetization both in Russia and certain regions shows that financial depth in accordance with the indicator of the monetization ratio is no more than 50 %, except for Moscow and St. Petersburg. But this indicator is much higher in the advanced economies, for example, it is more than 200% in Honk Kong and Japan, more than 150-200% in Great Britain and Switzerland, more than 100-150 in Australia, Korea, New Zealand, Singapore and more than 80-100% in the Eurozone, Iceland, Canada, USA and the Czech Republic.
Arcand, J. L., Berkes E., Panizza U. (2012). Too Much Finance? Journal of Economic Growth 20(2), pp. 105–148.
Cecchetti, G., Kharroubi, E. (2012). Reassessing the Impact of Finance on Growth. BIS Working Papers No. 381, Bank for International Settlements.
Gaidar, E. (1998). Tactics of reforms and the level of state pressure on the budget. Voprosy Ekonomiki,. No 4, pp. 4-13.
Goldsmith, R. W. (1969). Financial structure and development. New Haven: Yale University Press, pp. 10-14
Law, S. H., & Singh, N. (2014). Does too much finance harm economic growth? Journal of Banking and Finance, No 41, pp. 36–44.
McKinnon, R. I. (1973). Money and capital in economic development. Washington, D. C.: Brooking Institution.
Malkina, M.Yu. (2010). On the issue of indicators of the sufficiency of money supply and the quality of money in the economy. Management Issues, 1 (10), pp. 102-115.
Manevich, V.E. (2005). Money supply in the Russian economy. Business and banks, No 41. pp. 2-14.
Mirkin, I. (2011). The financial future of Russia: extremes, booms, systemic risks. GELEOS Publishing House; Capital Trade Company, pp. 122-144.
Mirkin, Ya. (2015) Economic - static study of the financial depth of the economy. Vestnik NSUA, No 4, pp. 24-29.
Ono, S. (2012). Financial Development and Growth: Evidence from Russia, Europe-Asia Studies, 64 (2), pp. 247-256.
Mamonov, M. (2017). Report of the Bank of Russia «On economic research» series «Financial sector, economic growth and macroeconomic stability», pp. 15-29.
Sahay R., Cihak M., N'Diaye P., Barajas A., Bi R., Ayala D., Gao Y., Kyobe A., Nguyen L., Saborowski, C., Svirydzenka, K., Yousefi, S. (2015). Rethinking Financial Deepening: Stability and Growth in Emerging Markets. IMF staff Discussion Note SDN /15/08.
Vardevanyan, G. (2006). Comparative analysis of the coefficient of monetization of GDP in Belarus, Russia and Ukraine. Belarusian economic journal, No 4, pp. 71-74.
1. Ural State University of Economics, 620144, Russia, Ekaterinburg, 8 marta str., 62
2. Ural State University of Economics, 620144, Russia, Ekaterinburg, 8 marta str., 62
3. Ural State University of Economics, 620144, Russia, Ekaterinburg, 8 marta str., 62
Contact Email: ctig.usue@mail.ru