![]() ISSN 0798 1015
ISSN 0798 1015

![]() ISSN 0798 1015
ISSN 0798 1015
Vol. 40 (Number 18) Year 2019. Page 2
WIBOWO, Agus Satrya 1; CHRISTA, Usup Riassy 2; NURWATI, Solikah 3; SABIRIN, Sabirin 4 & MURNIATI, Telawang Mayang 5
Received: 19/12/2018 • Approved: 03/03/2019 • Published 03/06/2019
2. Literature Review and Hypothesis Development
ABSTRACT: This study investigated the relation between overvaluation and distress risk in manufacturing companies in Indonesia Stock Exchange (IDX) from 2010-2014. The formula from RKRV was used as a measurement of overvaluation, whereas distress risk was used in accordance with Altman Z Score. Statistical output provided evidence that an increase in overvaluation was strongly related to the decrease of distress risk. The findings contribute to agency costs, particularly, on overvalued equity from the other perspectives related to the distress risk. |
RESUMEN: Este estudio investigó la relación entre la sobrevaluación y el riesgo de angustia en empresas manufactureras en la Bolsa de Valores de Indonesia (IDX) de 2010-2014. La fórmula de RKRV se usó como una medida de la sobrevaluación, mientras que el riesgo de socorro se usó de acuerdo con el puntaje Z de Altman. La producción estadística proporcionó evidencia de que un aumento en la sobrevaluación estaba fuertemente relacionado con la disminución del riesgo de angustia. Los hallazgos contribuyen a los costos de la agencia, en particular, sobre la equidad sobrevaluada desde las otras perspectivas relacionadas con el riesgo de socorro. |

This study examines how small Overvaluation affects financial distress, particularly the relation between equity in small overvaluation and financial distress in a company. Overvaluation encourages managers to hold the financial distress longer by performing value creation. The consequence is a destruction of the core value and financial health of the company. Furthermore, Jensen (2005) states that in an overvaluation condition, the management will create a value (value creating) expected by the market with a goal to create a growth illusion. However, as the market knows that the value creating is a growth illusion, the value of the company falls drastically and becomes more dangerous in affecting the fall of the company core value. Marciukaityte and Varma (2008) prove that an overvalued manager uses a profit manipulation to deceive the market, making the market to believe that the management will produce a value anticipated by the market players. Besides, Badrescher (2011) finds that an overvalued manager shows bigger evidence in exploitation of GAAP earnings management. In addition, because of the sustained overvaluation duration, overvalued companies are involved in non-GAAP earnings management, the most terrible form of the earnings management. Empirical evidence indicates a relation between overvaluation and financial distress. Griffin and Lemmon (2002) find that a firm with a low book to market equity has a high distress risk and low current earnings. The result shows that overvaluation is a trigger on creating value through earnings management to create growth illusion. A misvaluation company is indicated by the overvaluation and tendency to create an acquisition (Shleifer & Vishny, 2003; Jensen, 2005; RKRV, 2005). Shleifer and Vishny (2003) argue that a firm is possible to use the overvalued stock to acquire the real assets smaller than their economic value, and to grow profit of the original stockholder even if their stock value falls.
The previous findings show that overvaluation triggers the earnings management and the merger activity in order to meet the investor expectation in financial performance improvement. The action results in the financial health of the firm. Jensen (2005) argues that overvaluation provides an access to the debt and cheap equity capital for managers effecting in excessive internal spending, negative risk infestation of net present value, and eventually performing accounting manipulation or fraud in order to present a growth illusion and value creation. Certainly, the action decreases and destroys the financial health resulting in the high risk of distress. However, Jensen (2005) provides another view on substantial or massive overvaluation, especially on a consistent overvaluation in market efficiency. Certainly, all firms want to pursue the growth expected by the investor or stockholder (Kurniawan, 2017). In small overvaluation, the manager tries to maintain the investor expectation by performing a management action, including infestation, merger, market expansion, or featured product development. The action might be funded by the debt and cheap equity capital of the available overvaluation margins. Furthermore, the manager will not be pressured as in substantial overvaluation condition since the small overvaluation and investor expectation towards the company growth is in a fair condition. A fair growth gradually increases financial health (indicated by a low financial distress) because of available proper working capital, increasing sales, and definite profit.
Penman (1996) states that book-to-market reflects growth opportunity, leverage, mispricing, risk, and distress indication. Overvaluation equity is indicated by the low book-to-market ratio, whereas undervaluation is indicated by the high book-to-market ratio. Moreover, Lakonishok, Shleifer, and Vishny (1994) state that book-to-market is a mispricing and stock measurement, meaning that a low book-to-market is an overpriced stock, whereas a high low book-to-market is an underpriced stock. Some researchers have revealed that the relation between book-to-market and distress risk is not monotonic (Dichev, 1998, Kim, 2013). Generally, a distress company has a high book-to-market, whereas an extremely distress company has a lower book-to-market (Dichev, 1998). On the other hand, Kim (2013) presents an evidence in BE/ME pattern, showing that a company with higher O-score (low distress risk) tends to have higher book-to-market (underpriced), except for the company with the highest O-score and the lowest book-to-market (overpriced). Moreover, Ibrahim et al. (2014) reveals that in Brazil, India, and China (except Turkey), the company with high BE/ME precisely has low Z-score or low distress risk. Using the sample period in 1998-2008 on Chinese stock market, Huang et al. (2013) provides evidence that the factor B / M is unrelated to distress risk.
Nevertheless, rational pricing indicates that high (BE/ME) is a signal for low earnings, whereas low (BE/ME) is a signal for high earnings (Fama & French, 1995). Moreover, low BE/ME (high stock price relative to book value) is a typical for the company with high average returns on capital (growth stocks), whereas high BE/ME is a typical for the relatively distressed company. A company with low BM is that with a better growth option since the company desires to avoid the reliance on debt (Fitzpatrick & Ogden, 2011) in order to decrease distress risk. In addition, Griffin and Lemmon (2002) find that companies with high market equity set higher risk premium since the companies have higher distress risk. The higher the leverage, the higher the financial risk will be. Therefore, the probability of financial distress is higher since a very leveraged company (high TLTA ratio) causes a hard and dangerous position if creditors demand the debt payment written in contract (Tinoco & Wilson, 2013). Compared to previous research in massive overvaluation, this study contributes to other perspectives of literature on overvaluation providing an overview of common (small) overvalued condition. Previous studies result in a contradiction that distress risk is triggered by the low or high BE/ME. This study investigates the overvaluation role as a distress risk predictor since overvaluation can see growth potency in the future and emphasizes on the difference of sector-wide, company specific misvaluation and the idea that a company is able to possess idiosyncratic misvaluation components (RKRV, 2005; Chi Gupta, 2009). The results show that overvaluation is strongly correlated to the decrease of distress risk. However, the result is in contrast to Jensen (2005), stating that overvaluation causes the company core values to fall. A high BE/ME (weak overvaluation) is a sustained signal of the low return on book equity Fama & French (1997). In addition, Griffin and Lemmon (2002) argue that a high ratio of BE/ME indicates a characteristic in relation to distress risk, including low return, high leverage, and low sales growth.
Jensen and Meckling (1976) develop a theory to decrease agency costs caused by the conflict of interest between principal and agent, including contracting, monitoring, and bonding costs by seeing market as a strength helping to control agency costs. Jensen (2005) states that conflict of interest is a strength leading to the destruction of values created by the security market of substantially overvalued equity. In addition, Jensen (2005) show that an overvalued stock price generates a destruction of values because the manager and the board have received signals from the market. This overvaluation condition enables the unhealthy company to harm the company fundamentals. Overvaluation encourages the manager to undertake the value creating by exploiting overvaluation through acquisition/merger, and maintaining the overvaluation through earning management actions to complement the investors’ expectation of the company value. In consequence, these actions lead to mispricing. Recent evidences show that overvalued equity has strength to damage the fundamentals (core value) since the incorrect market valuations produces organizational strengths harming the long-term value (Shleifer & Vishny, 2003; Marciukaityte, Raj Varma, 2008; Chi & Gupta, 2009; Badreschert, 2011; Fu, Lin & Officer, 2013).
The low BE/ME indicates a mispricing as a reflection of overvaluation condition. Fama and French (1995) finds that a signal of weak earnings persistence is shown by high BE/ME, whereas a strong earnings persistence signal is shown by low BE/ME. High BE/ME (low stock price relative to book value) is a sustained signal of low earnings on book equity. Therefore, low BE/ME (high stock price relative to book value) is a typical of company with high average returns on capital (growth stocks), whereas high BE/ME is a typical of relatively distressed company. A high equity book-to-market company has high returns, high financial leverages, high uncertainty returns, and possibilities of cutting the dividend compared to the low BE/ME (Fama & French, 1995). Griffin and Lemmon (2002) find that a group of companies with the highest distress risk covers several companies with high ratio (BE/ME) and low past returns. Using samples of NYSE stocks, Fama and French (2014) finds that a company with high BE/ME ratio is likely a low investment company. It indicates that weak overvaluation (high BE/ME) is correlated to low investment and high uncertainty returns, encouraging a distress risk of the company. Thus, this paper proposes an assumption that if overvaluation decreases, distress risk increases.
The sample was companies listed in Indonesia Stock Exchange 2010-2014. A company is substantially overvalued when the stock value is 100% or 1,000% of intrinsic firm value (Jensen, 2005; RKRV, 2005; Gupta, 2009; Baderschert, 2011). The result showed that all companies were in small overvaluation condition. The analyzed final sample included 590 observations and 118 companies. Table 1 presents the sample criteria.
Table 1
Sample Selection
Sample characteristic |
Number of companies |
|
Panel A: Description |
||
Listed company in IDX 2010-2014 |
494 |
|
Financial |
(81) |
|
Nonfinancial |
413 |
|
Manufacturer |
142 |
|
Insufficient financial data |
(24) |
|
Final sample |
118 |
|
Panel B: Composition of manufacturing final sample |
||
1 |
Cement |
4 |
2 |
Ceramics, Glass, Porcelain |
6 |
3 |
Metal and Allied Product |
13 |
4 |
Chemicals |
8 |
5 |
Plastics and Packaging |
11 |
6 |
Animal Food |
4 |
7 |
Wood Industries |
2 |
8 |
Pulp and Paper |
6 |
9 |
Machinery and Heavy Equipment |
0 |
10 |
Automotive and Components |
12 |
11 |
Textile, Garment |
14 |
12 |
Footwear |
2 |
13 |
Cable |
6 |
14 |
Electronics |
1 |
15 |
Food and Beverages |
12 |
16 |
Tobacco Manufactures |
3 |
17 |
Pharmaceuticals |
8 |
18 |
Cosmetics and Household |
3 |
19 |
Houseware |
3 |
Total final sample |
118 |
|
This study used data panel regression since it presents informative data, high variability, low collinearity between variables, and efficient degrees of freedom to enrich the empirical analysis (Gujarati 2004). Furthermore, ordinary least square regression, fixed effects models and random effects models were used to examine the appropriate specifications in models (Gharbi et al., 2014). The primary models are as follows.
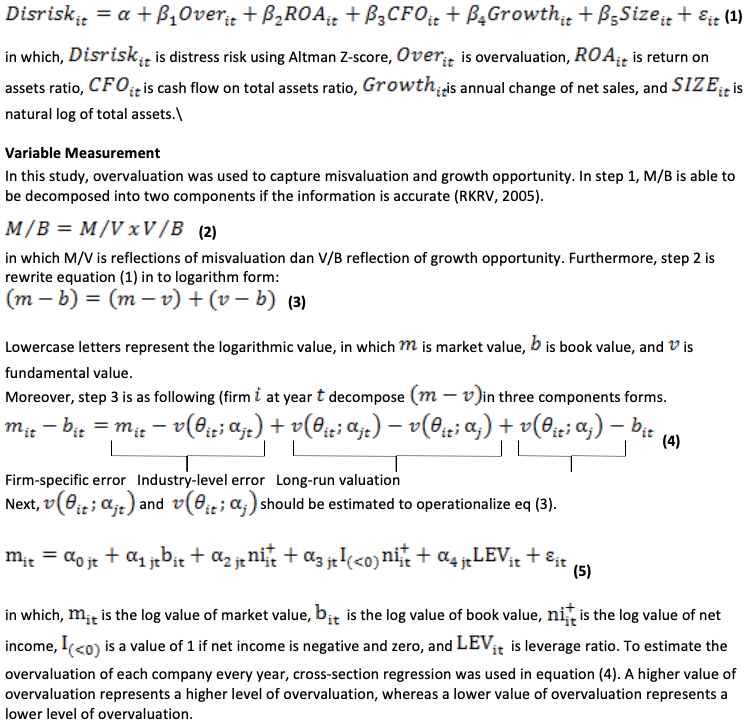
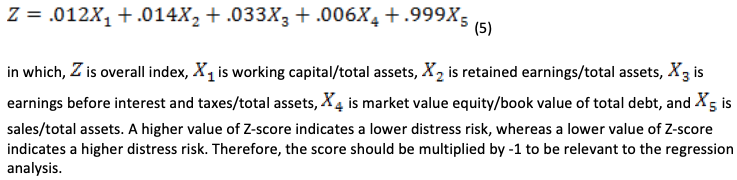
In measuring the variable of distress risk, the original model of Altman Z-score used proxy for distress risk since Altman Z-score assess the bankruptcy prediction problem with a combination of financial ratio and discriminant analysis (Altman, 1968).
The Z-score is computed as following.
A number of control variables were included to control the characteristics of the company in relation to the distress risk. Several studies have found that leverage (LEV) is negatively related to distress risk (Habib et al., 2012; Campa & Camacho-Miñano, 2014). Return on assets (ROA) is negatively related to distress risk (Campa & Camacho-Miñano, 2014). Operating cash flow (OCF) is negatively related to distress risk (Habib, 2012; Campa & Camacho-Miñano, 2014). Growth is negatively related to distress risk (Conrad et al., 2014). Size is negatively related to distress risk (Tykvova & Borell, 2012; Tinoco & Wilson, 2013; Campa & Camacho-Miñano, 2014).
Table 2 shows descriptive statistics of all variables used in pool regression. The distress risk sample in -3.87 indicated that the average of company was in low distress condition. Descriptive statistic also indicated that the average of overvaluation was 0.94%. The variables of ROA, CFO, growth, and size showed positive averages indicating in a good condition.
Particularly, mean (median) of OCF was slightly higher than in previous studies (Habib, 2012; Campa & Minano, 2015). However, ROA, distress risk, growth, and size were different from the previous studies. Overvaluation variable denoted a positive sign in the mean (median) of 0.98 (0.945), indicating that the company value was overvaluation. Furthermore, mean (median) value of 0.948 (0.945) indicated that the company value was above 0 (true value). Distress risk mean (median) of -3.879 (-2.453) provided information that generally the company was in low distress risk.
Table 2
Descriptive Statistic
Variables |
Mean |
Minimum |
Median |
Maximum |
Std. Dev |
DisRisk |
-3.879 |
-25.760 |
-2.453 |
2.413 |
4.446 |
Over |
0.948 |
0.848 |
0.945 |
1.200 |
0.041 |
ROA |
0.061 |
-0.755 |
0.045 |
0.669 |
0.120 |
OCF |
0.078 |
-1.081 |
0.064 |
1.138 |
0.161 |
Growth |
7929 |
-2158 |
1261 |
3257 |
2648 |
Size |
14.093 |
9.266 |
13.937 |
19.181 |
1.591 |
Pearson correlation matrix was used to test the multicollinearity for both dependent and independent variable. Multicollinearity stands in higher values of coefficient correlation than 0.7 (Anderson et al., 1990). Table 3 shows the coefficient correlation of Over and DisRisk as well as ROA and DisRisk (-0.518 and -0.629, respectively). However, the coefficient correlations of all variables are smaller than 0.7, indicating the absence of multicollinearity problems.
Table 3
Pearson Correlations
Variables |
1 |
2 |
3 |
4 |
5 |
6 |
|
1 |
Disrisk |
1 |
|
|
|
|
|
2 |
Over |
-0.518** |
1 |
|
|
|
|
3 |
ROA |
-0.629** |
0.240** |
1 |
|
|
|
4 |
OCF |
-0.460** |
0.237** |
0.559** |
1 |
|
|
5 |
Growth |
-0.303** |
0.161** |
0.169** |
0.084* |
1 |
|
6 |
Size |
-0.174** |
0.190** |
0.189** |
0.194** |
0.490** |
1 |
Notes: **ρ < 0.01 (two-tailed), *ρ < 0.05 (two-tailed), † ρ < 0.10 (two-tailed) DisRisk is distress risk measured as original Altman Z-score. Over is overvaluation measured as RKRV (2005). ROA is ratio of net income to total assets. OCF is operating cash flows divided by total assets. Growth is annual change of net sales. Size is firm size measured as natural log of total assets. |
|||||||
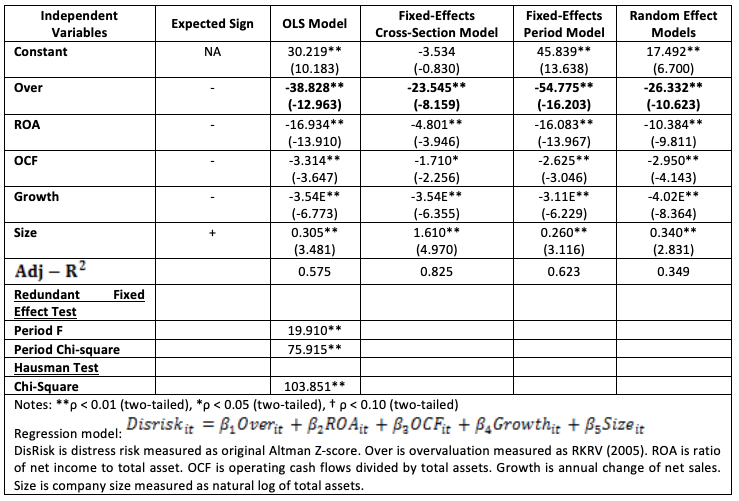
Table 4 shows the estimation of the primary model (1) investigating the relationship between overvaluation and distress risk. The distress risk was regressed in overvaluation and four control variables. The model was examined by OLS, fixed effect models, and random effect models. P-value 0.000 on all models provided evidence of the strong models. Both statistic value (19.910 and 75.915) and p-value were significant to decline the null between the redundant OLS model, cross section and period fixed effect. The Hausman test showed that chi-square (103.851), significant p-value and the null were declined, meaning that there was no difference between fixed and random effect.
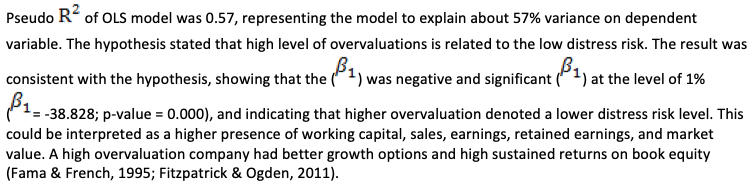
A high overvaluation indicated that the higher expected earnings imply a higher expected return. Furthermore, these finding indicated that low B/M (high overvaluation) was likely to have of high profitability and investment since high growth stock reduces distress risk. It was consistent with Fama and French (1994; 2014), arguing that low B/M stock (high overvaluation) represented a high market capitalization, and is likely to generate profit and invest aggressively.
An increase in overvaluation was a description of investors’ positive expectations on the company growth. Furthermore, higher expected earnings and growth implied higher expected returns. High overvaluation was a reflection of an increase in the company value, meaning that the firm was relatively convenient to obtain the expense affecting in the increasing of capital, sales, and returns. Thus, it led to value creating to increase investment and profitability, showing that the company liquidity was maintained and distress risk was reduced.
The control variables (ROA, OCF, Growth) were negatively and significantly associated with distress risk, whereas size was positively and significantly associated with distress risk. In line with previous studies, ROA had a negative relation to distress risk (Campa & Camacho-Miñano, 2014). The findings of this study indicated that higher ROA was likely to have a low distress risk. Therefore, since ROA provided information about the company profitability, a higher distress led to low profitability caused by the low ability to generate returns. Several previous studies provided evidence that OCF was negatively related to distress risk (Habib, 2012; Campa & Minano, 2015). This finding showed that a higher OCF was likely to have a low distress risk. It provided information that under a higher distress risk condition by possessing negative operating cash flow, the company was difficult to maintain and develop the operational activities. In accordance with the finding of Conrad et al. (2014), a higher growth in sales was more likely to have a low distress risk. Surprisingly, this study showed a positive relation between the size and distress risk, in contrast to the previous finding proven that size and distress risk was in negative relation (Tykvova & Borell, 2012; Tinoco & Wilson, 2013; Campa & Camacho-Miñano, 2014). This finding suggested that an increase of total assets, genuinely, enhanced the pressure to manage effectively and efficiently, and to interfere the expected profitability.
Table 4
Overvaluation and distress risk
The existing literature has consistently highlighted that overvaluation possesses a risk to company health. This study examines and extends the results study stated by Jensen (2005) that the (massive) overvaluation causes destruction of the core values and the health of the company (distress risk). However, previous studies only examine the massive overvaluation. Therefore, there is a missing link between small overvaluation and distress risk. Particularly, by using pool data and sample of manufacturing company in Indonesia Stock Exchange 2010-2014, this study provides evidence that an increase in overvaluation might increase profitability and investment, and trigger managers to perform value creating by increasing the capital, sales, earnings, retained earnings, and market value. Thus, the actions reduce the distress risk of the company.
This study contributes to the agency costs of overvalued equity showing a good perspective of overvaluation to the company’s health. The findings have implications for researchers, regulators, investor, and analyst. For researchers, focusing on massive overvaluation does not fully explain the entire body of overvaluation. For regulators, the findings help to oversee the overvaluation and distress risk level by creating rules. For investors and analysts, the result helps to select the portfolio in fundamental analysis. Lastly, future studies should examine the appropriate boundary of positive and negative overvaluation in relation to the distress risk.
Altman, E. I. (1968). Financial ratios, discriminant analysis and the prediction of corporate bankruptcy. The journal of finance, 23(4), 589-609.
Avramov, D., Kaplanski, G., & Subrahmanyam, A. (2018). The Predictability of Equity Returns from Past Returns: A New Moving Average-Based Perspective.
Campa, D., & Camacho-Miñano, M. D. M. (2014). Earnings management among bankrupt non-listed firms: evidence from Spain. Spanish Journal of Finance and Accounting/Revista Espanola de Financiacion y Contabilidad, 43(1), 3-20.
Chi, J. D., & Gupta, M. (2009). Overvaluation and earnings management. Journal of Banking & Finance, 33(9), 1652-1663.
Dichev, I. D. (1998). Is the risk of bankruptcy a systematic risk?. the Journal of Finance, 53(3), 1131-1147.
Fama, E. F., & French, K. R. (1995). Size and book‐to‐market factors in earnings and returns. The journal of finance, 50(1), 131-155.
Fama, E. F., & French, K. R. (1997). Industry costs of equity. Journal of financial economics, 43(2), 153-193.
Fama, E. F., & French, K. R. (2014). A five-factor asset pricing model, fama-miller working paper.
Fitzpatrick, J., & Ogden, J. P. (2011). The detection and dynamics of financial distress. International Review of Finance, 11(1), 87-121.
Fu, F., Lin, L., & Officer, M. S. (2013). Acquisitions driven by stock overvaluation: Are they good deals?. Journal of Financial Economics, 109(1), 24-39.
Griffin, J. M., & Lemmon, M. L. (2002). Book‐to‐market equity, distress risk, and stock returns. The Journal of Finance, 57(5), 2317-2336.
Gujarati D. N. (2004). Basic Econometrics 4 th . Ed. (Tata McGraw- Hill Edition) p806 New Delhi: Tata McGraw- Hill Publishing Company Ltd
Habib, A., Jiang, H., & Zhou, D. (2014). Audit quality and market pricing of earnings and earnings components in China. Asian Review of Accounting, 22(1), 20-34.
Jensen, M. C., & Meckling, W. H. (1976). Theory of the firm: Managerial behavior, agency costs and ownership structure. Journal of financial economics, 3(4), 305-360.
Kurniawan, R. (2017). Effect of Environmental Performance on Environmental Disclosures of Manufacturing, Mining and Plantation Companies Listed in Indonesia Stock Exchange. Arthatama Journal of Business Management and Accounting, 1(1), 6-17.
Lakonishok, J., Shleifer, A., & Vishny, R. W. (1994). Contrarian investment, extrapolation, and risk. The journal of finance, 49(5), 1541-1578.
Marciukaityte, D., & Varma, R. (2008). Consequences of overvalued equity: Evidence from earnings manipulation. Journal of Corporate Finance, 14(4), 418-430.
Penman, S. H. (1996). The articulation of price-earnings ratios and market-to-book ratios and the evaluation of growth. Journal of accounting research, 235-259.
Rhodes–Kropf, M., Robinson, D. T., & Viswanathan, S. (2005). Valuation waves and merger activity: The empirical evidence. Journal of Financial Economics, 77(3), 561-603.
Shleifer, A., & Vishny, R. W. (2003). Stock market driven acquisitions. Journal of financial Economics, 70(3), 295-311.
Tinoco, M. H., & Wilson, N. (2013). Financial distress and bankruptcy prediction among listed companies using accounting, market and macroeconomic variables. International Review of Financial Analysis, 30, 394-419.
Tykvová, T., & Borell, M. (2012). Do private equity owners increase risk of financial distress and bankruptcy?. Journal of Corporate Finance, 18(1), 138-150.
1. Faculty of Business and Economics, Universitas Palangka Raya, Jl. Yos Sudarso, Palangka, Jekan Raya, Kota Palangka Raya, Kalimantan Tengah 74874, Indonesia, contact: assatrya77@gmail.com
2. Universitas Palangka Raya, Jl. Yos Sudarso, Palangka, Jekan Raya, Kota Palangka Raya, Kalimantan Tengah 74874, Indonesia
3. Universitas Palangka Raya, Jl. Yos Sudarso, Palangka, Jekan Raya, Kota Palangka Raya, Kalimantan Tengah 74874, Indonesia
4. Universitas Palangka Raya, Jl. Yos Sudarso, Palangka, Jekan Raya, Kota Palangka Raya, Kalimantan Tengah 74874, Indonesia
5. Universitas Palangka Raya, Jl. Yos Sudarso, Palangka, Jekan Raya, Kota Palangka Raya, Kalimantan Tengah 74874, Indonesia