![]() ISSN 0798 1015
ISSN 0798 1015

![]() ISSN 0798 1015
ISSN 0798 1015
Vol. 40 (Number 20) Year 2019. Page 12
BORRERO-SALAZAR, Alex A. 1; CARDENAS-CABRERA, Jorge M. 2; BARROS-GUTIERREZ Daniel A. 3 & JIMÉNEZ-CABAS, Javier A. 4
Received: 06/03/2019 • Approved: 28/05/2019 • Published 17/06/2019
ABSTRACT: Model Predictive Control (MPC) is a useful tool when controlling processes that handle a large number of input and output variables. This study presents a comparison of different MPC strategies when they are subjected to control process variables directly. The strategies studied are IMC, GPC, MPC-D, MPC-DR, and DMC. Evaluation of the performance of the controlled loop was performed with the filtering and correlation analysis algorithm (FCOR). The methodology proposed is validated in a Continuous Stirred-Tank Reactor (CSTR) case study. Discrete predictive control demonstrated the best results in this study. |
RESUMEN: El Control predictivo de modelos (MPC) es una herramienta útil para controlar procesos que manejan un gran número de variables de entrada y salida. Este estudio presenta una comparación de diferentes estrategias de MPC cuando son usadas para controlar directamente variables de proceso. Las estrategias estudiadas son IMC, GPC, MPC-D, MPC-DR y DMC. La evaluación del desempeño del lazo de control se realizó con el algoritmo de análisis de filtrado y correlación (FCOR). La metodología propuesta se valida en un caso de estudio tipo CSTR. El control predictivo discreto demostró los mejores resultados en este estudio. |

Along history there have been countless industrial incidents that have resulted in several loss of human lives, as well as billions of economic losses associated with these events. Bhopal disaster is the world’s worst industrial disaster and took place in a pesticide plant in Bhopal. That disaster occurred in 1984, and at least 3.000 people died in the first 24 hours and later 15.000 more because of the aftermath of the event (Zio & Aven, 2013). This and many other incidents (Brice, 2008; Zio & Aven, 2013) have been caused for an identified (or not) failure in the process, which caused a sequence of 'inter-dependent' errors and ended in an unfortunate event.
These failures might have been prevented if one could keep constant monitoring of the control variables associated with the critical process in industrial plants. As a matter of fact, on average, a control engineer is responsible for about 450 control loops; however, the number of loops ranges between 30 and 2.000 (Bauer, Horch, Xie, Jelali, & Thornhill, 2016). Moreover, at the same time, this control engineer has to take care of administrative tasks and non-related to process control (Bauer et al., 2016).
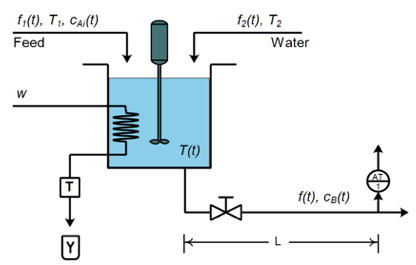
A control engineer’s primary purpose when designing and implementing a control loop must be to guarantee and Table operation and an efficient production (Lindström, Kyösti, & Delsing, 2018; Sanjuan, Kandel, & Smith, 2006). With the intention of contributing to the control area, this work has been divided in two parts, first, the design and implementation of Model Predictive Controllers (MPC) are considered and second, two index performances are proposed in order to compare the MPC controllers mentioned previously. These indexes are the Filtering and Correlation method (FCOR) and the Integral of Absolute Error IAE (IAE), for a continuous production process, which is a reactor with heating through a coil with steam, where two reactions take action. A more detailed description of the process can be found in (Sanjuan et al., 2006).
The strategies implemented in this work are based on IMC (Duarte et al., 2017; Garcia & Morari, 1982), GPC (Clarke, Mohtadi, & Tuffs, 1987) and MPC Discrete (Wang, 2009) methods. In the implementation of these strategies the following considerations were taken:
Results have shown that the best performance was achieved using control systems based on discrete time (MPC-D and MPC-DR). The worst performance was presented by control systems based on GPC and DMC. In the present work two index performances are proposed as metrics of the behavior or accomplishment of the objectives of a control loop in an industrial process, taken as a case study a CSTR which is a typical process that can be found in industrial practice (dos SANTOS & others, 2016; Rivera, Alzate, & Arias, 2015).
Figure 1
Continuous Stirred-Tank Reactor (CSTR),
taken from (Sanjuan et al., 2006)
The characteristics of the different transmitters necessary to carry out the process control were determined from the specification sheets of instruments available in the market, such as:
The level and flow transmitters have quite low response times therefore, they were only modeled as pure gains.
For the temperature sensor, a range of 200°F was selected, with a time constant of 0.5s.
A maximum concentration for B of 2 was defined, then taking as span 2 . For this type of samples, the retention times in the columns are approximately 4 min, which leads to a time constant of 0.8 min.
Typically the steam is worked as compressible fluid, although for the conditions established in the problem where the pressure and the saturation temperature are close to atmospheric (17.02 psi and 219.45 F) a small pressure drop across the valve is considered and for these conditions the sizing of the valve can be approximated to a liquid service fluid valve. Twice as much of the flow in steady state was taken for the maximum steam flow and a maximum pressure drop of 4 psi and a minimum of 2 psi (which can approximate the behavior of a valve for fluids service), then was calculated. The a value was obtained to determine which type of valve had to be chosen, the value obtained was quite low (a value of 2.4); therefore, it was chosen proportionally, a gain of 0.589 was obtained. Similarly, the valves of the feed and water streams were dimensioned.
The characteristics of the transmitters and final control elements used in the simulations are summarized below.
Table 1
Characteristics of the Transmitters and Final Control elements
Process Stream |
Instrument |
Gain |
Time Constant |
Feed Stream |
Flow Transmitter |
2.0544 |
|
Water Stream |
Flow Transmitter |
2.7650 |
|
Outlet Stream |
Concentration Transmitter |
50 |
0.8 |
CSTR Level |
Level Transmitter |
4 |
|
Outlet Stream |
Temperature Transmitter |
0.5 |
0.0017 |
Steam Stream |
Steam Valve |
0.5893 |
0.1667 |
Water Stream |
Water Valve |
2.7056 |
0.1667 |
Feed Stream |
Feed Valve |
3.6414 |
0.1667 |

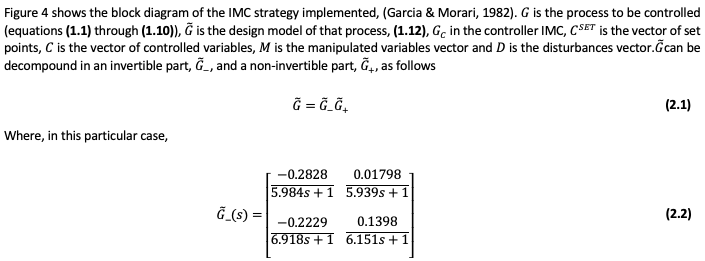
Figure 4
IMC Block Diagram Strategy
Figure 5
IMC Closed-Loop System Response
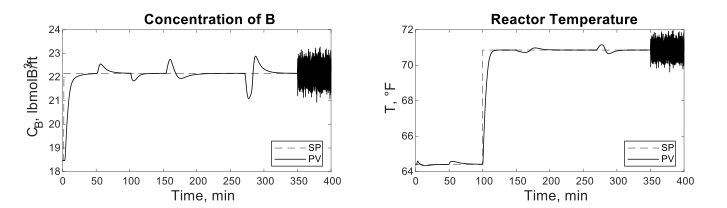
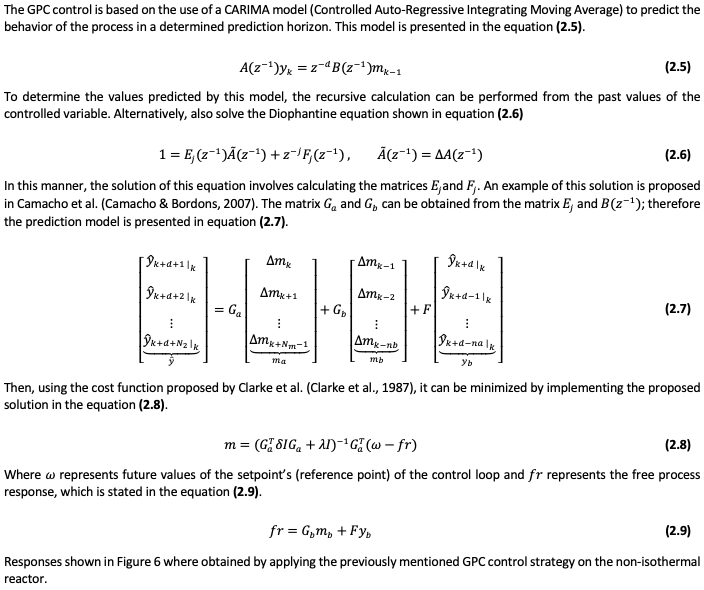
Figure 6
GPC-FT Closed-Loop System Response
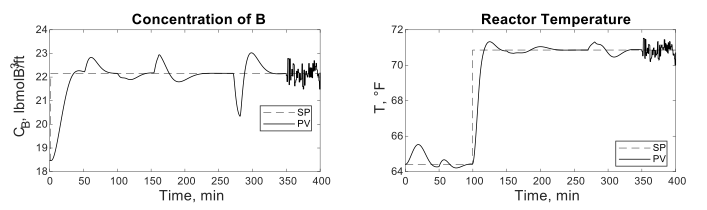

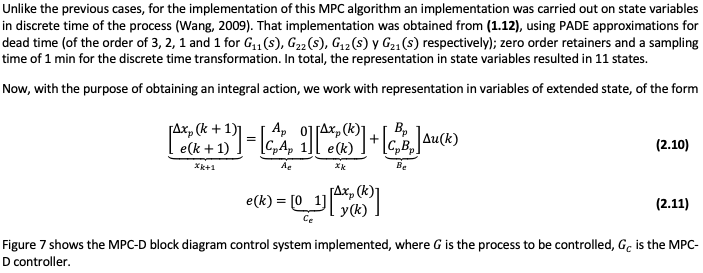
Figure 7
MPC-D Strategy Block Diagram
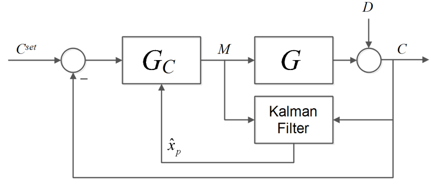
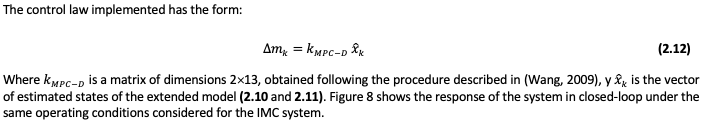
Figure 8
MPC-D System Response in Closed-Loop
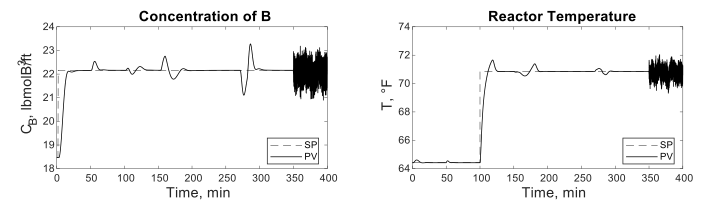
Figure 9
MPC-DR Strategy Block Diagram
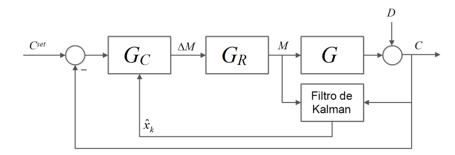
This strategy of predictive control, unlike the other strategies, does not use an explicit model within its structure to determine the future behavior of the controlled variable (s). In this sense, this approach is advantageous, since to obtain the prediction it is only necessary to have the response curve of the process and assume a linear behavior. In comparison with the other strategies, assuming linearity is not a disadvantage because all the strategies used to make this assumption. Then, from the response vector, the unit response vector is obtained. This vector is calculated by subtracting, at each of the values of the response, the initial value of this. To then divide the result by the value of the used to obtain the response vector. Thus, the response matrix is represented in (2.13).

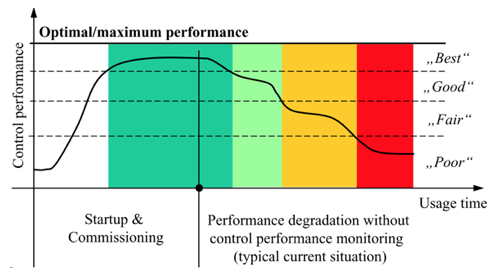
In an industrial process, there are typically hundreds to thousands of controllers, which are usually of the Proportional-Integral-Derivative (PID) type, but there may also be non-linear, adaptive, or multivariable-predictive controllers (Harris, Seppala, & Desborough, 1999). However, most controllers work well during the first stage of operation (typically the first six months) (Jelali, 2012), after which their performance begins to deteriorate gradually until they are finally destined to be manual. See Figure 12.
Figure 12
Typical decay of industrial process control performance
due to different factors, taken from (Jelali, 2012)
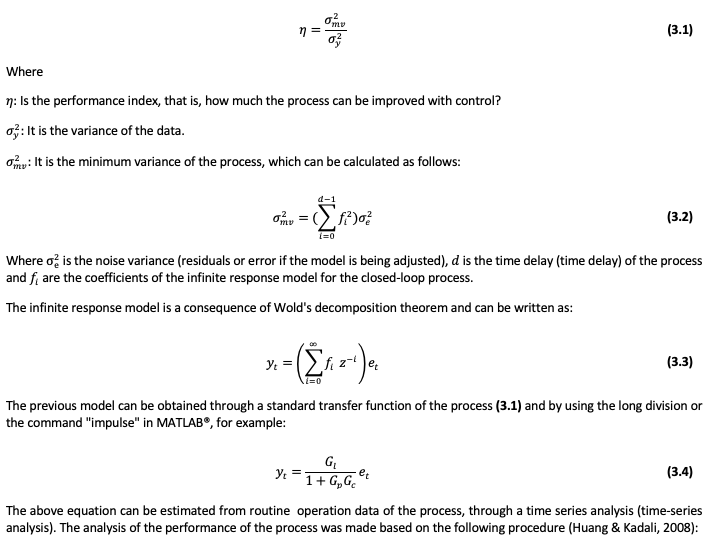
The methods for evaluating control loop performance are divided into: 1. Deterministic (based on settling time, based on area, performance indices), 2. Advanced (based on a model: Gaussian linear quadratic LQG, minimum generalized variance GMV, predictive models), and 3. Stochastic (based on data); the latter can be classified as 3.1 specified by the user (desired behavior of the closed loop, reference model, historical), 3.2 First-Pass (descriptive statistics, auto-correlation, spectral analysis) 3.3 Minimum variance (MV) (based on the interacting matrix, not based on the interacting matrix). Several interests in the performance of the plant or the process has been shown in recent studies (CANO, BOTERO, & RIVERA, 2017; JORDÃO, Neto, & others, 2016; Mauricio Johnny & RODRIGUEZ, 2015) , where from a different perspective, they look forward the improvement of the overall system. The methods for evaluating the performance of the control loop are based on determining the variance of the process and comparing it with some "ideal" value or desired value. In the present study, the Filtering and Correlation algorithm (FCOR) (Huang, 1998) have been used, and it defines the key performance parameter as:
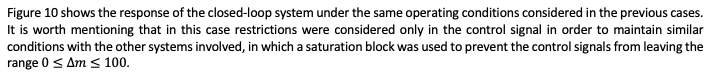
As mentioned before, the operational conditions in consideration in the simulations are: 20% increment in setpoint and also an increment of 10% in , both at t=2 and t=100 minutes, respectively. A pressure drop reduction of 20 % in the water valve at t=50 minutes, a 30% closing in the reactor’s discharge valve between minutes 150 and 160; a 10% drop in concentration of reactive A between t=270 minutes and t=280 and a Gaussian noise of zero mean at t=350 minutes.
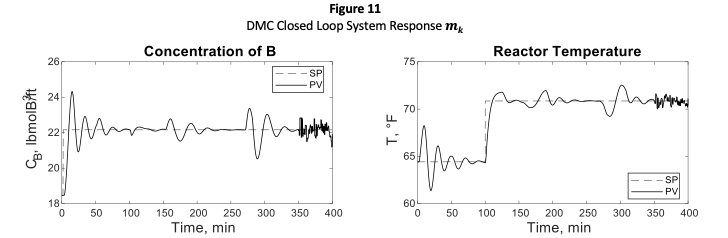
According to results shown in Table 2, one can observe that control strategy MPC-D is the one that permits obtain the best performance of the process concerning minimum variance when it is subjected to several disturbances as setpoint changes, variations in inlet reactive concentration, and variations in the opening of the discharge valve. The previous situation is most likely because of the Kalman-filter structure used in the control law, where there is a predictor module, and a corrector module, therefore this control strategy output will be the required for counteracting changes in the least aggressive and faster possible fashion. On the other hand, it can be evidenced that control signal changes can get to be very sudden/abrupt, situations that could get to be counterproductive regarding the correct functioning of control valves.
Table 2
Summary of the performance obtained with the different strategies
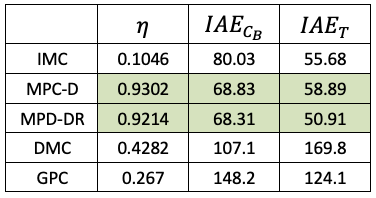
As for variations with respect to changes in the closure of the discharge valve it was concluded that control strategies IMC, MPC-D and MPC-DR presents the best performance, when taking into account that control variables are at their desired value or setpoint, as well as for ‘stability’ or ‘behavior’ of the controller output. Regarding the behavior of the control strategies when comparing the total IAE value, it was concluded that the best performance was obtained using the MPC-DR control strategy.
On the contrary, strategies like GPC-TF or DMC presents a lower performance. Therefore, DMC strategy presents the most significant variations against setpoint changes, and the GPC-TF control strategy presents the most considerable variations against sudden changes in the inlet water pressure. Regarding inlet reactive concentration changes, both strategies present a similar behavior between them.
Considering that the effects due to changes in setpoints over other output variables (for example, the effect on due to a change in ) are indicative of the level of interaction between inputs and outputs, it can be concluded that the internal model control (IMC) is the one that best dissociates interactions achieved; however it presents a very low-performance index.
Control strategies based on discrete MPC presents the best behavior against inlet disturbances, this results evident because their response was the best against changes in the water supply flow pressure, as well as a performance index close to 1.
The worst performance regarding the system and operational conditions analyzed was given for the GPC-TF and MPC-DR control strategies.
The best performance under the operational conditions mentioned above and also taking into account both performance indexes was presented by the MPC-DR scheme, mainly because of a faster speed response. It is important to mention that the performance index helps us determine how good or how bad the control loop have performance under some disturbances in a simpler form (compare data in Table 2) vs. traditional manner (compare Figures 5,6,8,10, and 11). These results very usefully when monitoring control loops in an industrial environment, where it can be found between one hundred or more than a thousand control loops. However, as in this research is evidenced, it is very beneficial having more than one performance index (for example, IAE besides of ) so one can be able to have a better understanding of the behavior of the control loops, and then from this information being able to take better decisions for different tasks: re-tuning or re-configuration of the control strategies.
It should be noted that, although the behavior accomplishes with IMC is similar to MPC-DR, and the additional advantage of the last one is that since it is a strategy based on discrete time, its implementation in a device like a PLC is more straightforward. It is important to mention that IMC strategy does not allow an effective integration with the use of restrictions, both in manipulated and controlled variables and then depending on the process to control this may not be the most viable option, although it can draw attention to the industrial level due to its ease of implementation.
As for the other predictive control strategies studied, it is important mentioning that an imperative step for having good performance is when setting the tuning of the controller, so according to the present study, it might be possible to be necessary to carry out an optimization process that allows obtaining the best possible tuning in each case.
This work was carried out with the collaboration of "Colciencias" and the "Programa de Jóvenes Investigadores e Innovadores". Without this collaboration this work would not have been possible.
Bauer, M., Horch, A., Xie, L., Jelali, M., & Thornhill, N. (2016). The current state of control loop performance monitoring--A survey of application in industry. Journal of Process Control, 38, 1–10.
Bosgra, O. (2007). Multivariable Feedback Control-Analysis and Design (Skogestad, S. and Postlewaite, I.; 2005)[book review]. IEEE Control Systems, 27(1), 80–81.
Brice, A. (2008). A guide to major chemical disasters worldwide.
Camacho, E. F., & Bordons, C. (2007). Nonlinear model predictive control: An introductory review. In Assessment and future directions of nonlinear model predictive control (pp. 1–16). Springer.
CANO, S., BOTERO, L., & RIVERA, L. (2017). Evaluación del desempeño de Lean Construction. Revista ESPACIOS| Vol. 38 (No39) Año 2017, 38(39).
Clarke, D. W., Mohtadi, C., & Tuffs, P. S. (1987). Generalized Predictive Control&Mdash;Part I. The Basic Algorithm. Automatica, 23(2), 137–148. https://doi.org/10.1016/0005-1098(87)90087-2
dos SANTOS, F. F. P., & others. (2016). Tecnologia destinada a produção de biodiesel utilizando uma plataforma de baixo custo e multifuncionalidade: Reator multifuncional destinado a produção de biodiesel. Revista ESPACIOS| Vol. 37 (No22) Año 2016.
Duarte, J., Garcia, J., Jiménez, J., Sanjuan, M. E., Bula, A., & González, J. (2017). Auto-ignition control in spark-ignition engines using internal model control structure. Journal of Energy Resources Technology, 139(2), 22201.
Garcia, C. E., & Morari, M. (1982). Internal model control. A unifying review and some new results. Industrial & Engineering Chemistry Process Design and Development, 21(2), 308–323.
Harris, T. J., Seppala, C. T., & Desborough, L. D. (1999). A review of performance monitoring and assessment techniques for univariate and multivariate control systems. Journal of Process Control, 9(1), 1–17.
Huang, B. (1998). Multivariate statistical methods for control loop performance assessment. University of Alberta Alberta, Edmonton, Canada.
Huang, B., & Kadali, R. (2008). Dynamic modeling, predictive control and performance monitoring: a data-driven subspace approach. Springer.
Jelali, M. (2012). Control performance management in industrial automation: assessment, diagnosis and improvement of control loop performance. Springer Science & Business Media.
JORDÃO, R. V. D., Neto, J. A. S., & others. (2016). Estratégia e desenho do sistema de controle gerencial. Revista ESPACIOS| Vol. 37 (No04) Año 2016.
Lindström, J., Kyösti, P., & Delsing, J. (2018). European roadmap for industrial process automation.
Mauricio Johnny, L., & RODRIGUEZ, C. M. T. (2015). Mapeamento do Estado da Arte do tema Avaliação de Desempenho direcionado para a Logística Lean. Revista ESPACIOS| Vol. 36 (No14) Año 2015.
Rawlings, J. B. (2000). Tutorial overview of model predictive control. IEEE Control Systems Magazine, 20(3), 38–52. https://doi.org/10.1109/37.845037
Rivera, J. R., Alzate, C. E. O., & Arias, J. A. T. (2015). Estudio preliminar de vigilancia tecnológica de emulsificantes usados en chocolatería. Espacios, 36(13).
Sanjuan, M., Kandel, A., & Smith, C. A. (2006). Design and implementation of a fuzzy supervisor for on-line compensation of nonlinearities: An instability avoidance module. Engineering Applications of Artificial Intelligence, 19(3), 323–333. https://doi.org/10.1016/j.engappai.2005.09.003
Smith, C. A., & Corripio, A. B. (1985). Principles and practice of automatic process control (Vol. 2). Wiley New York.
Wang, L. (2009). Model predictive control system design and implementation using MATLAB. Springer Science & Business Media.
Zio, E., & Aven, T. (2013). Industrial disasters: Extreme events, extremely rare. Some reflections on the treatment of uncertainties in the assessment of the associated risks. Process Safety and Environmental Protection, 91(1), 31–45. https://doi.org/https://doi.org/10.1016/j.psep.2012.01.004
1. Mechanical Engineering Department. Universidad del Norte. Km.5 Vía Puerto Colombia. Barranquilla, Colombia. E-mail: aaborrero@uninorte.edu.co
2. Department of Computer Science and Electronics. Universidad de la Costa, Calle 58 # 55-66. Barranquilla, Colombia. E-mail: jcardenas@cuc.edu.co
3. Department of Computer Science and Electronics. Universidad de la Costa, Calle 58 # 55-66. Barranquilla, Colombia. E-mail: dbarros9@cuc.edu.co
4. Department of Computer Science and Electronics. Universidad de la Costa, Calle 58 # 55-66. Barranquilla, Colombia. E-mail: jjimenez41@cuc.edu.co