![]() ISSN 0798 1015
ISSN 0798 1015

![]() ISSN 0798 1015
ISSN 0798 1015
Vol. 40 (Number 20) Year 2019. Page 16
ARKHIPOVA, Lidiya S. 1; GOROKHOVA, Irina V. 2 & DEMENKO, Olga G. 3
Received: 13/03/2019 • Approved: 03/05/2019 • Published 17/06/2019
ABSTRACT: The Russian regions’ production potential largely determines their stable development, which is necessary for the stability of the regional system, as well as for reducing risks from external and internal threats and crises. The production potential (as an integral part of the region’s socio-economic potential) shows regions’ potential opportunities, reflects the development level of productive forces, the ability of enterprises to produce competitive products, perform work and provide services. In this regard, the study presents a comparative assessment of the production potential of the three largest Russian macro-regions and includes conclusions made about differentiation and mechanism of development. In the article the terms "macroregions" and "Federal districts" are identical. |
RESUMEN: El potencial de producción de las regiones rusas determina en gran medida su desarrollo estable, que es necesario para la estabilidad del sistema regional, así como para reducir los riesgos de amenazas y crisis externas e internas. El potencial de producción (como parte integral del potencial socioeconómico de la región) muestra las oportunidades potenciales de las regiones, refleja el nivel de desarrollo de las fuerzas productivas, la capacidad de las empresas para producir productos competitivos, realizar trabajos y brindar servicios. En este sentido, el estudio presenta una evaluación comparativa del potencial de producción de las tres macrorregiones más grandes de Rusia e incluye conclusiones sobre la diferenciación y el mecanismo de desarrollo. En el artículo, los términos "macrorregiones" y "distritos federales" son idénticos. |

Production potential is formed on the basis of historical conditions, factors and natural conditions of the territory, determining the composition and structure of the resources used, which have their differences in quantitative and qualitative parameters. This is its feature.
Dynamic of region’s production potential is of great importance for regional studies. it is constantly evolving depending on the socio-economic situation, development strategies and time priorities. Despite the significant accumulated potential, the production sector of the Russian regions is desperately in need of equipment modernization and the introduction of the newest technologies. In this regard, the analysis of the main indicators characterizing the large regions’ production potential, which accumulates prospects for economic growth of the Russian economy, is of scientific and practical interest.
Research purpose: to determine the main factors of the regions’ economic stability by diagnosing the production potential in different sections: regional, structural, essential, etc.
Research objectives: to identify the reserves of economic growth at the regional level, regions’ strengths and weaknesses by using regional analysis methods.
Research subject. The research subject in the article is the production potential of the territories on the example of three Federal districts (macro-regions): North-West, Privolzhsky and Siberian. Each of them contributes to the whole country's economy, has its own specifics, features of socio-economic development and huge potential.
The dynamics of several key indicators reflects production potential and its efficiency. These indicators are fixed assets value, their structure by economic activities, depreciation, capital productivity, investments and so on. The priority areas of potential development are revealed by assessment of the dynamics of investments’ share made in manufacturing industries' fixed capital in GRP and its comparison with the dynamics of depreciation of fixed assets.
Research methodology includes the use of the following methods to assess the production potential of the territory:
1) comparative analysis of the main indicators characterizing macroregions’ production potential;
2) assessment of region’s place among other territories of the district by use of the positioning method in relation to the main indicators reflecting the development of the production sector;
3) using the methods of systematization for identifying mechanism of development and common characteristics of the economies.
The role of the macroregion in the country's economy is determined by the following indicators: it takes the third place among the Federal districts of the Russian Federation in terms of shipped goods of own production in the manufacturing sector (13.10%); has 10.4% of the country's GRP; concentrates 11% of fixed assets; provides about 13% of tax revenues to the budget of the Russian Federation; provides 11.2% of exports and 17.6% of imports (conceding only to the Central district) [1].
The regions with a stable economy and high GRP per capita in this district include St. Petersburg (city of federal significance), the Nenets Autonomous Area, the Republic of Komi and the Murmansk and Leningrad regions.
The district is characterized by a high proportion of pipeline transport, port facilities, terminals and customs infrastructure, which create strategic opportunities for enterprises to enter foreign markets. However, in the current economic and political conditions it is not possible to realize these opportunities fully [2].
The structure of the regions’ economy in general matches to the Russian profile, but is characterized by a larger contribution to the gross value added (GVA) of manufacturing industries (19.9%) and a relatively smaller share of the extractive sector and agriculture [2].
Engineering industry is the basis of manufacturing industries. It includes enterprises of the military-industrial complex, shipbuilding and production of marine equipment.
Value of fixed assets. This indicator is analyzed in the range of 2 and more billion rubles, as the highest. This gives a view of the availability and capacity of production potential. In the North-Western Federal district, the value of fixed assets exceeds 2 billion rubles only in three sub-federal units. St. Petersburg is an absolute leader among them (6.5 billion rubles or 32.2% of the value of the district funds). According to the cost of funds, such economic activities as “Transport and communication” and “Energy” stand out. This is due to the fact that the first of them stands out for the high value of the city as a major port, including export value. Power generation and distribution companies play an important role in the energy sector.
The second place belongs to the Republic of Komi, where the cost of funds operating in transport and communication enterprises is particularly high (58.8%). The region has an extensive network of pipeline and rail transport. The enterprises of the extractive industries also have large funds (20.4%). The Republic of Komi is the only sub-federal unit in the European part of the Russian Federation where all the main types of fuel and energy resources (oil, natural gas and coal) are developed. They have both domestic and export significance.
The third place in the value of fixed assets is occupied by the Leningrad region, on its there are modern highways, water transport infrastructure and logistics complexes (four sea trade ports in Vysotsk, Vyborg, Ust-Luga and Primorsk), where there are high requirements for the modernization of fixed assets. Their cost is 35.3% of the regional level. Enterprises of processing industries, which are the leaders in the district according to the specific weight of the cost of fixed assets) are located in Leningrad region. Engineering, chemical, construction, pulp and paper industries significantly contribute to the economy. The high cost of funds is also typical for energy. The Leningrad nuclear power station operates in this region, it has four energy blocks. A new innovative power unit at the Leningrad NPP-2 was put into full capacity in June, 2018. These areas of economic activity, which were mentioned, stand out in the district in general: the pole of growth and the leader are transport and communications, then – manufacturing and energy.
Depreciation of fixed assets. The dynamics of depreciation of fixed assets shows a positive trend, with the exception of St. Petersburg and the Republic of Komi. Depreciation in the Republic of Karelia has almost doubled depreciation. However, the Russian level (50.2%) is exceeded only in the Vologda oblast (51.6%). The Arkhangelsk region (50.1%) and the Republic of Karelia (49.6%) just approached to this level. As for the last sub-federal unit, there is noted high depreciation of funds in the extractive industries (66.3%). It is higher than the average in Russia, in agriculture (54.9%), and in the construction industry (52.5%). A similar trend has formed in the Vologda region: at mining enterprises the equipment is worn out to 63.3%, in construction – to 61.9%. A high depreciation of funds (more than 50%) in the extractive industry is noted in six subjects of the North-West Federal district, which includes two mentioned sub-federal units and in addition to them Novgorod, Murmansk, Kaliningrad, Leningrad region [1].
Over the past decade, districts’ share of investments in fixed assets in the GRP is constantly decreasing, especially since 2012, and depreciation of fixed assets is growing. This is largely due to the high deterioration of equipment and enterprises in General in the extractive industries of the regions. Nenets Autonomous Area is an exception, because the modernization of gas production enterprises is of strategic importance. This region is the leader in the share of investments in fixed capital in GRP, it is 53%.
Capital productivity. The minimum share of investments falls on the Republic of Karelia, and the dynamics for ten years shows its decline. In this region, as noted above, there are maximum values of depreciation of fixed assets. However, according to the efficiency of the use of fixed assets (return on assets), the region occupies a relatively average place in the district. The leading position is occupied by St. Petersburg and the Kaliningrad region. The Northern capital is distinguished by the highest capital return (three times higher than in Russia as a whole) in such economic activities as "Wholesale and retail trade", which is certainly due to the geographical location of the city and the functions of the city-millionaire. In second place – the Leningrad region, which also has a high concentration of commercial enterprises.
Among other economic activities with the highest capital productivity are allocated to processing industries (Leningrad and Kaliningrad regions) and extraction of minerals (St. Petersburg, Leningrad oblast and Republic of Karelia).
It is possible to trace a pattern consisting in the fact that often the increase in depreciation of fixed assets in the regions of the northwestern Federal district is accompanied by a decrease in capital productivity. The leaders in the efficiency of the use of fixed assets are St. Petersburg, Kaliningrad, Leningrad and Vologda regions. Low rates of capital productivity in the Murmansk region and the Nenets Autonomous district. They are characterized by a high cost of fixed assets in the extraction of minerals (non – ferrous metals in the first and natural gas-in the second region).
In all subjects of the district, except St. Petersburg, for ten years there was a decrease in capital productivity. The maximum decline is typical for the Nenets Autonomous Okrug, namely from 0.22 in 2006 to 0.15 in 2016.this indicates the instability of the regional economy, the decline in industrial production, the inability to withstand internal crises (Fig. 1).
Figure 1
The dynamics of capital productivity across regions NWFS
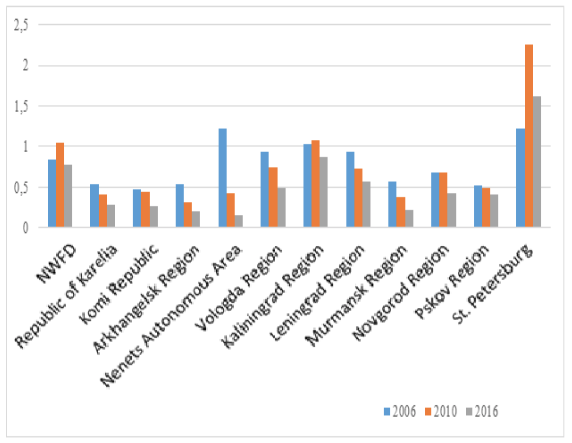
Thus, the city of St. Petersburg and the Kaliningrad region have a high production potential. Low potential was formed in Novgorod and Pskov regions.
The district is inferior to the Central Federal district in terms of shipped goods of its own production in the manufacturing sector (20.36%), produces 15% of the country's GRP, it contains about 14% of fixed assets. The district provides 16% of tax revenues to the budget of the Russian Federation, 11% fall on exports [1].
The locomotive of the district's economy is the Republic of Tatarstan, where large investment and innovative pilot projects are implemented, modern oil and gas production, chemical industry, competitive engineering are developing. The region leads in terms of GRP per capita. Among the subjects of the Russian Federation is characterized by a high level of innovation of the economy.
A network of technoparks is actively developing in the Republic of Tatarstan. JSC "innovation and production Technopark "Idea", industrial site KIP "Master", IT-Park, Technopolis "Himgrad", special economic zone of industrial and production type "Alabuga"successfully operate[3].
In the regional context, the leading subjects of the district, in addition to the Republic of Tatarstan, GRP, industrial production index are the Republic of Bashkortostan, Samara, Nizhny Novgorod, Orenburg region and Perm region. The economy of these regions is United by the fuel and energy complex, oil refining, chemical and petrochemical industries, engineering, forestry.
Value of fixed assets. In six of the fourteen regions of the Volga Federal district (PFO) the cost of fixed assets exceeds RUB 2 billion, the highest in the Republic of Tatarstan – RUB 4.3 billion, representing 16.8% of the figure for the district. Among the leading subjects of the Volga Federal district, almost a quarter of the value of funds falls on the types of economic activity "Transport and communication": the maximum in the Perm region (46.7%), at least in the Republic of Tatarstan (14.7%). The district is distinguished by a favorable transport position used in the Russian Federation as transit traffic in the West – East direction. The existing equipment in this area can not be used without constant modernization, which determines its high cost. On average, this area of activity accounts for almost a third of the value of fixed assets in the district.
The second area of economic activity is manufacturing, where Nizhny Novgorod (23.6%), Samara region (20.8%) and the Republic of Tatarstan (19.3%) are allocated. In these regions, enterprises of precision and transport engineering, as well as rocket engineering, are traditionally developing, in which Russia occupies a leading position in the world.
The following is the position of the activity "Extraction of minerals", released Orenburg oblast (35,9%), which has a wide range of industries from mining ore resources to hydrocarbons. The region ranks 4th in the country among oil-producing entities (4% of oil production in Russia. It accounts for 5% of the gross production of natural gas of export importance.
Depreciation of fixed assets. The General trend of depreciation of fixed assets indicates its constant growth. And in eleven of the fourteen subjects of the Volga Federal district, it exceeds the all-Russian figure (50.2%), and in the Udmurt Republic, Perm Krai, the Republic of Mari El and the Orenburg region exceeds 60%. The exception is the Republic of Tatarstan, where this figure is lower than the all-Russian and is 45.2%.
The highest depreciation of fixed assets in the Volga Federal district is observed in wholesale and retail trade – 79%; the Republic of Mordovia (86.4%) and the Republic of Mari El (85.0%) stand out among the regions. Followed by construction (55,2%); region with the highest level of wear OF allocated Orenburg oblast (69,8%). Mining is the third largest economic activity with high depreciation of fixed assets-54.8%. From the regions can be noted Kirov oblast (72,4%) and the Udmurt Republic (70.2 per cent). More than 50% of depreciation of fixed assets identified in transport and communications: Ulyanovsk region (64.5%) and the Republic of Mari El (63.2%) [1].
The dynamics of the share of investments in fixed capital in GRP in 13 subjects has a negative trend. The maximum decline in the Republics of Mari El (up to 17%) and Udmurtia (up to 16.1%), Nizhny Novgorod and Penza regions. The only region where the positive dynamics for ten years, is the Republic of Tatarstan. In addition, the subject of the Volga Federal district is the leader on this indicator (32.8 per cent). If in the whole district the share of investments in fixed capital in GRP is 23.5%, in addition to this Republic, this level exceeds the republics of Mordovia and Bashkortostan. Thus, the GRP created is less and less related to investments in fixed capital.
In those entities of the Volga Federal district, where there is a relatively high investment in fixed assets in GRP, there is a decrease in depreciation of fixed assets. However, where investments are declining, increasing deterioration of assets. In most regions, the share of investments and depreciation of fixed assets have a similar trend. The Republic of Tatarstan is allocated, where the maximum investment in fixed capital and minimum depreciation of funds. The dynamics of the share of investments in fixed capital in GRP in 13 subjects has a negative trend. The maximum decline in the Republics of Mari El (up to 17%) and Udmurtia (up to 16.1%), Nizhny Novgorod and Penza regions. The only region where the positive dynamics for ten years, is the Republic of Tatarstan. In addition, the subject of the Volga Federal district is the leader on this indicator (32.8 per cent). If in the whole district the share of investments in fixed capital in GRP is 23.5%, in addition to this Republic, this level exceeds the republics of Mordovia and Bashkortostan. Thus, the GRP created is less and less related to investments in fixed capital.
In those entities of the Volga Federal district, where there is a relatively high investment in fixed assets in GRP, there is a decrease in depreciation of fixed assets. However, where investments are declining, increasing deterioration of assets. In most regions, the share of investments and depreciation of fixed assets have a similar trend. The Republic of Tatarstan is allocated, where the maximum investment in fixed capital and minimum depreciation of funds.
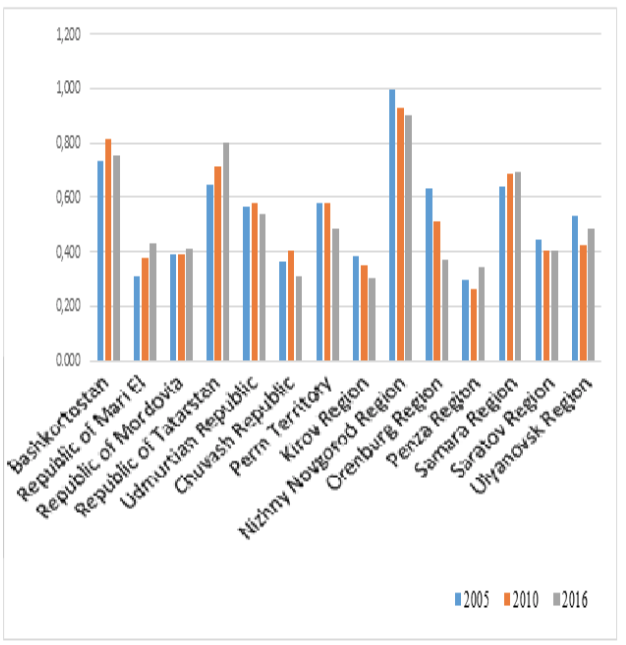
Capital productivity. The economy of the Nizhny Novgorod region shows the highest return on funds, although the diagnosis of the indicator shows a negative dynamics, which corresponds to the instability of the regional economy. Also, a high rate of capital productivity is observed in the republics of Bashkortostan and Tatarstan. If in Bashkortostan the indicator of capital productivity "returned" to the ten-year bar, in Tatarstan, on the contrary, there is a positive dynamics. We can note the Samara region, where a positive trend is revealed, not so significant, but the trend is stable (Fig. 2).
Outsiders are the regions characterized by great instability: the Kirov and Penza regions, the Chuvash Republic, the Republic of Mari El.
Among the main types of economic activities characterized by high capital productivity in the Volga Federal district are wholesale and retail trade, construction and manufacturing.
Figure 2
The dynamics of capital productivity across regions VFD
Penza region shows high efficiency of use of fixed assets in wholesale and retail trade. It is followed by the Republic of Tatarstan and Bashkortostan. More than three times the capital productivity is lower in construction, where the republics of Mordovia, Udmurt and Bashkortostan are allocated. In the processing industries of the Republics of Mordovia, Udmurtia and Bashkortostan, the capital productivity is the highest, higher than in Russia as a whole.
Relative to these regions, the lowest indicators of efficiency of use of fixed assets in the Ulyanovsk and Orenburg regions. The minimum return on assets of enterprises of transport and communications (up in the Samara region).
SFD in terms of area (30%) is second only to the far Eastern Federal district. In terms of the volume of shipped goods of own production, the extractive industries are leading – 15.35% (second only to the Ural Federal district), in the manufacturing sector – about 10%, produces 10.5% of the country's GRP, concentrates about 8.4% of fixed assets, provides 7.4% of tax revenues to the budget of the Russian Federation, 9% of exports [1].
The leader of the district in terms of gross regional product per capita is the Krasnoyarsk territory. On its vast territory (13.8% of the Russian Federation), differentiated by natural and climatic conditions, are unique production in Norilsk (mining and metallurgical plant that produces heavy non-ferrous metals), Krasnoyarsk (non-ferrous metallurgy, energy, engineering), Achinsk (oil refining, in the South of the region developed coal basins, deposits of lead ores. In addition, the Krasnoyarsk territory is a major transport, distribution and transit hub of the Siberian Federal district and the Russian Federation. Access to the Arctic zone of the country gives great potential for economic growth.
The contribution to the economic growth of the region is determined by the following facts: the production of more than 80% of the total Russian Nickel volume (or 20% of world production), more than 70% of copper, about 30% of primary aluminum, almost 98% of platinum group metals. In terms of gold production, the region ranks first in Russia, providing 18% of Russian production, in the all-Russian oil production the region provides 2.5% of oil production and 0.3% of gas production [4], [5].
Large industrial production of the Siberian Federal district (SFD) are located in the Irkutsk region (energy, pulp and paper industry), the Republic of Khakassia (fuel and energy complex, aluminum industry, engineering), Kemerovo region (energy, metallurgy, engineering), Tomsk region (chemical industry, engineering, energy), Novosibirsk region (energy, engineering, non-ferrous metallurgy, chemical).
Value of fixed assets. The resource potential of the territory is reflected in the cost of fixed assets, its structure and dynamics. The highest value of fixed assets in the district falls on the Krasnoyarsk territory (21% of the district), in which among the economic activities are leading areas such as "Mining" (22% of the value of funds in the region) and "Transport and communications" (18%). They are followed by "energy" and "Manufacturing". This structure of the value of fixed assets corresponds to the economic profile of the region, formed under the influence of natural factors and geographical location. The high cost of fixed assets was revealed in Irkutsk and Kemerovo regions. In the first of them, the same types of economic activities are distinguished as in the Krasnoyarsk region, but the "Transport and communication" account for an even higher figure (26%), the "Mining" activity - a smaller one (14%). They are traditionally allocated to manufacturing (13.7%) and energy (13%). In the Kemerovo region the leading position is occupied by mining (24.2%) and transport and communications (18.6%). This is followed by energy (8,9%) and manufacturing (8,4%).
These subjects of the Russian Federation are distinguished by a high share of corporate income tax in the structure of revenues of the consolidated budgets of the subjects of the Siberian Federal district.
Depreciation of fixed assets. Diagnosis of production capacity according to this criterion indicates that in the district in most subjects the dynamics for the period from 2005 to 2016 shows an increase in the degree of depreciation of fixed assets used. The maximum degree of depreciation of fixed assets is typical for the Tomsk region (57.7% while in Russia – 50.2%). This is due to the fact that the region is depleted hydrocarbon deposits due to the development of highly productive layers, there are high costs for the extraction of hard-to-recover reserves, there is a shortage of investment in the extractive sector. The status of a pilot region for working on technologies for the development of hard-to-recover reserves of raw materials is now received by the Tomsk region.
Minimum depreciation of fixed assets was revealed in the Republic of Khakassia (35.3%). The basis of its economy are the largest enterprises of non-ferrous metallurgy: Sayanogorsk, Khakass aluminum plants. Aluminum products account for more than 80% of the region's exports [6, 21].
If we consider the depreciation of fixed assets in the context of the main types of economic activity, it is possible to allocate its maximum value in the manufacturing industries (64%), the minimum value falls on the power industry (21.7%).
In the regional context, it can be noted that in seven of the twelve subjects of the district, the most worn-out are fixed assets in construction, especially the Omsk region, where their share is about 70%.
In second place for depreciation of fixed assets is mining. Despite the diversified nature of industrial production, and now it is based on enterprises and organizations that produce minerals: coal, iron ore, copper-molybdenum ore, gold, aluminum alloys and electricity production. Novosibirsk region is allocated (64.5%), which operates coal, oil, gas, construction materials.
In third place – manufacturing, where the Republic of Khakassia stands out (64%). Then follows "Transport and communication", the leading position is occupied by the Tomsk region (66.2%) and" Production and distribution of electricity, water and gas", the Republic of Tuva (59.5%) [1,10].
Moral and physical depreciation of fixed assets prevents the growth of the quantity and quality of products. Therefore, their radical modernization to overcome the technical and technological backwardness necessary for the production of competitive products becomes more urgent.
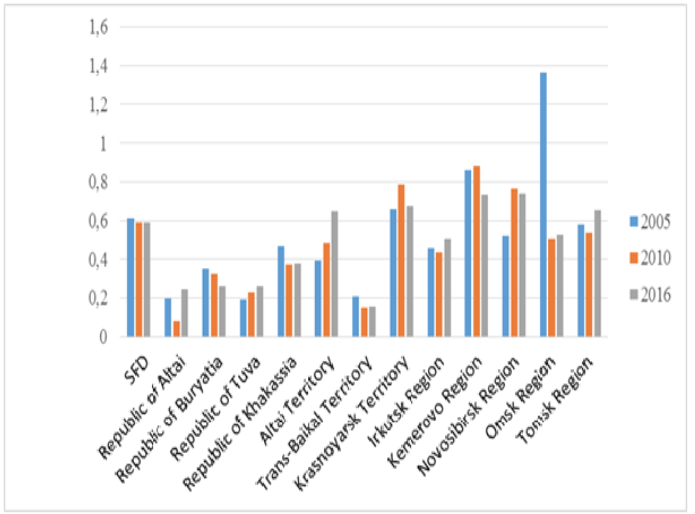
Capital productivity characterizes the efficiency of the use of fixed assets of enterprises in the region. The maximum level of capital productivity has developed in the Kemerovo region, although from 2010 to 2016 it decreased. However, during the period of 2005-2016, capital productivity in this region exceeded the values in the whole of the Russian Federation. This is followed by the Novosibirsk region and the Krasnoyarsk territory, where the efficiency of fixed assets is also reduced.
The lowest return on capital in such a lagging region as the TRANS-Baikal territory, due to the agricultural profile of the economy, the lack of investment in the industrial sector, the low cost of fixed assets (Fig.3).
Figure 3
The dynamics of capital productivity across regions SFD
The most effective use of fixed assets in wholesale and retail trade, and this type of economic activity is allocated in nine subjects of the SFD. But the leading position is occupied by the Tomsk region.
In eight subjects, high capital productivity is observed in the manufacturing industries, the absolute leader is the Republic of Altai. This is followed by "Construction". In this type of economic activity is allocated Tomsk region.
High capital productivity in the construction sector remains, despite the significant depreciation of fixed assets, which may in the short term adversely affect the performance of production.
Thus, these three areas of economic activity show the maximum results of the effective use of fixed assets.
In General, we can distinguish three regions of the SFD, in which there is a high depreciation of fixed assets and high values of capital productivity: Kemerovo, Novosibirsk and Tomsk regions. However, the Krasnoyarsk territory is allocated more significant investments in fixed capital (13th place in Russia), low depreciation of fixed assets (18th place in Russia), the presence of modern production (9th place in Russia at the cost of fixed assets) and, as a result, high capital productivity [15, 16]. The production potential of the Krasnoyarsk region, formed on the basis of a rich resource base, brings the region's economy to a leading position in the district and the country as a whole [14].
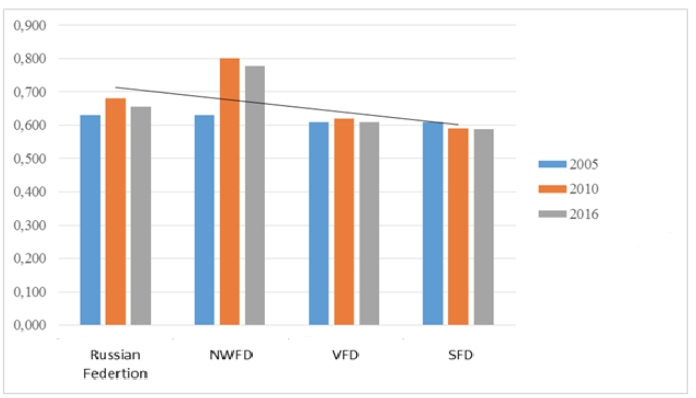
The study revealed General patterns of development of the production potential of macro-regions. They consist in the presence of high production potential in the leading regions with a diversified economy based on different types of resources and the existing economic specialization. These regions have a high rate of return on capital, indicating the effective use of existing productive capacity, as well as significant investment in fixed assets. The dynamics of this indicator shows a relatively low decrease compared to 2010., but the growth compared to 2005. In addition, among the studied macro-regions, the leading value of the North-West and the lag of the Siberian Federal district stands out.
Figure 4
Dynamics of capital productivity of macro-regions and the Russian Federation
High potential opportunities due to the presence of strong production capacity were formed in St. Petersburg and Kaliningrad region (North-Western Federal district), the Republic of Tatarstan and Nizhny Novgorod region (Volga Federal district), Krasnoyarsk region and Kemerovo region (Siberian Federal district).
Differentiation of the production potential of the Federal districts is associated with the peculiarities of their specialization. Thus, the highest depreciation of fixed assets in the North-Western district was found in the extractive industries, the Volga region – in wholesale and retail trade, the Siberian – in the manufacturing industries [17, 18, 19, 20]. These industries are characterized by high value of fixed assets. The highest return on capital is shown in the Volga and Siberian districts of wholesale and retail trade, and in the North-West – manufacturing. This corresponds to the high efficiency of these sectors of the economy in market conditions. In most of the subjects of the first two districts, the return on capital is growing, while in the latter all the subjects are experiencing its decline [11, 12, 13]. Volga Federal district is characterized by the presence of the maximum number of subjects (six of fourteen) with the high cost of fixed assets, whereas the other two only three. Transport and communication in all three macro-regions is characterized by high cost of fixed assets, which indirectly indicates the renewal of equipment in the context of the implementation of major infrastructure projects in recent years [7, 8, 9].
The main factors of sustainability of the economies of the regions are advantageous transport-geographical position in the North-Western and Volga Federal districts, the presence of rich natural resources in the Siberian Federal district. The economic potential of all three macro-regions is a starting point for the formation of a favorable investment climate.
The General negative factors hindering the development of productive capacity include the growing depreciation of fixed assets, the decline in fixed capital investments in most of the subjects of the studied macro-regions and, accordingly, the gross regional product created increasingly due to the export raw material potential.
1. Federal state statistics service of the Russian Federation. Region of Russia. Socio-economic indicators-2017-2018: http://www.gks.ru
2. Official portal of the Republic of Tatarstan: http://tatarstan.ru/about/economy.htm
3. Union "Central Siberian chamber of Commerce and industry". Features of the region's economy. https://krasnoyarsk.tpprf.ru/ru/region/economy/
4. Krasnoyarsk region. Investment portal. http://krskinvest.ru/pages/ehkonomika
5. Investment portal of the Siberian Federal district: http://invsib.ru/hakas/informaciya-o-prioritetnyh-otraslyah-i-sferah-ekonomiki-respubliki-hakasiya/
6. Akhmadeev, B.; Manakhov, S. 2015 Effective and sustainable cooperation between start-ups, venture investors, and corporations, Journal of Security and Sustainability Issues 5(2): 269–285. DOI: http://dx.doi.org/10.9770/jssi.2015.5.2(12)
7. Gretchenko A.A., Gretchenko A.I., Demenko O.G., Gorokhova I.V. (2017) Fostering innovative integrated structures in russian higher education institutions. Revista ESPACIOS. Vol. 38 (Nº 40) Año 2017. Pág. 15
8. Gretchenko A.I.; Nikitskaya E.F.; Valishvili M.A.; Gretchenko A.A. (2018) Role of higher education institutions in developing hr potential in a forming innovation economy. Revista ESPACIOS. Vol. 39 (№ 21) Year 2018. Page 13
9. Gretchenko A.I., Nikitskaya E.F., Gretchenko A.A., Demenko O.G. Methodological aspects of forecasting skilled labor in context of innovation transformations (Of the Russian economy) (2018) Journal of Advanced Research in Law and Economics, 9 (2) , pp. 489-500
10. Konysheva M.V. Gumanitarny`e aspekty` sovremennoj promy`shlennoj politiki Rossii//Nauka i praktika. 2017. № 2 (26). S. 43-47.
11. Litvinova A.V. Sociokul`turny`e determinanty` orientacii podrostkov na subkul`tury`. Psixologicheskaya nauka i obrazovanie www.psyedu.ru. 2014. № 1. S. 37-46. 12. Moiseev, N.A., Manakhov, S.V., Demenko, O.G. Boosting regional competitiveness level via budgetary policy optimization. International Journal of Applied Business and Economic Research 14(10), 2016, s. 7315-7324
13. Moiseev, N.A., Demenko, O.G., Savina N.P. Computation of reliable interval forecast for dynamic averaging of economic time series regression models. International Journal of Civil Engineering & Technology (IJCIET) - Scopus Indexed.Volume:10, Issue:2, Pages:1594-1602.
14. Oveshnikova, L., Sibirskaya, E., Kulikova, S., Bezrukov, A. Statistical study of innovative activity in high-tech spheres of economy // Perspectives on the Use of New Information and Communication Technology (ICT) in the Modern Economy. (Editors (view affiliations) Elena G. Popkova Victoria N. Ostrovskaya) Part of the Advances in Intelligent Systems and Computing book series (AISC, volume 726)/ - PP. 80- 86
15. Savina N.P. Osobennosti konkurentnoj bor`by` v mirovoj otrasli nefti. // Rossijskij e`konomicheskij internet-zhurnal. – 2013. № 4. S. 51.
16. Savina N.P. Rossiya i mirovoj ry`nok nefti. // Rossijskoe predprinimatel`stvo. – 2014. № 13 (259). S. 102-113.
17. Senotrusova S., Svinukhov V., Vavilova E., Makarova I., Demenko O. Economic consequences of Russian embargo on meat and meat products (2018) WSEAS Transactions on Business and Economics, 15 , pp.93-98.
18. Sibirskaya, E., Khokhlova, O., Oveshnikova, L., Stroeva, O. The innovative and technological developments acceleration of Russia (The modern stage) // Asian Social Science. 2015. Т. 11. № 20. PP. 97-103.
19. Sibirskaya, E., Stroeva, O. Khokhlova, O., Oveshnikova, L. An analysis of investment-innovation activity in Russia // Life Science Journal, 2014; 11(7s). – P. 155 – 158.
20. Zuev, V.M., Manakhov, S.V., Gagiev, N.N., Demenko, O.G. Problems and prospects of convergence of Higher Education Systems in countries of the Eurasian Economic Union. Espacios 39 (29) 2018
1. PhD in Economics, Associate professor, Plekhanov Russian University of Economics, arkhipova.ls@rea.ru
2. PhD in Economics, Associate professor, Plekhanov Russian University of Economics, iri12411@yandex.ru
3. Deputy Director at “New Economy and Business” Research Institute, Plekhanov Russian University of Economics, demenko.og@rea.ru