![]() ISSN 0798 1015
ISSN 0798 1015

![]() ISSN 0798 1015
ISSN 0798 1015
Vol. 40 (Number 22) Year 2019. Page 22
KOROTCHENYA, Valery 1
Received: 02/04/2019 • Approved: 17/06/2019 • Published 01/07/2019
ABSTRACT: In this article, in order to study the prospects for the development of digital agriculture in Russia, the technical efficiency of the Russian agriculture within the local group of the Commonwealth of Independent States (CIS) is explored. As well as the technological gap is investigated in agricultural production in relation to countries with developed economies. On the basis of data for the period of 2000-2015, it was established that Russia has exhausted the potential of its own technologies (since the efficiency of its agriculture in the CIS is 100%), and it needs a transition to digital agriculture. The potential increase in efficiency in the transition to new technologies is 5 times. However, this will require a significant reduction in farmland and employment and, at the same time, a significant increase in investment in agricultural capital. It is proposed to use the level of efficiency of Canada, which is similar in climatic conditions to Russia, as a target efficiency increase (twice as compared with 2014 and 2015). However, even in this case, a reduction in farmland and employment and a capital increase will be necessary (and the target level of output must be taken into account). Due to the complexity of social problems, an integrated approach to the development of digital agriculture in Russia is proposed to be used within the framework of the concept of sustainable agriculture. It is also proposed to change the policy regarding state support for agriculture: the volume of increase in state support for the formation of fixed capital. |
RESUMEN: En este artículo, para estudiar las perspectivas del desarrollo de la agricultura digital en Rusia, se explora la eficiencia técnica de la agricultura rusa dentro del grupo local de la CEI. Además, se investiga la brecha tecnológica en la producción agrícola en relación con los países con economías desarrolladas. Sobre la base de los datos del período 2000-2015, se estableció que Rusia ha agotado el potencial de sus propias tecnologías (ya que la eficiencia de su agricultura en la CEI es del 100%), y necesita una transición a la agricultura digital. El aumento potencial de eficiencia en la transición a nuevas tecnologías es 5 veces. Sin embargo, esto requerirá una reducción significativa en las tierras agrícolas y el empleo, y al mismo tiempo un aumento significativo en la inversión en capital agrícola. Se propone utilizar el nivel de eficiencia de Canadá, que es similar en condiciones climáticas a Rusia, como un aumento de la eficiencia objetivo (dos veces en comparación con 2014 y 2015). Sin embargo, incluso en este caso, será necesaria una reducción en las tierras de cultivo y el empleo y un aumento de capital (y se debe tener en cuenta el nivel objetivo de producción). Debido a la complejidad de los problemas sociales, se propone un enfoque integrado para el desarrollo de la agricultura digital en Rusia dentro del marco del concepto de agricultura sostenible. También se propone cambiar la política con respecto al apoyo estatal a la agricultura: el volumen de aumento en el apoyo estatal para la formación de capital fijo. |

To formulate a definition of the concept of digital agriculture, let us designate the stages of agricultural development. For example, the European Association of Agricultural Engineering CEMA offers the following periodization in the development of agriculture (starting from the 20th century) in terms of the technologies and technical means used (CEMA, 2017).
Agriculture 1.0 is agriculture based on the use of manual labor (low productivity, early 20th century). Agriculture 2.0 is the so-called “Green Revolution” (late 1950s), when fertilizers, pesticides, and agricultural machinery began to be actively used. Agriculture 3.0 is precision agriculture (1990s and 2000s). Agriculture 4.0 is digital agriculture (early 2010s; the term “smart agriculture” can also be used). The widespread use of digital technologies and technical means in agricultural production (low-cost and improved sensors and actuators, microprocessors, broadband digital cellular communications, cloud computing, big data analysis methods, etc.) made it possible to bring exact agriculture to a new level when information on all agricultural processes and operations exist in digital form, and at the same time the transfer, processing and analysis of data is mainly automated. Agriculture 5.0 will be based on robotics and artificial intelligence, opening the way to an autonomous decision-making system and performing operations without human intervention.
To facilitate the formulation of the definition of digital agriculture, in Table 1 we also present the classification of digital agriculture technologies (it should be noted that in this study the concepts of “digital agriculture” and “smart agriculture” are synonymous).
Table 1
Classification of digital agriculture technology
Technology group |
Technologies |
Data collection technologies |
Global satellite navigation systems used for driving, mapping, etc. |
Mapping technologies (field topography, soil supply with nutrients, yield) |
|
Technologies for obtaining information on the properties of vegetation and soil (based on cameras and sensors), working with big data |
|
Machines and software for data collection technologies (tractors using the international ISOBUS protocol, unmanned aerial vehicles, unmanned ground vehicles, information systems for managing an agricultural enterprise, software for monitoring and forecasting yields, etc.) |
|
Data transmission technology |
Mobile connection |
LPWAN communication |
|
Internet (wireless, broadband) |
|
Data analysis and evaluation technologies |
Data analysis techniques to isolate homogeneous zones within the field |
Decision support systems |
|
Agricultural enterprise information management systems |
|
Work with big data, cloud computing |
|
Precision application technologies |
Driving technologies (controlled movement on the field, auto piloting) |
Technologies of differentiated use (differential application of mineral, organic, lime fertilizers, chemical plant protection products, differentiated sowing, accurate physical destruction of weeds, precise irrigation, etc.) |
|
Complex solutions (can combine previous technology groups) |
Technical vision |
Internet of things |
|
Robots |
|
Unmanned aerial vehicles, unmanned ground vehicles |
|
Artificial Intelligence |
|
Technologies in the field of agricultural economics |
Blockchain |
Source: adapted on the basis of (Pedersen & Lind, 2017)
Taking into account the periodization of agricultural development adopted here and the presented classification of digital agriculture technologies, the following expanded definition of digital agriculture can be given (as a combination of agriculture 4.0 and 5.0): digital agriculture is an approach to agriculture, according to which the execution of technological operations in agriculture production is carried out using a computer (artificial intelligence). A computer, through agricultural and other machines connected to it, independently or with minimal human participation, collect, transmit and analyze relevant data, as well as make optimal (accurate) decisions, implement, and control them.
This definition is futuristic because it has not yet realized form. Only individual elements are implemented in a more simplified form. However, in our opinion, everything goes to the fact that agricultural production will be carried out using artificial intelligence and the machine complex connected to it. If in the past and present the tractor and combine are the main agricultural machines, in the future the computer will become such (artificial intelligence).
Currently, in the advanced economies, both traditional (agriculture 2.0 in the most advanced form) and innovative machine technologies (presented by agriculture 4.0) are at the core of agriculture. Agriculture 5.0 is still in its infancy. Agriculture 3.0 is, in fact, the beginning of digital agriculture; therefore, it represents an intermediate stage, because it makes no sense to speak of it as one of the alternatives for the development of modern agriculture.
The reality is that digital farming technologies are too expensive even for the United States. The development of agriculture 4.0 is in line with the megatrends of the influence of digital technologies on the development of the economy and society (OECD, 2016). Digital equipment and software prices will gradually decline, making agriculture 4.0 more affordable and common worldwide.
Based on data for the years 1996-2013, the US Department of Agriculture (Schimmelpfennig, 2016) examined the profitability of using individual technologies of precision farming (which are an integral part of digital agriculture). In general, the exact technologies increase the profit of the enterprise rather by a small amount. So, for a mid-sized American farm that grows corn, the increase in profits is as follows:
The first group of these technologies is the most common: for example, in 2010, almost half of the farms in the United States that grow corn and represent 70% of the total area under maize, used yield monitors when harvesting corn (Schimmelpfennig, 2016). In turn, the technology of differentiated use is not so popular: in the same 2010, almost 20% of farms growing corn used these technologies, which accounted for less than 30% of the total area under corn (Schimmelpfennig, 2016).
Precise farming technologies remain very expensive, and their use increases in direct proportion to the size of the farm's crop area (Schimmelpfennig, 2016). When they say that Russia lacks agricultural equipment, which has been declining since the collapse of the USSR, in fact this means that our problems with reducing the machine and tractor fleet lie in the plane of agriculture 2.0.
As one knows, the development is now under the “Digital (smart) agriculture” subprogram in the framework of the Federal Scientific and Technical Program for the Development of Agriculture for 2017-2025 (approved by Government Decree of August 25, 2017 No. 996, as amended).
At present, the feasibility of developing digital agricultural technologies in Russia is based, in our opinion, not only on the desire to increase the efficiency of agricultural production, but also on the need to reduce the technological gap between Russia and Western countries and thus provide a reserve in the field of digital agriculture.
Evaluation of the effectiveness of agriculture in Russia and the technological gap between Russia and the countries with developed economies in the field of agricultural production is the goal of this article. The paper also aims to formulate recommendations regarding the formation of digital agriculture in our country. For this, we will use the methodology of data envelopment analysis, DEA (Cooper et al., 2011), which is a non-parametric method based on linear programming for determining the boundary of production capabilities within the “resource-release” data for a group of decision units performing similar production activities.
The essence of the DEA method consists in evaluating the effectiveness of homogeneous decision-making units based on the construction of a common production capacity limit based on real data (resources and output types). At the same time, real points on this boundary (as a rule, hypersurfaces), which are specific manufacturers, are complemented by points equal to convex combinations of the first. Augmented points on the border of production capabilities and all points below it are considered technologically achievable, thereby forming a technological set. In general, manufacturers located at the frontier of production capabilities are considered technically efficient (technical efficiency is 1 or 100%), and it is ineffective below. The calculation of the technical efficiency of a certain manufacturer is carried out using the projection of its position in the resource-release coordinates on the border of production capabilities (when fixing, for example, the amount of resources expended by it), where technical efficiency is equal to 1 or 100%. The point of this projection is the position of the reference manufacturer in relation to the first. The reference producer is a Pareto-effective real or virtual decision-making unit, located on the border of production capabilities, against which the technical efficiency of the first manufacturer is measured.
Since its inception in 1978 (Charnes, Cooper & Rhodes, 1978), the DEA has gradually gained its immense popularity among scientists and professionals engaged in the study of production efficiency. The bibliography of the published English-language scientific literature on the DEA for the 40 years of its existence contains 10 300 articles (Emrouznejad & Yang, 2018)
The DEA methodology allows one to calculate the efficiency of decision-making units even if the prices of the resources used and the prices of the products are unknown, as in our study. In this case, efficiency is called technical. And if pricing information is available, it is possible to calculate the economic efficiency.
Since we are interested not only in the efficiency of agricultural production but also in the technological gap, we will use the meta-boundary approach (O’Donnell et al., 2008): the general sample of countries consists of groups, each of which represents a local technology of agricultural production; based on the DEA model, the local boundaries of production capabilities are calculated, which envelops the local boundaries and is a meta-technology; then the technological gap values are calculated between the local boundaries and the meta-border for each country (O’Donnell et al., 2008). We will supplement the values of the technological gap with the values of technical efficiency calculated within the framework of local groups and analyze these two indicators together.
We present a formula for calculating the technological gap (O’Donnell et al., 2008).
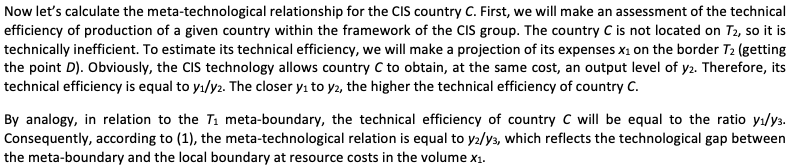
Figure 1
Geometric interpretation of the concepts of
meta-technological relationship and technical efficiency

For the purpose of this study, a non-oriented dynamic SBM model with constant returns to scale is used as a specific type of DEA model (Tone & Tsutsui, 2010).
The preference for the (non-radial) SBM model over the (radial) CCR model (Charnes, Cooper & Rhodes, 1978), one of the possible options for studying effectiveness, was made for a number of reasons. First, the performance indicators calculated using the SBM model take into account, unlike the CCR, all reserves of performance improvement (slacks). Second, the loss of proportionality between the initial position of the decision-making unit and its projection is not critical in the case of using aggregated data at the country level. Third, the SBM model has both a static (Tone, 2001) and a dynamic (Tone & Tsutsui, 2010) variety, while the CCR is static. Finally, there is a close relationship between the static SBM and CCR models: a decision unit is effective according to the CCR methodology if and only if it is effective using the SBM model.
The choice of constant returns to scale in the SBM model is justified by the fact that the data used for the model are aggregated at the level of economies, and it makes no sense to talk about economies of scale (the limit of production possibilities is not built for enterprises, but for countries that sum up enterprises of different scales).
The use of the non-oriented SBM model is dictated by the fact that it is more expedient to study the efficiency of economies simultaneously from the point of view of both reducing the use of resources and increasing production (in two directions), especially since the SBM was originally formulated as non-oriented. It is in the general view that as a non-oriented, this model better conveys the concept of efficiency (Cooper, Seiford & Tone, 2007).
The unoriented dynamic SBM model with constant returns to scale used in this study for calculating the efficiency of agriculture in countries has the following form (hereinafter, it is used for calculations in formula (1) – the calculation of technical efficiency within local groups and the technological gap with respect to the meta-boundary):
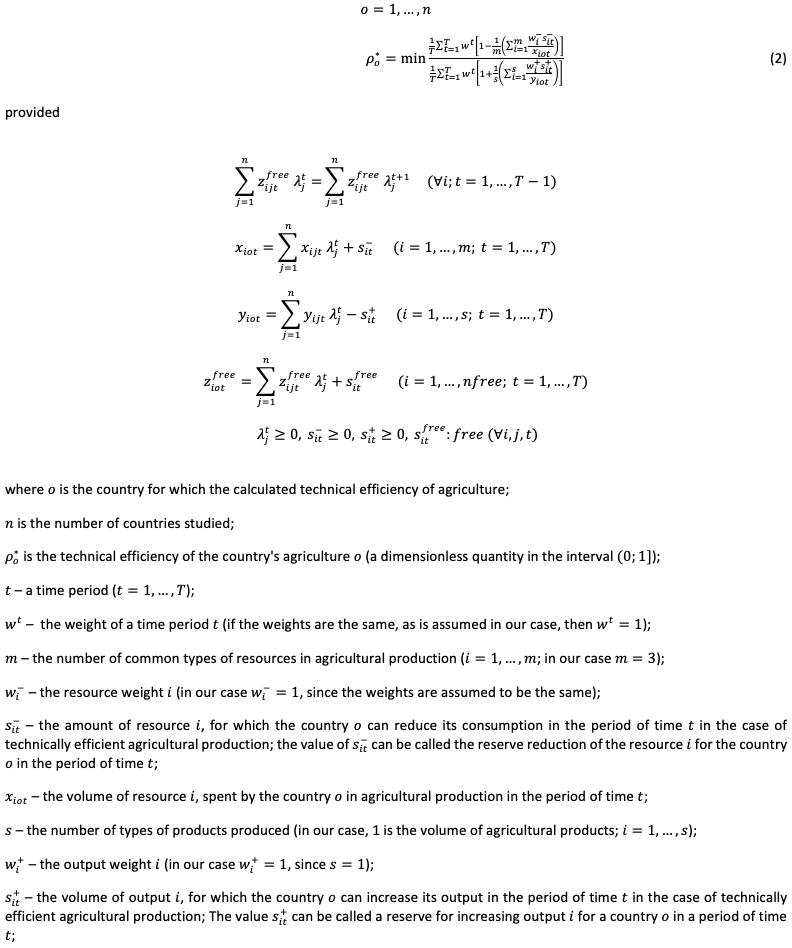
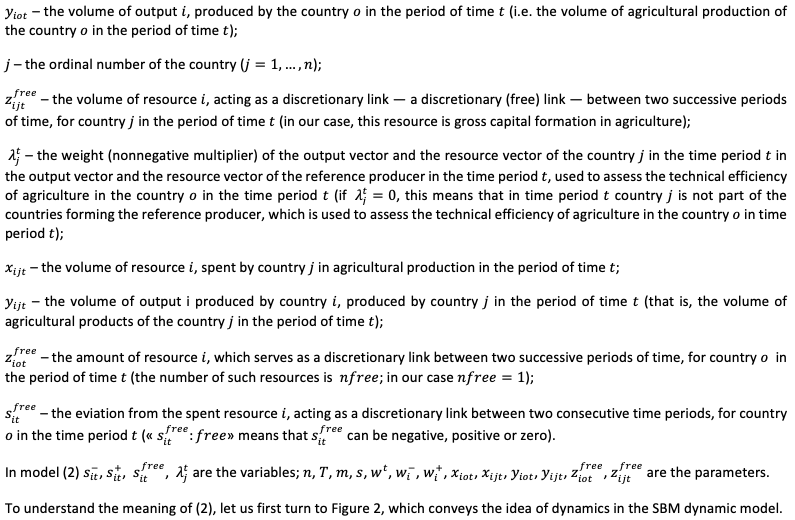
Figure 2
The structure of the SBM dynamic model
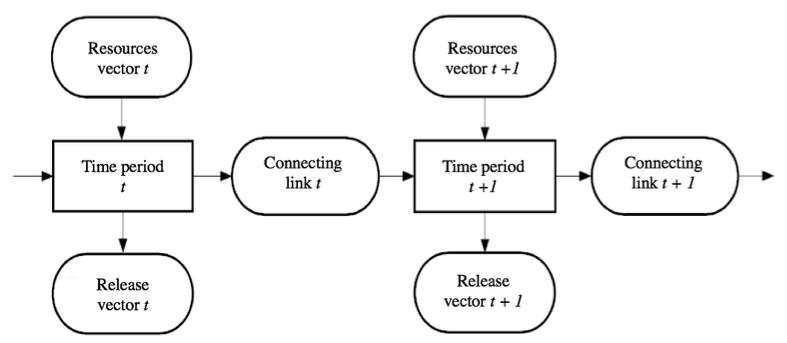
A desirable (good) link is, for example, the retained earnings of the current period, transferred to the next (regarded as a release). In turn, the carryover loss of the current period is an undesirable (bad) link and acts as a resource in the model.
The difference between discretionary and non-discretionary links is that the first implies that a decision unit can increase or decrease its value relative to the observed level; on the other hand, a non-discretionary link means that the decision unit does not control the value of the link, and it is taken as fixed at the level of the actual value.
See more details in (Tone & Tsutsui, 2010).
In our case, agricultural capital (gross fixed capital formation in agriculture) is considered as a link, since capital investments are made to generate income not so much in the current period but in the long term. He is the discretionary link. This is due to the fact that the country can increase or decrease its volume, which is in the introduction of business entities and the state that can affect the volume of investments, including the inflow or outflow of agricultural capital (to the country / from the country).
The optimization task in (2) is repeated for each country (o=1,…,n).
See more details in (Tone & Tsutsui, 2010).
In this study, the efficiency of agriculture is calculated for 45 countries, divided into two local groups: the CIS and advanced economies. The status of a country with a developed economy was determined according to the standard list of the IMF. The composition of local groups is as follows.
The CIS: Azerbaijan, Armenia, Belarus, Georgia, Kazakhstan, Kyrgyzstan, Moldova, Russia, Tajikistan, Uzbekistan, Ukraine (11 countries; not all data are available for Turkmenistan).
The developed economies: Australia, Austria, Belgium, Great Britain, Germany, Greece, Denmark, Israel, Ireland, Iceland, Spain, Italy, Canada, Cyprus, Latvia, Lithuania, Luxembourg, Malta, the Netherlands, New Zealand, Norway, Portugal, Singapore, Slovakia, Slovenia, USA, Finland, France, Czech Republic, Switzerland, Sweden, Estonia, South Korea, Japan (34 countries).
Of the countries represented, we are interested, of course, in Russia: it is necessary to obtain calculations of the efficiency of agriculture in our country within the local group of the CIS, as well as the values of the technological gap in relation to the meta-boundary, which due to economic superiority will be determined by the countries with developed economies.
As a target level of the meta-technological relationship for Russia, it is proposed to use the values of technical efficiency of agriculture in Canada within the local group of countries with developed economies. The choice of Canada is justified by the same geographical latitudes, which determine the similarity of the climatic conditions of Russia and Canada, as well as the best relative comparability of the area of their farmland (as the second argument).
The time period of the study: 2000-2015.
Agricultural land (their area); the number of people employed in the field of agriculture, fertilizers (the mass of the nutrient introduced (N + P2O5 + K2O) are used as common resources).
Gross fixed capital formation in agriculture (here FAO also included forestry and fisheries) in constant 2005 US dollars acts as a discretionary link.
The output is represented by the volume of agricultural products on a net basis (that is, excluding intermediate products – seeds and feed) in constant international dollars (base: 2004-2006).
Data sources: FAOSTAT, ILOSTAT; previously saved data from the FAOSTAT database (in a small volume) are also used.
All calculations are performed using the MaxDEA 7 program.
The results of calculations of the model (1) and (2) with respect to Russia are presented in Figure 3.
We also note that Belgium, Malta, the Netherlands, and Singapore are the leading countries in terms of agricultural efficiency. Their technical efficiency and technological gap are equal to 1 during the whole considered period of time.
The Figure 3 clearly shows that the potential of Russian technologies (the CIS countries) has exhausted itself: in the CIS group, Russia has a single efficiency, but the technological gap is relatively large, and it shrinks rather slowly. Russia needs a transition to agricultural technology 4.0 (digital agriculture). With the transition to new technologies, the target level (Canada) requires a twofold increase in efficiency. Further growth is possible (according to the results obtained, i.e. up to 5 times compared with 2014-2015). Many advanced economies lag far behind leading countries such as Belgium and the Netherlands. Therefore, growth reserves are very large.
The necessary fee for increasing the efficiency of agricultural production in our country is, as shown by the DEA model used here, a significant reduction in agricultural land and employment and, at the same time, a significant increase in investment in agricultural capital: how many times it depends on the target level of output and the target level of efficiency in the meta-technology. So, if we imagine that Russia would be as effective as the Netherlands, then in 2014 our country would only need about 3% of the area of farmland, about 13% of employed, about 47% of fertilizers, but 7 times more investment in agricultural capital – from the actual values of 2014 (in fact, the calculations of the required growth of investments in capital are somewhat more complicated, since capital is a link between two successive periods; but here it can be neglected due to almost equal values of the growth of investment in capital at the beginning and end of 2014).
If the target level of efficiency in the framework of metatology is taken, as was supposed above, at the level of Canada, then the necessary change in the volume of resources for our country will be as follows (also based on data for 2014): the area of farmland will only need to be reduced by 2 times; 13% of employees will be needed, as in the case of target efficiency at the Netherlands level; growth of investments in agricultural capital will be required by 2.8 times; the results of the model calculation also require an increase in the amount of fertilizer applied by 3.4 times, but if the actual amount of fertilizer application can be maintained, the level of efficiency in the framework of meta-technology for Russia will exceed the level of Canada and even Germany.
Figure 3
Study results for Russia: the value of the technical efficiency of agricultural
production and technological gap (meta-technological relationship)
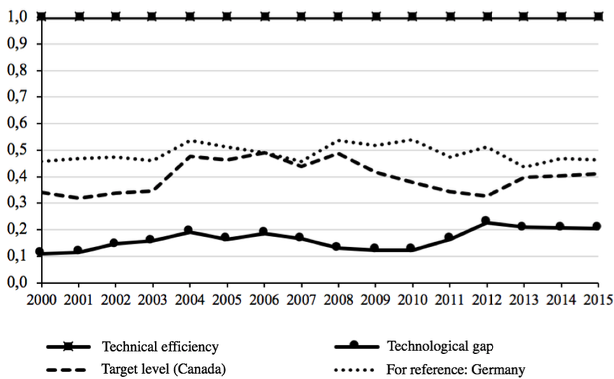
The technical efficiency of agriculture in Russia was calculated within the framework of the CIS countries, and the technological gap between Russia and the countries with developed economies. The target level is the minimum preferred level of the meta-technological relationship for Russia, based on the values of the technical efficiency of agriculture in Canada within the local group of countries with developed economies (the meta-technological ratio for Canada is equal to 1 within the considered time interval). The values of technical efficiency of agriculture in Germany are given for reference (the meta-technological relation for it, like Canada, is equal to 1).
The target value of the output of agricultural products in Russia can also be increased, and the necessary volumes of resources used will change accordingly. In general, increasing efficiency in agriculture in Russia requires a reduction in the area of farmland and the labor used, while at the same time increasing the volume of capital. Since these changes are very large – measured by the number of times – drastic reforms in the agriculture of our country are impossible and impractical. Shock therapy is not socially justified.
Problems in the Russian agriculture are typical for all developing countries: excessive labor resources, lack of capital, low production efficiency, low level of technologies used. Table 2 shows the structure of employment by sectors of the economy in Russia and some countries with developed economies in 2017, according to which for Russia in the long term reduction of employment in agriculture by 3-4 times is desirable (and say, a corresponding increase in employment in the service sector).
Table 2
Distribution of employment by sector in Russia and a
number of countries with developed economies in 2017, %
A country |
Agriculture |
Industry |
Services |
Total |
Russia |
6.7 |
26.9 |
66.4 |
100.0 |
Netherlands |
2.2 |
16.5 |
81.3 |
100.0 |
Canada |
2.0 |
19.6 |
78.4 |
100.0 |
USA |
1.7 |
18.9 |
79.5 |
100.0 |
Germany |
1.3 |
27.3 |
71.5 |
100.0 |
A source: ILOSTAT
Since even in developed countries, modern agriculture is a combination of high and traditional technologies, it would be wrong, in our opinion, to place an overly strong emphasis on the development of digital agriculture in Russia. Otherwise, the rapid development of some agricultural enterprises (regions) and the degradation of others may occur. A more justified approach is a balanced development: for the most advanced enterprises (regions), digital technologies can be targeted, and for everyone else, traditional technologies in the most developed form. In either case, the role of the state should be key. The main instrument of regulation is the policy of state support for agriculture.
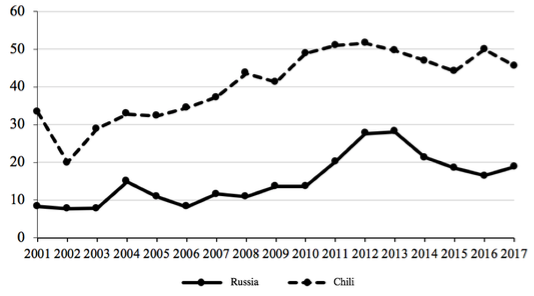
According to the OECD (2018) in 2015-2017, most of the support of the agricultural producer (74%) was the most distorting market conditions for assistance: support for the market price, payments for goods produced, support based on the use of working capital. In turn, support for agriculture based on the formation of fixed capital in our country is rather low. The Figure 4 shows the dynamics of state support on the basis of the formation of fixed capital to the total amount of assessment of support for agricultural producers in Russia and Chile (Chile is considered as an alternative to the current policy of state support for agriculture in our country).
A reasonable proposal arises: if in Russia there is a problem with a lack of agricultural capital (including the well-known reduction of the machine and tractor fleet), then why not borrow the experience of Chile, where up to half of the state support goes to the formation of fixed capital?
Comprehensive measures are needed, which would systematically solve the diversity of agricultural problems in our country. In our opinion, the concept of sustainable agriculture should be a strategic approach to the formation of a holistic vision of digital agriculture. Sustainable development means “meeting the needs of the current generation without threatening the ability of future generations to meet their own needs” (UN General Assembly, 1987).
Figure 4
The ratio of state support on the basis of the formation of fixed capital to the total
assessment of the support of the agricultural producer in Russia and Chile, %
For digital agriculture, sustainable development requires reconciliation of contradictions while at the same time achieving economic, social and environmental goals:
- Increased economic efficiency due to the introduction of digital agricultural technologies should lead to an increase in social efficiency, contributing to poverty reduction and increasing well-being and social opportunities (especially in rural areas);
- Digitization of agriculture should go hand in hand with preserving a healthy ecosystem and biodiversity, as well as the careful use of natural resources;
- Digital agriculture needs to be resilient to climate change and at the same time not conducive to changing it.
It is a systematic approach to the development of digital agriculture that could lead to the creation in Russia of a highly efficient agricultural sector in every sense.
The present study allows us to draw the following conclusions:
Due to a single efficiency within the CIS countries and a large technological gap relative to developed countries for a long time (based on data from 2000-2015), the potential of agricultural technologies in Russia has exhausted itself. Consequently, Russia needs a transition to agricultural technologies 4.0 (digital agriculture);
The transition to digital agriculture technology due to the increase in the efficiency of agricultural production will require a significant reduction in agricultural land and employment in the agricultural sector and a significant increase in investment in agricultural capital;
In order to prevent enormous social costs, the formation of digital agriculture should be carried out using a set of measures for the transition to new technologies (we propose to consider digital agriculture in the framework of the sustainable development paradigm. We also consider it necessary to increase the amount of state support for agriculture in the formation of fixed capital, since digital agriculture requires large investments);
Due to the similarity of the climatic conditions of Russia and Canada, we propose to use the technical efficiency level of Canada as a target level for our country, which, although not a leader in agricultural production efficiency, can serve as the first benchmark for a twofold increase in efficiency (the potential increase in efficiency relative to 2014 and 2015 is 5 times); such a soft transition can also smooth out the social costs of introducing more advanced technologies.
CEMA (2017). European Agricultural Machinery. Retrieved from http://cema-agri.org/sites/default/files/CEMA_Digital%20Farming%20-%20Agriculture%204.0_%2013%2002%202017.pdf.
Charnes, A., Cooper, W. W. & Rhodes, E. (1978). EJOR, 2, 429-444
Cooper, W. W., Seiford, L. M. & Tone, K. (2007). Data Envelopment Analysis: A Comprehensive Text with Models, Applications, References and DEA-Solver Software. New York, NY: Springer.
Cooper, W. W., Seiford, L. M. & Zhu, J. (Eds.) (2011). Handbook on Data Envelopment Analysis. New York, NY: Springer.
Emrouznejad, A. & Yang G.-L. (2018). Socio-Econ. Plan. Sci., 61, 4-8
O’Donnell, J., Rao, D. S. P. & Battese, G. E. (2008). Empir Econ, 34, 231-255
OECD (2016). Science, Technology and Innovation Outlook. Paris, France: OECD Publishing.
OECD (2018). Agricultural Policy Monitoring and Evaluation 2018. Paris, France: OECD Publishing.
Pedersen, S. M., & Lind K. M. (Eds.) (2017). Precision Agriculture: Technology and Economic Perspectives. Springer, Cham.
Schimmelpfennig, D. (2016). Farm Profits and Adoption of Precision Agriculture. Washington, DC: United States Department of Agriculture.
Tone, K. & Tsutsui, M. (2010). Omega, 38, 145-156
Tone, K., (2001). EJOR, 130, 498-509
UN General Assembly (1987). UN General Assembly resolution 42/187 of December 11, 1987 “Report of the International Commission on Environment and Development”. Retrieved from http://www.un.org/en/ga/search/view_doc.asp?symbol=A/RES/42/
187&referer=http://www.un.org/depts/dhl/resguide/r42_en.shtml&Lang=R
1. Federal Scientific Agroengineering Center VIM, 5 1st Institutsky proezd, Moscow 109428 Russia. E-mail: valor99@gmail.com