![]() ISSN 0798 1015
ISSN 0798 1015

![]() ISSN 0798 1015
ISSN 0798 1015
Vol. 40 (Number 25) Year 2019. Page 18
ARINICHEV, Igor V. 1; ARINCIHEVA, Irina V. 2; MATVEEVA, Ludmila G. 3 & DARMILOVA, Zhenny D. 4
Received: 08/04/2019 • Approved: 11/07/2019 • Published 22/07/2019
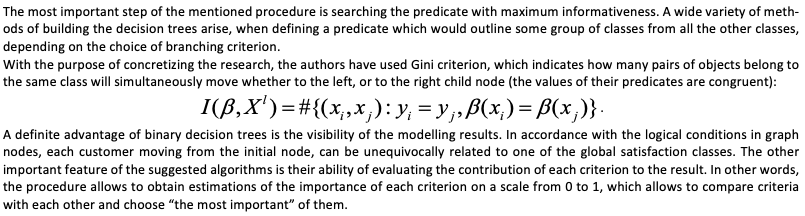
2. Basic methodological approaches
ABSTRACT: This article presents the original approach to the assessment of global customer satisfaction of business organizations based on data mining. The basis of the approach is the mechanism of machine learning, which includes two phases: training and testing. Given the qualitative nature of initial information, the logical algorithm of machine learning was chosen, basing on the construction of the classifying binary decision trees and allows to restore the non-linear relationship between the target variable and features. Logic algorithm allows: 1) to include random customer satisfaction to one of the classes, which are prede-fined in advance, depending on the preferences of company management; 2) to measure the weight / im-portance of each criterion and rank them in order of importance; 3) to construct an action diagram of the strengths and weaknesses of a company for each criterion. The proposed method is brought up to specific steps and is illustrated by a numerical example. |
RESUMEN: En el presente artículo se propone un enfoque original para evaluar la satisfacción global de consumidores de organizaciones empresariales, basado en la metodología de exploración de datos (minería de datos). El enfoque se basó́ en el mecanismo del aprendizaje automático, que incluye dos partes: capacitación y examen. Habida cuenta del carácter cualitativo de información básica, un algoritmo lógico de aprendizaje automático fue elegido, que se basa en construcción de árboles binarios de decisión para la clasificación y que permite recuperar las relaciones no lineales entre una variable objetiva y sus que características. El algoritmo lógico permite: 1) incluir un consumidor arbitrario a una de las clases de satisfacción predeterminadas según las preferencias de la Dirección de una empresa; 2) medir el peso/la importancia de cada criterio y graduarlos en orden creciente de importancia; 3) hacer una diagrama de acciones, que muestra los puntos fuertes y débiles de una empresa según cada criterio. La metodología propuesta es llevada a los casos concretos y fue ilustrada con un el ejemplo numérico. |

Measuring customer satisfaction is one of the most important issues, regarding commercial organizations of all types. The philosophy of the client-focused approach of the modern business organizations and implementation of the basic principles of continuous improvement justify the importance of measuring and analyzing the customer satisfaction. Currently, satisfaction is seen as the most reliable characteristics of the feedback from customers, bearing in mind that it reflects the preferences and expectations of our customers effectively, meaningfully and objectively. Therefore, today’s customer satisfaction can be seen as a possible quality standard in commercial organizations. On the other hand, it is impossible to continuously motivate employees of a company by non-material and abstract notion. For this reason, the satisfaction must be moved to the range of measurable parameters directly related to the people’s work activity, i.e. it must become a factor, which can be understood and influenced. The measurability provides achieving and implementing the goal for all staff involved in every stage of the process of customer service, whereas the using of a measuring system will help in identifying potential differences in perception of the quality of service between customer and management of a business organization.
The purpose of this work is to suggest the method for evaluating the global customer satisfaction of a company basing on their private judgments upon assigned criterion, to estimate the contribution of each criterion to results.
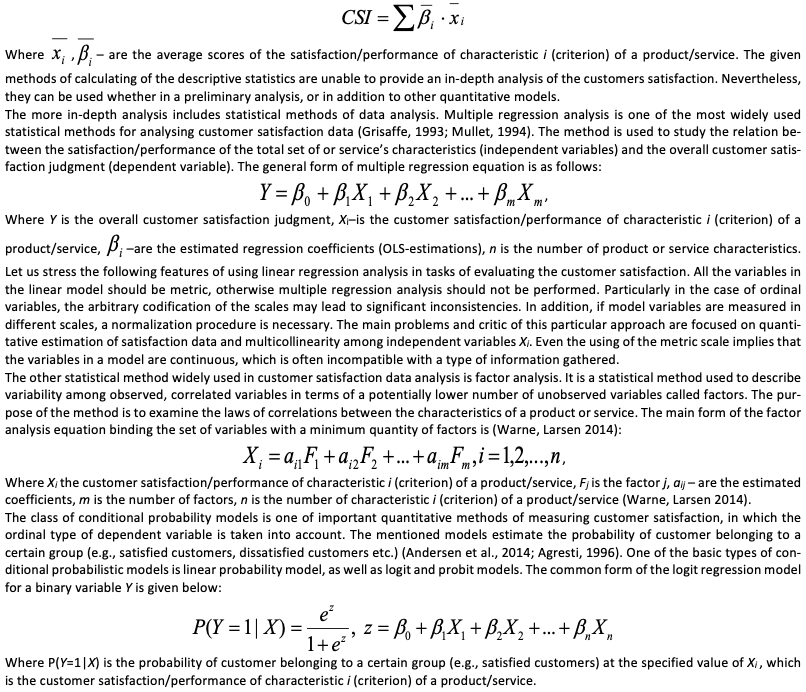
Various approaches to defining the customer satisfaction can be found in today’s literature. The most popular of them are based on satisfaction of customer expectations. As noted by Gerson (1993), Hill (1996), Oliver (1997) and Vavra (1997), satisfaction is a standard of how the offered “total” product or service fulfils customer expectations. Extensive research in the considered field have identified alternative approaches to estimation and analysis of satisfaction from multiple perspectives. The simplest method of analyzing polling data of satisfaction is estimation of frequency of customer answers to specific questions, which are considered critical. More precisely, depending on the applied scale, percentages of satisfied and dissatisfied customers are calculated and used as an indicator of effectiveness of a company. In the event that in the survey of satisfaction metric variables are used, the common satisfaction index can be estimated basing on the customer judgments about satisfaction and importance for individual characteristics of a product or service. The customer satisfaction index, or CSI, is calculated using a weighted sum formula (Hill, 1996):
The conditional probability models is generalized in case the dependent variable takes several (more than 2) values characterizing the customer satisfaction. It is supposed that the resulting value has an ordinal type and takes values from minimum to maximum level of the global customer satisfaction. This type of models has served as a base of the Multicriterion Satisfaction Analysis (MUSA method) developed by the scientists from the University of Crete in their cycle of works (Siskos, Grigoroudis, et al. 1998, 2002, 2003, 2010). The advantage of the method is that it takes fully into account the qualitative form of customer judgments and preferences. The necessary information is received through questionnaires, in which customers evaluate the service provided. Another advantage is that this method allows obtaining the weights of criterion. For this reason, a researcher has an opportunity to estimate the relative importance, which respondents attach to different aspects of the service efficiency.
In conclusion, we should mention a group of methods, which are basing on systems of fuzzy output, designed to convert the values of the input variable based on using fuzzy production rules. These rules are implemented in the form of premises or conditions set out in the form of fuzzy linguistic propositions. To obtain the estimation of the global customer satisfaction, it is necessary to form full and non-controversial system of logical rules, consisting of criterion conditions (Arinichev, et al. 2016). One of the advantages of the method is the ability of unsupervised learning of decision-making systems. Still, the set of rules is based on expert opinions and is subjective in nature.
Following the approaches represented in the works (Siskos, Grigoroudis), we shall address the global customer satisfaction of a company as an aggregation of particular customer preferences, expressed as judgments upon assigned criterion relative to the output of a product/service (fig. 1). Types and numbers of such criterion should be defined in advance taking into account the activity of the organization in question.
Figure 1
Aggregating of company
customers preferences
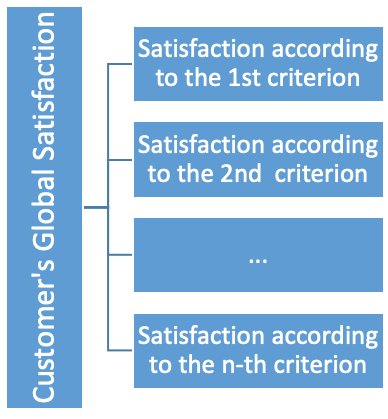
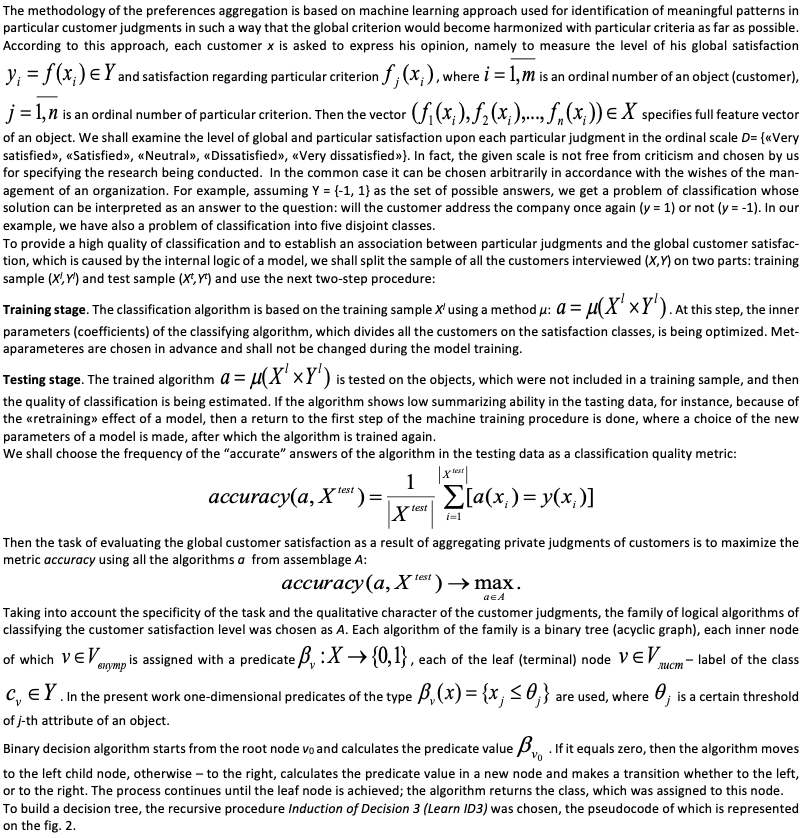
Figure 2
The recursive procedure of building binary decision tree
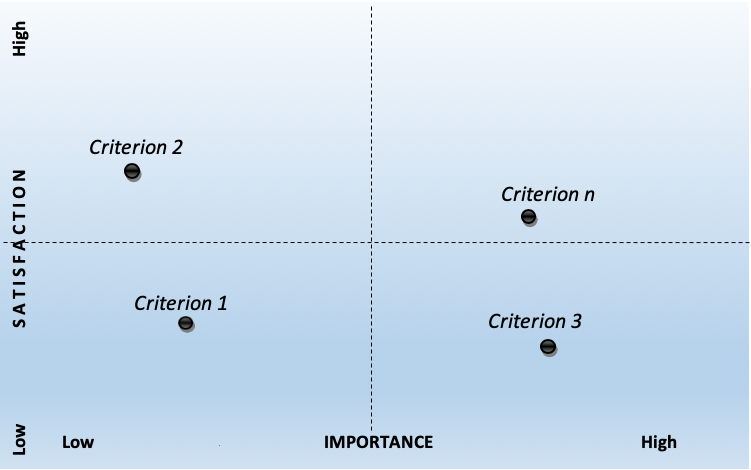
If we compare average satisfaction indexes of particular criteria with their importances, we can depict the results of modelling on a diagram map (fig. 3), which not only demonstrates strengths and weaknesses of the customer satisfaction, but also contributes to the elaboration of strategic management decisions (Siskos, Grigoroudis). The diagram is divided on four quadrants depending on the importance of a criterion along the axis OX (high/low) and the average satisfaction along the axis OY (high/low), which can be used for classifying the next actions:
1- Status quo (low performance and low importance): Generally, no action is required, given that these satisfaction dimensions are not considered as important by the customers.
2- Leverage opportunity (high performance/high importance): This area can be used as advantage against competition. In several cases, these satisfaction dimensions are the most important reasons why customers have purchased the product/service under study.
3- Transfer resources (high performance/low importance): Regarding the particular satisfaction dimension, company’s resources may be better used elsewhere (i.e. improvement of satisfaction dimensions located in the action opportunity quadrant).
4- Action opportunity (low performance/high importance): These are the criterion that need attention; improvement efforts should be focused on these, in order to increase the global customer satisfaction level.
Figure 3
Importance/satisfaction diagram
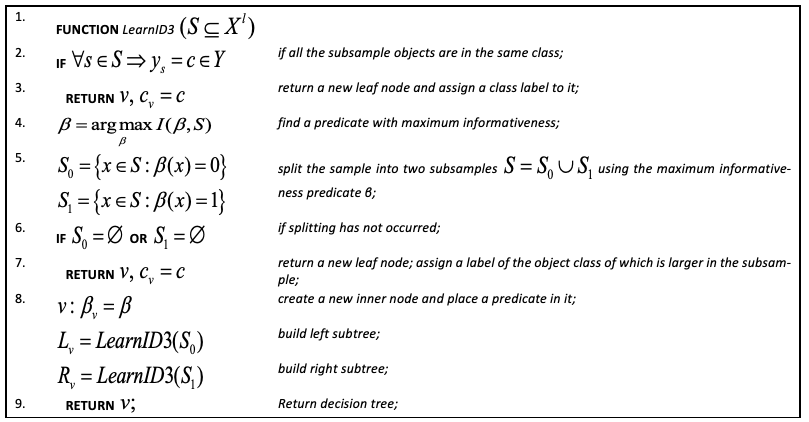
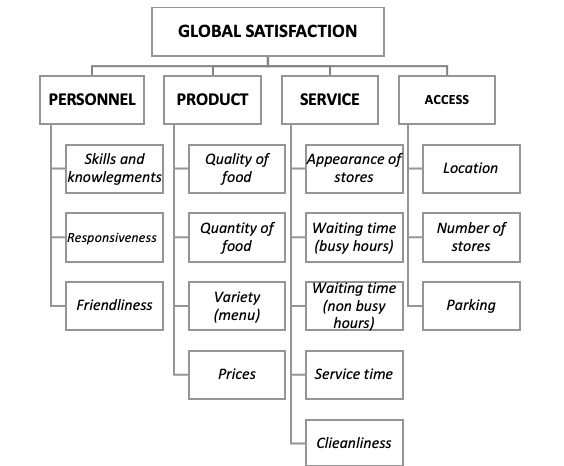
The authors have chosen four criteria for approbation of the suggested methodology (staff, product, service and availability) for a “fast food” store (fig. 4).
Figure 4
Hierarchic structure of satisfaction criteria in a «fast food» store
In table 1 a part of a training sample is represented, which contains data from customer surveys upon each particular criterion and the global satisfaction in common.
To simplify the procedure of relating an arbitrary customer to one of the classes of aggregated satisfaction, the labels of classes on an ordinal scale D for particular criteria were encoded to numerical values from 0 to 4, which also allowed to calculate average satisfaction indexes.
Table 1
Training sample of the customer
survey on four types of criteria
Customer |
Global satisfaction |
Personnel |
Product |
Service |
Access |
1 |
Very dissatisfied |
Dissatisfied |
Very dissatisfied |
Very dissatisfied |
Very dissatisfied |
2 |
Very dissatisfied |
Very dissatisfied |
Dissatisfied |
Very dissatisfied |
Dissatisfied |
3 |
Dissatisfied |
Dissatisfied |
Dissatisfied |
Dissatisfied |
Very dissatisfied |
4 |
Dissatisfied |
Neutral |
Neutral |
Dissatisfied |
Dissatisfied |
5 |
Neutral |
Neutral |
Neutral |
Neutral |
Neutral |
6 |
Satisfied |
Satisfied |
Neutral |
Very satisfied |
Satisfied |
8 |
Satisfied |
Dissatisfied |
Very satisfied |
Satisfied |
Satisfied |
9 |
Very satisfied |
Very satisfied |
Satisfied |
Very satisfied |
Neutral |
10 |
Very satisfied |
Dissatisfied |
Very satisfied |
Very satisfied |
Very satisfied |
As a result of using a procedure ID3 a binary decision tree was built (fig. 5), each node of which contains an inequality-restriction, basing on which a branching of the process of making decisions is proceeded; the volume of a customers subsample, related to the corresponding node as a consequence of branching; the value of Gini criterion, as well as the text label of the global satisfaction class.
Figure 5
Binary decision tree of classifying the objects
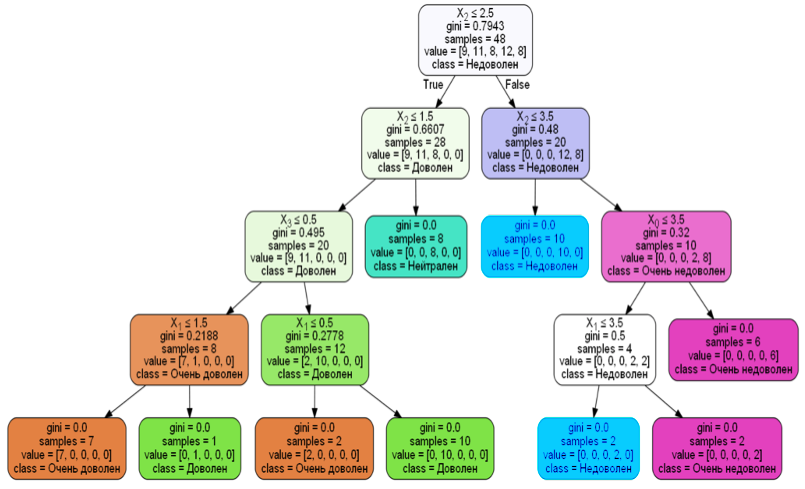
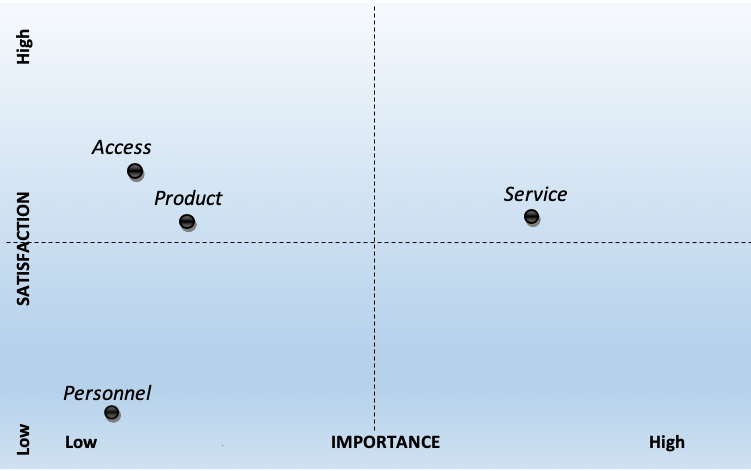
As was noted above, one of the features of decision trees is the ability to evaluate the importances (weights) of all the aggregated characteristics (criteria) on the basis of how sufficient will the quality criterion improve through using of this characteristic in tree nodes. The weights of criteria in the present example for «Staff», «Product», «Service» and «Availability» equal respectively (0,031; 0,186; 0,656; 0,126). It can be seen that the global customer satisfaction is formed more under influence of the particular satisfaction of the store service and less by its staff.
The analysis of the importance diagram (fig. 6) shows that none of the criteria has entered the critical area (the right-lower quadrant), which requires immediate management decision on advancement of production activities of the model organization. Nevertheless, if the company wishes to create competitive advantages, the criterion with the lowest values of the satisfaction indexes may be increased. In this case, the efforts of the company management may be focused on the criterion “Staff” with the purpose of moving it to the top left quadrant.
Figure 6
Importance/satisfaction diagram for the «fast food» store
For the last decades the organizations of all for all the types and sizes come to understanding of the importance of definition “customer satisfaction”. Nowadays it is far cheaper to retain the existing customers than to attract the new ones. For this reason, the customer satisfaction has become the key operational objective for many organizations, whereas the presence of the customer satisfaction barometer is today’s necessary condition for applying the basic principles of the continuous improvement of a company and the concept of the total quality management.
The article suggests an original method of estimating the global customer satisfaction based on aggregating of evaluations of customers private judgments on several characteristics (criteria) of an organization, which reflect strengths and weaknesses of an enterprise. The procedure is based on the principles of the machine training and splits on two stages (training and test), which repeat until the functionality of a quality achieves a sufficient quality of classifying the customers on groups. Taking into account the quantitative character of customer judgment, the authors have suggested a family of logical algorithms (binary decision trees) which on the one hand demonstrate visibility and transparency of making decisions; on the other hand, they make it possible to evaluate the weight (importance) of each criterion. The method is brought up to the concrete steps, which allows to integrate it to the common approach to quality management in companies. Moreover, a comparative analysis of modelling results and particular satisfaction indexes of a company can help in making effective management decisions in the process of developing crisis strategies in business.
Agresti, A. (1996). An introduction to categorical data analysis, John Wiley and Sons, New York.
Anderson, E.W., C. Fornell, and S. Mazvancheryl (2004). Customer satisfaction and shareholder value, Journal of Marketing, 68 (4), pp. 172-185.
Arinichev, I.V., Arinicheva I.V. and Bogdashev I.V. (2016) Customer satisfaction evaluation in the small business trading based on fuzzy-set approach, Economy and entrepreneurship, 9(74), pp. 1082-1088.
Dutka, A. (1995) AMA Handbbok of customer satisfaction: A guide to research, planning, and im-plementation, NTC Publishing Group, Illinois.
Gerson, R.F. (1993) Measuring customer satisfaction: A guide to managing quality service, Crisp Publications, Menlo Park.
Grigoroudis, E., Y. Politis, and Y. Siskos (2002). Satisfaction benchmarking and customer classification: An application to the branches of a banking organization, International Transactions in Operational Research, 9 (5), pp. 599-618.
Grigoroudis, E. and O. Spiridaki (2003). Derived vs. stated importance in customer satisfaction surveys, Operational Research: An International Journal, 3 (3), pp. 229-247.
Grigoroudis, E. and Y. Siskos (2003). MUSA: A decision support system for evaluating and analyzing customer satisfaction, in K. Margaritis and I. Pitas (eds.), Proceedings of the 9th Panhellenic Conference in Informatics, ΤΕΙ of Thessaloniki, pp. 113-127.
Siskos Y, Grigoroudis, E (2010) Measuring Customer Satisfaction for Various Services Using Multicriterion Analysis, Springer.
Grisaffe, D. (1993). Appropriate use of regression in customer satisfaction analyses: A response to William McLauchlan, Quirk’s Marketing Research Review, February, pp. 10-17.
Massnick, F. (1997) The customer is CEO: How to measure what your customers want – and make sure they get it, AMACOM, New York.
Matveeva L.G., Mihalkina E.V., Kosolapova N.A., Chernova O.A. The assessment of the intangible resources of the region as a component of its modernization potential//
Journal of Advanced Research in Law and Economics Volume IX, Issue 2 (32), Spring 2018.Р.442-451.
Mullet, G.M. (1994). Regression. Quirk’s Marketing Research Review, October, pp. 12-15.
Oliver, R.L. (1997) Satisfaction: A behavioral perspective on the customer, McGraw-Hill, New York.
Warne, R. T.; Larsen, R. (2014). "Evaluating a proposed modification of the Guttman rule for determining the number of factors in an exploratory factor analysis". Psychological Test and Assessment Modeling. 56: 104–123.
1. Department of Theoretical Economy, Kuban State University, Assistant Professor, Candidate of Economic Sciences, Krasnodar, Russia; iarinichev@gmail.com
2. Department of High Mathematics, Kuban State Agrarian University named after I.T. Trubilin, Professor, Doctor of Biologic Sciences, Krasnodar, Russia; loukianova7@mail.ru
3. Department of information economy, Southern Federal University, Professor, Doctor of Economic Sciences, Rostov-on-Don, Russia; matveeva_lg@mail.ru
4. Department of World Economy, Kuban state University, Professor, Doctor of Economic Sciences, Krasnodar, Russian Federation; darmil@mail.ru