![]() ISSN 0798 1015
ISSN 0798 1015

![]() ISSN 0798 1015
ISSN 0798 1015
Vol. 40 (Number 25) Year 2019. Page 19
SILVEIRA, Thiago C. dos R. 1; KRAINER, Christiane W. M. 2; KRAINER, Jefferson A. 3; ROMANO, Cezar A. 4; MATOSKI, Adalberto 5; SANTO, André L. A. 6 e MOREIRA, Amacin R. 7
Received: 08/04/2019 • Approved: 17/06/2019 • Published 22/07/2019
ABSTRACT: Gender is often used as a descriptive variable in transportation studies; however, few studies have dealt with its explanatory power over travel satisfaction. We investigated its influence on both satisfaction at overall and attribute levels and relative importance. A linear regression model was built. The findings yield that gender has a limited influence on overall satisfaction. However, women tend to be more critics about expected and delivered service. Future studies could investigate gender influence on satisfaction at multimodal scenarios. |
RESUMO: O gênero é frequentemente usado como uma variável descritiva em estudos de transporte; no entanto, poucos estudos tratam do seu poder explicativo sobre a satisfação com a viagem. Investigamos sua influência tanto na satisfação em níveis gerais e de atributos quanto na importância relativa. Um modelo de regressão linear foi construído. Os resultados indicam que o gênero tem influência limitada na satisfação geral. No entanto, as mulheres tendem a criticar mais o serviço. Estudos futuros poderiam ser estendidos para multimodais. |

Encouraging public transport is seen as a way of reducing economic, social and environmental impacts of car dependency, since transit-oriented areas are correlated with higher density, reduced parking availability, and mixed land use (Chatman, 2013), which are linked to sustainable development (Litman, 1999). As to increase public transport share, public authorities should understand passengers' needs, once loyalty is strongly associated with satisfaction (van Lierop & El-Geneidy, 2016).
Customer satisfaction is based on an affective response to the perceived discrepancy between delivered and expected service (Kotler, 2000). It is believed to be perceived along a spectrum ranging from ideal to unacceptable quality, which depends on the nature of the gap between expected and delivered service (Parasuraman, Zeithaml, & Berry, 1985). In this way, providing service perceived as of high quality is likely to generate positive word-of-mouth and willingly reuse (Lai & Chen, 2011), which are key to actual behavior.
Curitiba city, the focus of this study, became an international reference in sustainable urban development due to innovations such as the BRT (Bus Rapid Transit) – adopted by more than 150 cities around the globe. Nonetheless, the system has been showing signs of saturation. It was faced with a ridership loss of about 14% between 2015 and 2017. On the other hand, it has one of the largest vehicles per capita ratios in the country. This scenario impacts directly its financial sustainability, since operational cost distribution is indexed by passengers per kilometer and many expenses do not depend in the number of passengers carried.
This study proposes to analyse the influence of gender on perceived service quality through customer satisfaction survey (CSS) data. This study adds to the literature since it also investigates its impacts on the relative importance attached to each attribute aiding the development of more effective urban policies and, thus, directing more assertive investments.
Gender is often used as descriptive variable for most transportation studies. In structural equation models (SEM), which allows to use both unobserved (latent) and observed indicators to describe a given phenomenon, gender is analysed together with a set of other descriptive variables (Xue mei Fu, Zhang, & Chan, 2018; Shiftan, Outwater, & Zhou, 2008). However, explaining its power on travel satisfaction was hardly assessed.
Pazy, Salomon & Pintzov (1996) analysed attitudinal variables as to explain women's willingness to extend their commuting trips in exchange for career gains in the United States. The changes in behavior were correlated with commute duration and distance travelled. Hamilton & Jenkins (2000) investigated the major gender differences in what regards to public transport and their implications on policy development. It supports that improving public transportation towards women's needs could have positive commercial results, since they are the main users of this modality and poor quality may limit access to employment and social support services. Therefore, including woman's needs into the planning process would avoid an increase in car usage.
Johansson-Stenman (2002) studies the case of Sweden. In the early 2000's, it was already noticeable that men's public transport ridership was decreasing, while women kept using public transport. He found that driving increased with individual income, and not household income. In partnership scenarios, the one with higher income would be more likely to drive. Matthies, Kuhn & Klockner (2002) developed a model of travel mode as to assess the likeness of men and women to reduce car usage. It was found that due to stronger ecological norms and weaker car habits, women were more likely to a mode switch.
Rojo, Gonzalo-Orden, dell’Olio, & Ibeas (2011) were the first to evaluate the influence of gender on perceived service quality. It was developed an ordered logit and an ordered probit model as to develop a methodology to rank service attributes for system improvement. The model results yielded fare, fleet conditions, and service frequency as the most relevant. Fu & Juan (2017b) explored the influence of gender on the theory of planned behavior. They highlighted through SEM analysis a difference on the relation between satisfaction and behavior, according to gender, since its path significance is only true for women. Furthering the analysis, this study investigated the influence of gender on both satisfaction and relative importance as to better understand user behavior.
As to improve public transport attractiveness and motivate long term usage, public authorities should understand what makes a customer satisfied (van Lierop & El-Geneidy, 2016). Customer satisfaction surveys (CSS) are the most common way of collecting data concerning perceived performance, satisfaction and attribute relative importance (Guirao, García-Pastor, & López-Lambas, 2016; Oña & Oña, 2015). Its analysis help interested parties to develop a better a more global view of passengers' needs and expectations (Wang, Feng, & Hsieh, 2010), thus, providing useful information to define more effective goals and more assertive investments (Mouwen, 2015).
In this way, CSS was the tool selected to gather data for this study. The developed survey was composed of three different sections: socioeconomic characteristics, service attribute and overall system satisfaction, Likert scale stated attribute importance was used. The CSS passed through a month pre-test and adjustment (correction) period. After this, an online form was promoted through the broadcast mailing systems of three major local universities. Answers were received during April to May 2018.
Earlier studies highlight that model predictive value can be increased if evaluated service attributes are chosen according to local context (Carrillat, Jaramillo, & Mulki, 2007). Therefore, previous literature (e.g. Bordagaray, dell’Olio, Ibeas, & Cecín, 2014; Eboli & Mazzulla, 2008; Guirao et al., 2016; Lai & Chen, 2011; Mouwen, 2015; Rojo, dell’Olio, Gonzalo-Orden, & Ibeas, 2013) and local laws were analysed, and 17 factors were selected to evaluate user satisfaction at attribute level and relative attribute importance: accessibility, service frequency, reliability, travel time, system connectivity, fare connectivity, safety and security, staff behavior, fleet conditions, vehicle interior conditions, crowding conditions, bus stop infrastructure, service information, road conditions, bus-only lane availability, fare, and sustainable technologies.
The data was analysed as to answer some guiding questions. The first step was to perform a descriptive analysis of both socio-economic and usage variables as to identify if there were any significant differences between male and female respondents. The next stage was to perform a factor analysis for each sample (male, female and overall) as to evaluate data variance and their impact on variable aggregation. Following, collected satisfaction data was analysed through descriptive analysis and a Kruskal-Wallis test was carried out as to spot differences between studied groups at attribute level. As to answer this study's main question, a linear regression model was built to measure the impact of gender on service attribute and overall satisfaction scores. Finally, relative importance data was also analysed through descriptive procedures and main differences between genders were evaluated through a Kruskal-Wallis test.
Data collected from the applied online survey was used to derive descriptive statistics. It received 895 replies, however, some had to be excluded from the sample due to incomplete answers. Therefore, further analysis was based on 822 responses, which meets the criteria set by (Bartlett, Kotrlik, & Higgins, 2001) as to ensure 95% confidence intervals for an estimated population of about 1.9 million inhabitants.
The sample's age average was of 25 years old, which was expected since the questionnaire was mostly disseminated in an academic environment. This result still holds when the sample is disaggregated between male and female respondents. 93% of the sample has at least started university studies and 71% is composed by students. Both education and profession variables did not yield enough differentiation between genders. This statement is supported by a chi-square test, which implied at 95% confidence level that they can not be used as predictors of gender due to low correlation.
On the other hand, household income can reduce error in about 6.8% (lambda value) when used to predict gender. The correlation was also tested through a chi-square test, which returned 15.9% for the Cramer's V at a 95% confidence level. Cramer's V is a measure of association between two nominal variables, based on Pearson's chi-squared statistic that ranges from 0 to 1. In overall, women respondents have lower household income than men (Table 1).
Table 1
Socio-economic descriptive results
Variable |
Subclassification |
Female |
Male |
Total |
Age (Years) |
16 - 24 |
37.7% |
33.3% |
71% |
25 - 35 |
11.8% |
12.9% |
25% |
|
36 - 60 |
5.0% |
5.2% |
10% |
|
over 60 |
0.9% |
0.5% |
1% |
|
Education |
Less than high school graduate |
1.0% |
1.3% |
2% |
High school graduate |
2.4% |
2.6% |
5% |
|
Some college, no degree |
36.4% |
32.7% |
69% |
|
Bachelor's degree |
4.2% |
5.2% |
9% |
|
Graduate or professional degree |
7.6% |
6.7% |
14% |
|
Household Income |
Up to 2 |
8.3% |
8.1% |
16% |
(Minimum Wages) |
2 to 4 |
17.0% |
11.0% |
28% |
4 to 10 |
19.3% |
19.1% |
38% |
|
10 to 20 |
6.2% |
7.4% |
14% |
|
Over 20 |
0.8% |
3.0% |
4% |
|
Main Occupation |
Student |
37.3% |
33.9% |
71.2% |
Employed |
9.8% |
10.5% |
20.3% |
|
Other |
3.0% |
1.8% |
4.8% |
|
Entrepreneur |
0.7% |
1.0% |
1.7% |
|
Unemployed |
0.5% |
0.8% |
1.3% |
|
Retired |
0.5% |
0.3% |
0.8% |
Usage variables were also analysed as to better understand the sample's habits in what regards to public transport. 66% use Curitiba's public transport system daily, which represents a fair share of frequents users. However, it is important to highlight a trend of ridership decrease in the past years. According to URBS, the system manager, between 2015 and 2017, ridership reduced in about 14%. It has a negative influence on financial sustainability, since operational costs are diluted by passenger transported. Contrarily, vehicle ownership in Curitiba has increased to be the highest vehicle per capita ratio among the country's state capitals (0.73).
In a multiple answer question, respondents were asked about their most frequent trip purposes. As expected from the questionnaire dissemination, 82% marked education as a frequent reason for public transport usage, 56 % for leisure and 51% for work reasons. According to descriptive analysis, a correlation is found between gender and trip purposes (Cramer's V of 15%). In the sample, women are the ones who use public transport for more reasons. Though most frequent reasons have similar gender distributions, shopping and health-related trips have a wider female share.
Curitiba's public transport is composed of 7 distinct bus lines categories, which are easily identified due to specific colors. BRT (76%), conventional (46%), direct (39%) and feeder (34%) lines are the most frequent choices, which is related to the city’s urban planning. Furthermore, 67% use two or more bus lines to complete their most frequent routes, which might decrease travel time satisfaction depending on available infrastructure, perception of safety and service frequency (Fan, Guthrie, & Levinson, 2016). 71% find overcrowding conditions at least 3 times a week, from which 43% face it daily. This situation is more common for BRT, direct and conventional, which are also the most used ones.
In the sample, women were found to use more feeder and conventional bus lines when compared to men. These categories connect integration terminals to residential areas and residential to downtown areas and have lower service frequency and smaller buses. These characteristics can contribute to women facing more frequent overcrowding conditions than men. Additionally, women also reported being robbed in the system more often than men did. This result can be related to bus stop infrastructure. In Curitiba, express and direct lines have closed stations in their routes, which is not the case for feeder and conventional lines.
Satisfaction was evaluated through a 17-variable concerning different service attribute. Respondents were asked to evaluate each statement in a 5-point Likert scale. The results were put through an item reliability analysis which yielded 0.871 for Cronbach's alpha, which indicates a consistent and reliable set of variables. Therefore, it was not needed to exclude any variable from the analysis. The first step into the investigation was to try to understand the data's variance structure according to factor analysis. It was applied for the female sample, the male sample, and the overall sample as to examine possible differences in attribute covariance between the different selections. All iterations used a principal components methodology with varimax rotation, standardized values and eigenvalues set to cut at one.
In the overall sample, the factor analysis lead to three different factors, which combined explain 44.8% of sample variance:
According to the factorability tests, the results have great sampling adequacy given a KMO of 0.907 and the non-correlation hypothesis was refused through Bartlett’s Test of Sphericity at 95% confidence level. Fare was excluded from the analysis due to loading bellow 0.50. Also, Accessibility and Connectivity cannot be considered a cohesive factor, since its Cronbach's alpha result is bellow 0.70. From the remaining factors, a parallel can be drawn from the literature. In the Transit Capacity and Quality of Service Manual, the Transportation Research Board (2013) divided transportation service quality attributes into two main groups: availability and comfort and convenience, which have a similar structure to the presented factors. In this way, service performance attributes are able to describe in space and time dimensions the service availability. Comfort attributes are associated with the probability of frequent users to become frequent ones.
The male sample yielded the same three factors as before, but with slightly lower Cronbach's alpha results. In total, they were able to explain 45.7% of sample variance. System Performance alone was responsible for 31.7%, which indicates that men credit higher importance to the attributes in this factor. This statement is supported by the communality results, since service frequency, reliability and travel time are among the attributes that most contribute to overall variance. KMO results also indicated great sample adequacy (0.905) and the non-correlation hypothesis was also refused by the Bartlett’s Test of Sphericity. Sustainable technologies, staff behavior, and fare had to be excluded from the analysis due to low factors loadings.
From the female sample, it was derived 4 different factors, however, only Comfort Attributes could be considered reliable according to Cronbach's alpha results. In this way, women probably attribute more importance to comfort, since this factor alone was responsible for 29.5% of sample variance. Among service attributes with greater communality, fleet conditions, vehicle interior conditions, and road conditions stand out. This analysis yielded the lowest KMO value (0.887), which is classified as a good sample adequacy. Non-correlation hypothesis was again refused. Staff behavior, bus-only lane availability, and fare were excluded from the analysis. The differences found between male and female factor analysis indicates that there is a difference in satisfaction perception at attribute level, which is further discussed in the next section.
Collected satisfaction data was analysed through descriptive analysis (Table 2). In overall, fare, service frequency, safety and security, vehicle interior conditions, and crowding conditions are the attributes with the worst perceived satisfaction and should be further investigated.
Table 2
Attribute and overall satisfaction descriptive results
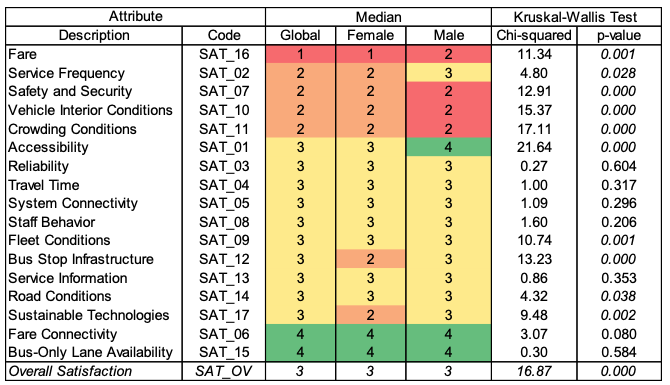
For the comparison between male and female samples, a Kruskal Wallis test was chosen, since it is a non-parametric test and, therefore, it does not require a normal distribution. In this way, it was found that fare, service frequency, safety and security, vehicle interior conditions, crowding conditions, accessibility, fleet conditions, bus stop infrastructure, road conditions, and sustainable technologies were evaluated differently between the analysed groups. It supports the findings from the factor analysis that indicated a difference in perception. The greater difference occurs for crowding conditions, safety and security, fare, accessibility, and vehicle interior conditions. This result might be explained by usage variables. For example, women reported more often to experience overcrowding conditions and to be robbed in the system than men. As expected, it yielded a negative impact on both crowding conditions, vehicle interior conditions and safety and security scores. Additionally, feeder and conventional lines, which are more used by women, being more spread out have a negative impact on accessibility.
Given that both factor and descriptive analysis indicated that male and female samples perceive service attributes satisfaction differently, a linear regression model was built as to analyse the influence of gender on the perceived satisfaction of each service attribute (Table 3).
Table 3
Influence of gender on satisfaction at attribute and overall satisfaction levels
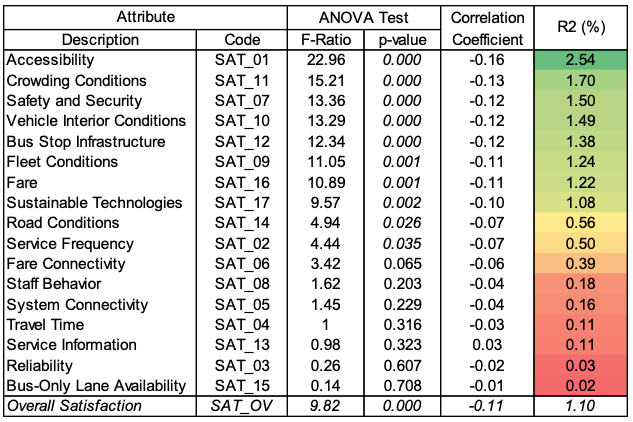
The ANOVA test indicates that only service attributes which refused the null hypothesis for the Kruskal Wallis test are influenced by gender. However, its effects are negative and limited. The R² results, which measured how much gender could explain from each service attribute variance, support the small influence of gender. Accessibility is the most affected service attribute, but with a R² of only 2.54%. In overall, gender answers for only 1.10% of overall satisfaction variance.
Relative importance was also assessed through descriptive analysis, which is the most used procedure by service operators and public managers due to its simplicity. In this study, the same 17-variable set was rated according to a Likert scale. One disadvantage from this method, is that respondents tend to rate nearly all attributes at the top of the scale resulting in poor and insufficient differentiation among the results. Nonetheless, the item reliability resulted in 0.905 for the Cronbach’s alpha test, thus indicating a consistent set of variables, even though there was only up to 5% difference between two subsequent mean attribute scores.
In overall, service frequency, reliability, fare connectivity, safety and security, fare, and accessibility are among the most important attributes for the sample (Table 4). This result is supported by previous findings from the literature (Xuemei Fu & Juan, 2017a; Oña & Oña, 2015). Thus, highlighting the importance of public policies that target improving their satisfaction perception, since fare, safety and security, and service frequency have the worst satisfaction scores.
Table 4
Relative importance of service attributes
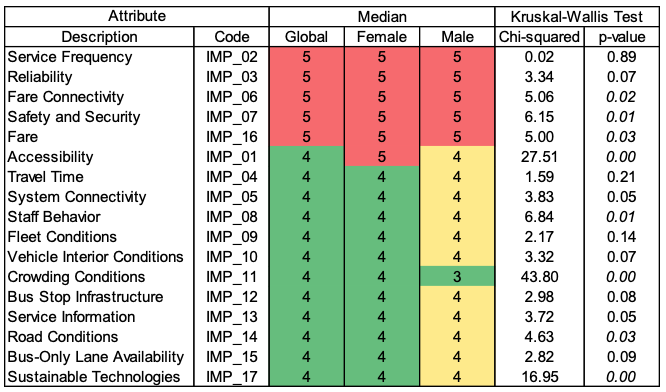
Kruskal Wallis test was again used for comparing both samples. Although, differences were found for fare connectivity, safety and security, fare, accessibility, staff behavior¸ crowding conditions, road conditions, and sustainable technologies they were not so perceptible. In general, accessibility and crowding conditions yielded different medians, while men were less critical about crowding conditions, women deemed accessibility as more important. Even though it is a small change, it corroborates a suspicion from the factor analysis that women put more importance into comfort attributes while men into service attributes.
From a policy development perspective, it is important to understand how different factors might influence overall public transport satisfaction. This information can be used as to better select variables for market segmentation studies, which can help public management to better define goals and to make more assertive investments. The findings from this study yield that gender have a limited influence on overall satisfaction. Accessibility, the service attribute with most gendered influence, only holds 2.54% for the R².
However, it is noticeable from the data that women tend to have more critics about expected and delivered service. For example, all attributes that were evaluated differently between genders had received lower scores by the women sample. On the other hand, women attributed more importance to most service attributes than men. These differences can be rooted on different usage and socio-economic descriptive value, since income and trip purposes can be used as gender predictors. Additionally, women reported facing more overcrowded conditions, being more exposed to unsafe environments and using more feeder and conventional lines, which had negative impacts on satisfaction.
The factor analysis indicated from variance explained that men tend to put more importance into service performance attributes, such as reliability, service frequency, travel time, while women into comfort attributes, such as vehicle interior conditions, fleet conditions, bus stop infrastructure, safety and security, and crowding conditions. It needs to be further investigated, since analyzed relative importance data did not provide enough strong evidence to support it. Moreover, the influence of gender should be further investigated in multi-modal studies, since it would provide information from a more complex scenario.
Bartlett, James E., Kotrlik, Joe W., & Higgins, Chadwick C. (2001). Organizational research: Determining appropriate sample size in survey research. Information Technology, Learning, and Performance Journal. https://doi.org/10.1109/LPT.2009.2020494
Bordagaray, Maria, dell’Olio, Luigi, Ibeas, Angel, & Cecín, Patricia (2014). Modelling user perception of bus transit quality considering user and service heterogeneity. Transportmetrica A: Transport Science, 10(8), 705–721. https://doi.org/10.1080/23249935.2013.823579
Carrillat, François A., Jaramillo, Fernando, & Mulki, Jay P. (2007). The validity of the SERVQUAL and SERVPERF scales: A meta-analytic view of 17 years of research across five continents. International Journal of Service Industry Management, 18(5), 472–490. https://doi.org/10.1108/09564230710826250
Chatman, Daniel G. (2013). Does TOD need the T? Journal of the American Planning Association, 79(1), 17–31. https://doi.org/10.1080/01944363.2013.791008
Eboli, Laura, & Mazzulla, Gabriella (2008). A stated preference experiment for measuring service quality in public transport. Transportation Planning and Technology, 31(5), 509–523. https://doi.org/10.1080/03081060802364471
Fan, Yingling, Guthrie, Andrew, & Levinson, David (2016). Waiting time perceptions at transit stops and stations: Effects of basic amenities, gender, and security. Transportation Research Part A: Policy and Practice, 88, 251–264. https://doi.org/10.1016/j.tra.2016.04.012
Fu, Xuemei, & Juan, Zhicai (2017a). Drivers of transit service loyalty considering heterogeneity between user segments. Transportation Planning and Technology, 40(5), 611–623. https://doi.org/10.1080/03081060.2017.1314495
Fu, Xuemei, & Juan, Zhicai (2017b). Exploring the psychosocial factors associated with public transportation usage and examining the ‘‘ gendered ” difference. Transportation Research Part A, 103, 70–82. https://doi.org/10.1016/j.tra.2017.05.017
Fu, Xue-mei, Zhang, Jiang-hua, & Chan, Felix T. S. (2018). Determinants of loyalty to public transit: A model integrating Satisfaction-Loyalty Theory and Expectation-Confirmation Theory. Transportation Research Part A: Policy and Practice, 113(May), 476–490. https://doi.org/10.1016/j.tra.2018.05.012
Guirao, Begoña, García-Pastor, Antonio, & López-Lambas, María E. (2016). The importance of service quality attributes in public transportation: Narrowing the gap between scientific research and practitioners’ needs. Transport Policy, 49, 68–77. https://doi.org/10.1016/j.tranpol.2016.04.003
Hamilton, Kerry, & Jenkins, Linda (2000). A Gender Audit for Public Transport: A New Policy Tool in the Tackling of Social Exclusion, 37(10), 1793–1800. Retrieved from http://eds.b.ebscohost.com/eds/pdfviewer/pdfviewer?sid=d13db223-eb0d-40c5-8130-b087fc34e600%40sessionmgr113&vid=6&hid=127
Johansson-Stenman, Olof (2002). Estimating individual driving distance by car and public transport use in Sweden. Applied Economics, 34(8), 959–967. https://doi.org/10.1080/00036840110068823
Kotler, Philip (2000). Marketing Management, Millenium Edition. Marketing Management. https://doi.org/10.1016/0024-6301(90)90145-T
Lai, Wen-Tai, & Chen, Ching-Fu (2011). Behavioral intentions of public transit passengers — The roles of service quality , perceived value , satisfaction and involvement. Transport Policy, 18(2), 318–325. https://doi.org/10.1016/j.tranpol.2010.09.003
Litman, Todd (1999). Exploring the Paradigm Shifts Needed To Reconcile Transportation and Sustainability Objectives. Transportation Research Record: Journal of the Transportation Research Board, 1670(99), 8–12. https://doi.org/10.3141/1670-02
Matthies, Ellen, Kuhn, Silke, & Klockner, Christian A. (2002). The Result of Limitation, Ecological Norm, or Weak Habit ? Environment and Behavior, 34(2), 163–177.
Mouwen, Arnoud (2015). Drivers of customer satisfaction with public transport services. Transportation Research Part A: Policy and Practice, 78, 1–20. https://doi.org/10.1016/j.tra.2015.05.005
Oña, Juan de, & Oña, Rocio de. (2015). Quality of Service in Public Transport Based on Customer Satisfaction Surveys : A Review and Assessment of Quality of Service in Public Transport Based on Customer Satisfaction Surveys : A Review and Assessment of Methodological Approaches. Transportation Science, 49(3), 605–622.
Parasuraman, A., Zeithaml, Valarie A., & Berry, Leonard L. (1985). A Conceptual Model of Service Quality and Its Implications for Future Research. American Marketing Association, 49(4), 41–50. https://doi.org/10.2307/1251430
Pazy, Asya, Salomon, Ilan, & Pintzov, Tovi (1996). The impacts of women’s careers on their commuting behavior: A case study of israeli computer professionals. Transportation Research Part A: Policy and Practice, 30(4 PART A), 269–286. https://doi.org/10.1016/0965-8564(95)00025-9
Rojo, Marta, dell’Olio, Luigi, Gonzalo-Orden, Hernán, & Ibeas, Ángel (2013). Interurban bus service quality from the users’ viewpoint. Transportation Planning and Technology, 36(7), 599–616. https://doi.org/10.1080/03081060.2013.845432
Rojo, Marta, Gonzalo-Orden, Hernán, dell’Olio, Luigi, & Ibeas, Angel (2011). Modelling gender perception of quality in interurban bus services. Proceedings of the Institution of Civil Engineers - Transport, 164(1), 43–53. https://doi.org/10.1680/tran.9.00031
Shiftan, Yoram, Outwater, Maren L., & Zhou, Yushuang (2008). Transit market research using structural equation modeling and attitudinal market segmentation. Transport Policy, 15(3), 186–195. https://doi.org/10.1016/j.tranpol.2008.03.002
Transportation Research Board (2013). Transit Capacity and Quality of Service Manual. Third Edition. Transit Capacity and Quality of Service Manual. https://doi.org/10.17226/24766
van Lierop, Dea, & El-Geneidy, Ahmed (2016). Enjoying loyalty: The relationship between service quality, customer satisfaction, and behavioral intentions in public transit. Research in Transportation Economics, 59(1), 50–59. https://doi.org/10.1016/j.retrec.2016.04.001
Wang, Shu-Mei, Feng, Cheng-Min, & Hsieh, Cheng-Hsien (2010). Stakeholder perspective on urban transport system service quality. Total Quality Management & Business Excellence, 21(11), 1103–1119. https://doi.org/10.1080/14783363.2010.529329
1. Msc. student, Postgraduate Program in Civil Engineering. Civil Engineering Academic Department. Federal Technological University of Paraná. Curitiba. Brazil. E-mail: thiagocarvalhoreis@gmail.com
2. PhD. student, Postgraduate Program in Civil Engineering. Civil Engineering Academic Department. Federal Technological University of Paraná. Curitiba. Brazil. E-mail: chriswmk70@gmail.com
3. PhD. student, Postgraduate Program in Civil Engineering. Civil Engineering Academic Department. Federal Technological University of Paraná. Curitiba. Brazil. E-mail: profjeffersonkra@gmail.com
4. PhD., Prof. Postgraduate Program in Civil Engineering. Civil Engineering Academic Department. Federal Technological University of Paraná. Curitiba. Brazil. E-mail: romano.utfpr@gmail.com
5. PhD., Prof. Postgraduate Program in Civil Engineering. Civil Engineering Academic Department. Federal Technological University of Paraná. Curitiba. Brazil. E-mail: adalberto@utfpr.edu.br
6. Msc. student, Postgraduate Program in Civil Engineering. Civil Engineering Academic Department. Federal Technological University of Paraná. Curitiba. Brazil. E-mail: andre.santo@gmail.com
7. PhD. student, Postgraduate Program in Civil Engineering. Civil Engineering Academic Department. Federal Technological University of Paraná. Curitiba. Brazil. E-mail: amacinrm@utfpr.edu.br