![]() ISSN 0798 1015
ISSN 0798 1015

![]() ISSN 0798 1015
ISSN 0798 1015
Vol. 40 (Number 25) Year 2019. Page 23
ELOKHOV, Alexander M. 1; ALEXANDROVA, Tatyana V. 2 & PRUDSKLY, Vladimir G. 3
Received: 13/04/2019 • Approved: 08/07/2019 • Published 22/07/2019
ABSTRACT: The research aims at the necessity and possibility to show specific digitalization features of cities and regions in the existing evaluation methods of the Russian economy digital transformation index. The researchers used logical, systematic and comparative analysis methods to analyze the digitalization indicators of the largest Russian cities and regions. The results allowed to update the digitalization indicators of the largest Russian cities and regions between 2014-2018; they also defined figures, reflecting regional disproportions of the national economy digitalization; and developed new methods to evaluate digital inequality in the system «City-Region-Country». The use of the suggested indicators will improve the existing evaluation methods of the largest Russian cities digitalization, increases the consistency level of digital processes and technologies evaluation for making decisions in the system of state, regional and municipal government; it also contributes to the decrease in regional disproportions in the digital transformation model of the Russian economy. |
RESUMEN: La investigación apunta a la necesidad y la posibilidad de mostrar características de digitalización específicas de ciudades y regiones con los métodos de evaluación existentes del índice de transformación digital de la economía rusa. Los investigadores utilizaron métodos de análisis lógicos, sistemáticos y comparativos para analizar los indicadores de digitalización de las ciudades y regiones más grandes de Rusia. Los resultados permitieron actualizar los indicadores de digitalización de las ciudades y regiones más grandes de Rusia entre 2014-2018; también definieron cifras, que reflejan desproporciones regionales de la digitalización de la economía nacional y se desarrollaron nuevos métodos para evaluar la desigualdad digital en el sistema «Ciudad-Región-País». El uso de los indicadores sugeridos mejorará los métodos de evaluación existentes de la digitalización de las ciudades más grandes de Rusia, aumentará el nivel de coherencia de los procesos digitales y la evaluación de tecnologías para tomar decisiones en el sistema de gobierno estatal, regional y municipal; también contribuirá a la disminución de las desproporciones regionales en el modelo de transformación digital de la economía rusa. |

In recent years, the development priorities of national economies have been revised due to using up extensive development forms. This makes the use of innovative Industry 4.0 digital technologies necessary in all spheres of public production. The introduction of these technologies transforms business models, contributes to the appearance of new products and services, creates new entrepreneurial processes, generates a higher usefulness and introduces a new managerial culture (Cagnin et al., 2013; Jeschke et al., 2017). The changes in the structure of international resource’s flows demonstrates this. Information flows increased by 70% from 2005 to 2016, while the capital and goods ones increased by only 7% (Hamilton & Daniel, 2017).
In this situation, some countries and interstate unions try to gain competitive advantages and a more rapid economic growth mainly by developing and implementing digital technologies. However, these processes are uneven, though unidirectional (Dobrynin, 2016). Table 1 shows the digital economy share in GDP of different countries (Kapranova, 2018).
Table 1
Digital economy indicators in different economies, 2016.
Indicator, % of GDP |
The USA |
China |
5 EU countries* |
India |
Brazil |
Czech Republic |
Russia |
Households expenditure in digital sphere |
5.3 |
4.8 |
3.7 |
3.2 |
2.2 |
2.2 |
2.6 |
Companies’ investments in digitalization |
5.0 |
1.8 |
3.9 |
2.7 |
3.6 |
2.0 |
2.2 |
Governmental expenditure on digitalization |
1.3 |
0.4 |
1.0 |
0.6 |
0.8 |
0.5 |
0.5 |
ICT export |
1.4 |
5.8 |
2.5 |
5.9 |
0.1 |
2.9 |
0.5 |
ICT import |
-2.1 |
-2.7 |
-2.9 |
-6.1 |
-1.0 |
-2.1 |
-1.8 |
Digital economy size (total) |
10.9 |
10.0 |
8.2 |
6.3 |
6.2 |
5.5 |
3.9 |
* Includes data on Great Britain, Germany, Italy, France, and Sweden
The table demonstrates a considerable lag in size of Russian digital economy not only from the leading digital countries (EU countries, the USA, China), but also from the countries with a middle digitalization level (India, Brazil, the Czech Republic). Besides, the growth rate of the digital economy aggregate contribution into the country’s GDP is also lower than in other countries, for example, this growth rate was 4,8% (in US dollars) in Russia, 6-7% in Scandinavian countries, 8-9% in the USA and Great Britain, 20% in China (Basaev, 2018).
A considerable lag of Russia in the sphere of digital technologies introduction made it necessary to work out more complex and many-sided solutions on the state and regional levels of governing the national economy.
In 2017, the Russian government approved a long-term state program «The digital economy of the Russian Federation» (Program, 2017). In 2018, all program directions received their «roadmaps». 3040.4 million rubles are allocated to implement this document. Technological breakthrough represents the key strategic aim of the national economy development, the digital economy subjects received more competencies in the sphere of cyber-physical systems creation with the aim to include the Internet of things, smart cities, big data, smart production and artificial intelligence. According to forecasts, the Russian GDP has to increase by 34% from 2015 to 2025 due to the digital economy development (Khochueva et al, 2018).
Recent research results of the World Bank, devoted to evaluating the current development state of the Russian digital economy (DECA, 2018), showed that Russia is characterized by controversial tendencies. On the one hand, the country has ambitions to grow by introducing innovations, it invests in the national broadband communication network; Russia has strong scientific and technological positions, a developed legislative and regulatory framework. Russian cybersecurity sphere is also competitive in the world level. All this characterizes the country as one of the global digital leaders (DECA, 2018).
On the other hand, some principle issues have not been solved yet. They are connected to evaluating the consequences of implementing digital economy technologies in certain industries, regions and cities. In Russia, where more than 70% of the population lives in cities, one of the most urgent tasks should be the implementation of technologies, stimulating the economy, improving the management of municipal systems and the life quality (DECA, 2018). Digital technologies, alongside with the infrastructure modernization, can contribute to the elimination of technological backwardness of Russian cities, meanwhile the use of intellectual systems can create a basis for a sustainable territorial development (Harrison C. & Donnelly I.A, 2011).
Now, the country forms scientific approaches to evaluating directions of the economy’s digital transformation on all governing levels. The most interesting methodological developments are provided by the Institute of digital society development (Research, 2015), the World Bank (DECA, 2018), the Moscow school of management «SKOLKOVO» (Index, 2018; Digital life, 2016), and AO «National research institute of technologies and communication» (Indicators, 2017).
However, the drawback of the existing models is represented by their aiming at evaluating local digitalization indexes on national, regional or city scale. The research do not pay attention to studying interactions in the digital transformation model «City-Region-Country». Meanwhile, there are territorial disproportions in Russian digital transformation processes; digital technologies are unequally used on federal, regional and municipal governing levels; for example, only 10% of local government bodies comply with national digitalization demands (Indicators, 2017).
The study of unequal opportunities to use digital technologies in Russian regions and cities can become an important efficiency growth factor of the country’s economy digital transformation, along with the subsequent equalization of the territorial digital development level. So far, there has been no analysis of the territorial disproportions correlation in the evaluation process of the Russian economy digitalization level. That is why the current evaluation methods of the Russian digital economy development cannot be considered scientifically based, they demand improving.
All this defines the topicality of the research, as well as its aim and tasks.
The research aims at improving the existing evaluating methods of Russian economy digital transformation index based on introducing indicators, reflecting the digitalization features of cities and regions. The following tasks had to be solved to achieve the aim:
1. Analyzing the peculiarities of territorial digital differentiation in Russian economy;
2. Updating the evaluating indicators of digital territorial disproportions in the system «City-Region-Country»;
3. Developing an evaluation algorithm of territorial disproportions in the digital transformation model of Russian economy.
As a theoretical basis for the research, the authors used the works of Russian and foreign specialists in the sphere of applied aspects of digital economy, the existing evaluation methods of digitalization level in different public production areas, as well as legislative and regulatory documents of the Russian Federation, regulating the digital transformation process in the national economy.
The empirical information is taken from the Center of financial innovations and noncash economy of Moscow school of management SKOLKOVO, AO «National research institute of technologies and communication» (Moscow), and municipal government bodies of Perm city municipal structure.
Nowadays, the index «Digital Russia» is calculated to evaluate the digitalization level of the economy in the country in general as well as in all 85 constituent units of the Russian Federation (Index, 2018). This index is determined by the methods of Moscow school of management «SOLKOVO». The calculation results showed that there is a significant difference in the digitalization level across Federal Districts and constituent units of the Russian Federation.
Table 2
«Digital Russia» index dynamics across Federal Districts
Federal District |
Index value |
Growth rate, % |
||||
2017 г. |
place |
2018* г. |
place |
|||
1 |
Ural |
57.17 |
1 |
65.81 |
1 |
115.1 |
2 |
Central |
50.05 |
3 |
59.82 |
2 |
119.5 |
3 |
Volga |
46.93 |
4 |
59.55 |
3 |
126.9 |
4 |
North-Western |
50.90 |
2 |
58.95 |
4 |
115.8 |
5 |
Siberian |
41.91 |
7 |
53.48 |
5 |
127.6 |
6 |
Far-Eastern |
44.20 |
5 |
52.28 |
6 |
118.3 |
7 |
Southern |
43.06 |
6 |
51.35 |
7 |
119.3 |
8 |
North Caucasian |
33.37 |
8 |
43.44 |
8 |
130.2 |
* Data of 2018 provided for the first half of the year
Source: created by the authors based on (Index, 2018)
Table 2 demonstrates the «Digital Russia» index dynamics in federal districts. It is clearly seen that Ural District occupies the first place in the digitalization of the economy, while North Caucasian District takes the last place. However, the «outsider» has a faster growth rate than the leader. Volga and Siberian Districts also demonstrate a high rate of digital technologies implementation.
«Digital Russia» index values allow to identify leading and lagging constituent units of Russia, that is reflected in table 3. It shows that the digitalization figure of the leaders is twice as much as the one of the outsiders. The leaders’ deviation rate from the digitalization average is 1.45 ‒1.3 times, while it is 1.73 ‒1.41 times in the lagging constituent units. But this gap decreased in 2018, compared to 2017, demonstrating a positive trend.
Table 3
Digital transformation disproportions in Russian constituent units
Indicator |
Total average index «Digital Russia» |
|
2017 |
2018 |
|
10 digitalization leaders |
66.66 |
72.73 |
Median value |
45.92 |
55.94 |
10 digitalization outsiders |
26.62 |
39.50 |
Leaders’ deviation from the median, times |
1.45 |
1.30 |
Outsiders’ deviation from the median, times |
1.73 |
1.41 |
Difference between leaders and outsiders, times |
2.50 |
1.84 |
Note: the 2018 data are provided for the first half of the year
Source: created by the authors based on data (Index, 2018)
The methodology «Smart cities indicators of National Research Institute of Technologies and Communication (NRITC) 2017» (Indicators, 2017) was used to study the introduction of «smart city» technologies in 15 largest Russian cities with the population more than 1 million people. Table 4 presents a comparison of Russian cities with a million-plus population by the «smart technologies» implementation rate.
Table 4 proves that digital technologies penetrate «urban situation» in Russia at different levels. The «smart governing» indicators in Moscow – the leader – are more than 9 times higher than those in Samara – the outsider. The gap between the leader and the outsider in the field of «smart technologies» amounts 2.9 times, in the area of creating «smart infrastructure» it is 3.8 times, in «smart economy» it is almost 3 times, in «smart finances» this gap is 2 times, in «smart inhabitants» ‒ 1.6 times, while the difference in «smart environment» indicator is almost 6 times. The reason for these gaps is incomparable economic opportunities of «the capital» (Moscow) and most Russian cities, where per capita income is 4 times as little as in Moscow (Kupriyanovsky, 2016).
Table 4
Rating of largest Russian cities by NRITC indicators, 2017
City |
«Smart city» indicators’ value |
Average value |
City’s place |
||||||
1 |
2 |
3 |
4 |
5 |
6 |
7 |
|||
Moscow |
0.75 |
0.86 |
0.92 |
0.36 |
0.85 |
0.90 |
0.43 |
0.724 |
1 |
Sankt-Petersburg |
0.59 |
0.82 |
0.63 |
0.50 |
0.76 |
0.66 |
0.49 |
0.636 |
2 |
Novosibirsk |
0.20 |
0.56 |
0.45 |
0.38 |
0.79 |
0.69 |
1,00 |
0.581 |
4 |
Ekaterinburg |
0.38 |
0.66 |
0.38 |
0.61 |
0.81 |
0.84 |
0.29 |
0.567 |
5 |
Nizhny Novgorod |
0.15 |
0.50 |
0.34 |
0.48 |
0.72 |
0.81 |
0.18 |
0.454 |
13 |
Kazan |
0.49 |
0.56 |
0.49 |
0.74 |
0.71 |
0.79 |
0.62 |
0.629 |
3 |
Chelyabinsk |
0.18 |
0.31 |
0.44 |
0.41 |
0.70 |
0.56 |
0.68 |
0.469 |
10 |
Omsk |
0.29 |
0.30 |
0.39 |
0.35 |
0.66 |
0.57 |
0.66 |
0.460 |
11 |
Samara |
0.08 |
0.30 |
0.32 |
0.48 |
0.67 |
0.55 |
0.39 |
0.398 |
15 |
Rostov-on-Don |
0.24 |
0.54 |
0.41 |
0.31 |
0.73 |
0.55 |
0.56 |
0.477 |
9 |
Ufa |
0.28 |
0.33 |
0.47 |
0.55 |
0.61 |
0.79 |
0.45 |
0.497 |
7 |
Krasnoyarsk |
0.17 |
0.75 |
0.44 |
0.39 |
0.73 |
0.76 |
0.69 |
0.561 |
6 |
Perm |
0.30 |
0.58 |
0.39 |
0.45 |
0.64 |
0.75 |
0.24 |
0.479 |
8 |
Voronezh |
0.16 |
0.46 |
0.54 |
0.56 |
0.42 |
0.61 |
0.45 |
0.457 |
12 |
Volgograd |
0.22 |
0.44 |
0.24 |
0.25 |
0.54 |
0.63 |
0.47 |
0.399 |
14 |
Note: 1. «Smart governing», 2. «Smart technologies», 3. «Smart infrastructure»,
4. «Smart economy», 5. «Smart finances», 6. «Smart inhabitants», 7. «Smart environment».
Source: created by the authors, based on data (Indicators, 2017)
However, according to joint evaluation by experts of business schools SKOLKOVO and IESE (Spain), resource opportunities of cities largely define the development of digital supply, but have a very little influence on digital demand (Digital life, 2016). Although the digital demand grows, outruns supply and is significantly connected to the quality of life in cities (Harding A. & Blokland T., 2014).
The digital demand analysis used the information on the number of search queries in search engines Google and Yandex, connected to digital infrastructure opportunities, which people were interested to; it also evaluated the urban citizens’ activity in social networks. The digital supply analysis evaluated the level of digital infrastructure development in cities, user-friendliness of web portals and the number of electronic services. The received results were normalized taking into account the population size of the cities. This approach defined the ratio of digital supply and demand in Russian cities (table 5).
The data of table 5 show that digital transformation in cities is determined mainly by an increase in demand, whose rate more than doubled over a year, while the rate of demand was a little lower in late 2015 than in the previous year. The most remarkable decline was observed in Perm, Voronezh, Krasnoyarsk and Ekaterinburg.
Table 5
Digital supply and demand
in largest Russian cities
City |
Demand |
Supply |
Demand-supply ratio |
||||||
2014 |
2015 |
Growth rate |
2014 |
2015 |
Growth rate |
2014 |
2015 |
Growth rate |
|
Moscow |
0.46 |
0.83 |
1.80 |
0.50 |
0.75 |
1.50 |
0.92 |
1.11 |
1.21 |
Sankt-Petersburg |
0.50 |
0.90 |
1.80 |
0.61 |
0.74 |
1.21 |
0.82 |
1.22 |
1.49 |
Novosibirsk |
0.40 |
0.75 |
1.88 |
0.30 |
0.54 |
1.80 |
1.33 |
1.39 |
1.05 |
Ekaterinburg |
0.75 |
1.50 |
2.00 |
0.70 |
0.50 |
0.71 |
1.07 |
3.00 |
2.80 |
Nizhny Novgorod |
0.42 |
0.91 |
2.17 |
0.25 |
0.25 |
1.00 |
1.68 |
3.64 |
2.17 |
Kazan |
0.45 |
0.92 |
2.04 |
0.35 |
0.36 |
1.03 |
1.29 |
2.56 |
1.98 |
Chelyabinsk |
0.32 |
0.66 |
2.06 |
0.33 |
0.30 |
0.91 |
0.97 |
2.20 |
2.27 |
Omsk |
0.25 |
0.40 |
1.60 |
0.37 |
0.37 |
1.00 |
0.68 |
1.08 |
1.59 |
Samara |
0.45 |
0.46 |
1.02 |
0.35 |
0.35 |
1.00 |
1.29 |
1.31 |
1.02 |
Rostov-on-Don |
0.35 |
0.75 |
2.14 |
0.10 |
0.20 |
2.00 |
3.50 |
3.75 |
1.07 |
Ufa |
0.41 |
0.83 |
2.02 |
0.30 |
0.28 |
0.93 |
1.37 |
2.96 |
2.16 |
Krasnoyarsk |
0.50 |
0.92 |
1.84 |
0.49 |
0.34 |
0.69 |
1.02 |
2.71 |
2.66 |
Perm |
0.50 |
0.83 |
1.66 |
0.57 |
0.30 |
0.53 |
0.88 |
2.77 |
3.15 |
Voronezh |
0.20 |
0.40 |
2.00 |
0.40 |
0.19 |
0.48 |
0.50 |
2.11 |
4.22 |
Volgograd
|
0.25 |
0.40 |
1.60 |
0.18 |
0.19 |
1.06 |
1.39 |
2.11 |
1.52 |
Average value |
0.40 |
0.76 |
1.91 |
0.39 |
0.38 |
0.97 |
1.25 |
2.26 |
1.81 |
Source: created by the authors based on data (Digital life, 2016)
The excess of the average in eight cities represents an important disproportion indicator in the digital demand and supply dynamics. They are Ekaterinburg, Nizhny Novgorod, Kazan, Chelyabinsk, Ufa, Krasnoyarsk, Perm, and Voronezh. The growing gap between supply and demand demonstrates undeveloped local digital entrepreneurship and a weak reaction of federal network players (banks, retailers, etc.) as well as local authorities on urban digital demand peculiarities (Shvetsov, 2014).
The authors put forward three hypotheses based on the analysis of digital technologies’ development in Russian constituency units and largest cities between 2014 ‒ 2018:
The research showed that Russia has achieved a certain progress in the development of «primary» (point) digitalization of the economy not only on federal and regional levels, but also in separate urban settlements, especially in largest cities. If Russia moves to the «second» digitalization stage, connected to forming integral multi-dimensional digital eco-systems in the economy (Newsom,2013; Piketty, 2014; Belyatskaya, 2016), it will need a considerable transformation of the current digital technologies’ introduction model.
Figure 1
Evaluating algorithm of territorial inequalities
in Russian digital transformation model
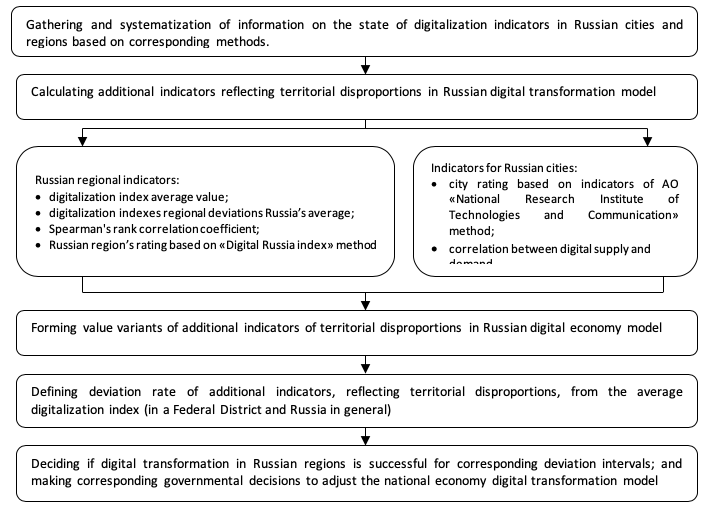
Source: authors’ own development
The analysis of «digital gap» in the use of modern technologies across Russian territories can become an important instrument, providing a growth of general digitalization level of the national economy and reducing significant disparities in resource opportunities in the «capitals» and the «regions».
Picture 1 represents the evaluating algorithm of territorial inequalities in Russian digital transformation model, developed by the authors.
Table 6
Ways to improve existing evaluation methods
of Russian economy digital transformation level
Method’s title |
Method’s purpose |
Method’s drawbacks |
Recommendations on method’s improvement |
(Индекс, 2018 «Digital Russia index» (Index, 2018) |
Expert evaluations of introducing digital economy technologies in Russian constituent units |
Regional disproportions in Russian digital transformation model are not studied |
Add indicators, reflecting interaction in the system «region-country» in Russian digital transformation model |
«Smart cities indicators of NRITC» (Indicators, 2017) |
Working out of evaluation indicators for «smart city» technologies development level in largest Russian cities |
It does not reflect the impact of «smart city» technologies development on the digitalization level of Russian constituent units |
Add indicators, reflecting interaction in the system «region-country» in Russian digital transformation model |
«Digital life of Russian cities with a million-plus population» (Digital life, 2016) |
Measuring the secondary digitalization rate in largest Russian cities, measuring the development of digital demand and supply |
России It does not contain the correlation between digital demand and supply in Russian largest cities |
Add calculation of digital demand and supply ratio as an adjustment indicator of city’s digitalization influence on the digital transformation level of Russian constituent units |
Source: authors’ own development
The following things are considered necessary to improve existing methods of Russian economy digital transformation level (table 6) with the aim to find and eliminate territorial disproportions:
Table 7 demonstrates possible evaluation indicators variants of territorial disproportions in the analysis of national economy digital transformation exemplified by Russian Federal Districts.
Table 7
Evaluation of Federal Districts’ indicators influence
on Russian digital transformation level
Federal District |
Digitalization index value |
Deviation from the average |
|||
2017 |
2018 |
2017 |
2018 |
||
1 |
Ural |
57.17 |
65.81 |
11.22 |
10.22 |
2 |
Central |
50.05 |
59.82 |
4.1 |
4.23 |
3 |
Volga |
46,93 |
59.55 |
0.98 |
3.96 |
4 |
North-Western |
50.9 |
58.95 |
4.95 |
3.36 |
Total deviations from the average |
|
|
+21.25 |
+21.77 |
|
Average index value |
45.95 |
55.59 |
0.00 |
0,00 |
|
5 |
Siberian |
41.91 |
53.48 |
4.04 |
2.11 |
6 |
Far-Eastern |
44.2 |
52.28 |
1.75 |
3.31 |
7 |
Southern |
43.06 |
51.35 |
2.89 |
4.24 |
8 |
North Caucasian |
33.37 |
43.44 |
12.58 |
12.15 |
Total deviations from the average |
|
|
-21.26 |
-21.81 |
|
Source: Made by the authors based on data (Index, 2018)
Table 7 shows that Federal Districts are equally distributed relating to index average. Positive and negative deviation totals were close to absolute values in 2017 (21.25-21.26), while deviations grew and the gap between change poles increased in 2018 (21.77-21.81). The deviation dynamics tells about growing digital disproportions in the regions. According to our results, Spearman’s coefficient amounted (-3.2) in 2017 and (-2.9) in 2018. Thus, the regions influence negatively on the total digitalization index of Russia. Similar calculations can be done for all Russian constituent units.
Table 8 shows data, confirming the interconnection between the development of digital technologies in cities and integral digitalization index in a respective region.
Table 8
Interconnection of digitalization level
of largest Russian cities and regions
City |
NRITC index 2017 |
City’s place |
Demand and supply ratio |
Territory of the city’s location |
Digital Russia index, 2018 |
Territory’s place |
Moscow |
0.724 |
1 |
1.21 |
Moscow region |
71.86 |
7 |
Sankt-Petersburg |
0.636 |
2 |
1.49 |
Leningrad region |
71.25 |
9 |
Каsan |
0.629 |
3 |
1.98 |
the Republic of Tatarstan |
74.74 |
2 |
Novosibirsk |
0.581 |
4 |
1.05 |
Novosibirsk region |
69.5 |
12 |
Ekaterinburg |
0.567 |
5 |
2.80 |
Sverdlovsk region |
59.19 |
36 |
Krasnoyarsk |
0.561 |
6 |
2.66 |
Krasnoyarsk krai |
59.82 |
35 |
Ufa |
0.497 |
7 |
2.16 |
the Republic of Bashkortostan |
71.29 |
8 |
Perm |
0.479 |
8 |
3.15 |
Perm krai |
67.22 |
19 |
Rostov-on-Don |
0.477 |
9 |
1.07 |
Rostov region |
69.10 |
14 |
Chelyabinsk |
0.469 |
10 |
2.27 |
Chelyabinsk region |
70.75 |
10 |
Omsk |
0.460 |
11 |
1.59 |
Omsk region |
56.67 |
40 |
Voronezh |
0.457 |
12 |
4.22 |
Voronezh region |
68.51 |
15 |
Nizhny Novgorod |
0.454 |
13 |
2.17 |
Nizhegorodsky region |
57.34 |
39 |
Volgograd |
0.399 |
14 |
1.52 |
Volgograd region |
58.42 |
38 |
Samara |
0.398 |
15 |
1.02 |
Samara region |
67.87 |
17 |
Source: created by the authors based on data (Digital life, 2016; Indicators 2017; Index, 2018)
As indexes show, the higher the city’s place in the digital sphere, the higher place the region occupies among 85 Russian constituent units. However, some cities do now show this correlation. For example, the last (15th) place of Samara among largest cities according to NRITC index corresponds to the 17th place of Samara region among 85 Russian constituent units. At the same time, the 5th place of Ekaterinburg correlates with only 36th position of Sverdlovsk region, while the 14th place of Volgograd corresponds to the 38th place of Volgograd region according to regions’ rating on «Digital Russia» index. It is obvious that an additional factor influences these disproportions, which adjusts the digitalization dependence in the «City-Region» system. In our mind, this factor can be the demand and supply ratio on using digital technologies.
The first stage of cities’ digital transformation was connected to all-around provision of access to the Internet, digitalization of certain city economy spheres, transport, financial payments, retailing, healthcare, education, mass media and participation in governing, people’s habituation to digital services (Hernández-Muñoz, 2011). Nowadays in big cities, citizens mostly demand the creation of cyberphysical systems, which have a «network effect», aimed at increasing value for users (Christensen, 2012; Sheth et al, 2013). These processes, creating a new quality of life in cities, can be called «secondary digitalization». Measuring demand and supply ratio will allow to determine gaps between them, marking possible interaction areas for business and administration.
In a «smart city» digital demand and supply are balanced, market players answer the development of consumers on time, and consumers, in turn, quickly learn habits and skills of using new digital opportunities. In a «smart city» the demand and supply ratio equals 1:1, but the time of a full digital demand and supply harmony has not come yet. On the other hand, these are the demand and supply gaps that can show businesses, local and regional authorities the directions for potential efficiency growth from digital technologies introduction. The quantitative statement of these proportions can be viewed as an adjusting element of the city and region interaction model. A careful study of table 8 demonstrates that when the digital technologies demand and supply ratio approximates the optimal model, it influences cities’ and regions’ rating. When the ratio grows, the digitalization quality gets worse, cities’, and regions’ rating decrease. Samara represents the most striking example of this trend.
Three hypotheses were put forward to study the digital transformation model «city-region-country» and improve methods of their evaluation. They disclose digitalization interconnections at all governmental levels.
The research results recommend updating the calculation method for «Digital Russia» index by adding indicators, characterizing deviations of regional indexes from the median digitalization level in the country in the analyzed period, and the calculation of Spearman’s rank correlation coefficients. These indicators show growing regional disproportions and allow to evaluate the efforts of regional interested parties in digital technologies development, proving the validity of the first hypothesis.
The second hypothesis proved partly true. This means that an increase in the digitalization level in largest cities contributes to improving regions’ activities on digital technologies introduction. But it also depends on a range of additional factors, that prevent their efficient digital development. The challenges include a high wear and tear level of the main city infrastructure; budget deficit for solving current tasks of cities’ functioning as well as the strategic development ones; a rise in ecological pressure on cities; growing demands of citizens to the quality of city environment and security; the change in demands of business to the whole range of city services; operational efficiency and purposefulness of local authorities.
The influence of these factors can be integrated into the indicator of digital supply and demand growth rate ratio. The quantitative statement of this ratio can be considered as an adjustment element for the city and region interaction model. The approximation of digital technologies supply and demand ratio to the optimal model (1:1) influences cities’ and regions’ ratings, that proves the validity of the third hypothesis. We suggest to include this indicator into the system of indicators to evaluate «smart city» technologies development.
Consulting and expert organizations can use the developed methodological approaches to evaluation of territorial disproportions of the digital transformation process in Russian economy when working out and analyzing spatial digital programs and projects. Governmental authorities can also use them when working out socio-economic policy and development strategy for Russian constituent units.
The research is conducted with the financial support of the Russian Foundation for Basic Research (RFBR) in the frames of the scientific project № 18-010-00955 «The development of models to manage cyberphysical organizations».
Analysis of the current digital economy development stage in the Russian Federation (DEGA). (2017). World Bank, Institute of the information society, October 2017. Retrieved from: http://documents.worldbank.org/curated/en/848071539115489168/pdf/AUS0000158-RUSSIAN-WP-REVISED-P160805-PUBLIC-Disclosed-10-15-2018.pdf (accessed February 15, 2019)
Basaev Z. V. (2018). The digitalisation of the economy: Russia in the context of global transformation. The World of new economy, 12(4), 32-38. DOI: 10.26794/2220-6469-2018-12-4-32-38
Belyatskaya T.N. (2016). The global electronic economy concept/ T.N. Belyatskaya// Electronic economy: theory, models, and technologies/ under general editorship of T.N. Belyatskya, L.P. Knyazeva (p.252). Minsk: BSUIR.
Cagnin, C., Havas, A., & Saritas O. (2013). Future-oriented technology analysis: Its potential to address disruptive transformations. Technological Forecasting and Social Change, 80, 379–385. Available at: http://publications.jrc.ec.europa.eu/repository/handle/JRC 77930. (accessed February 15, 2019).
Christensen T. (2012). Post-NPM and changing public governance. Meiji Journal of Political Science and Economics, 1, 1–11.
Competing in the digital age: policy implications for the Russian Federation (DEGA). Russia digital economy report (2018). (р. 144). Вашингтон: Publishing and Knowledge Division, The World Bank. Retrieved from: http://documents.worldbank.org/curated/en/848071539115489168/Competing-in-the-Digital-Age-Policy-Implications-for-the-Russian-Federation-Russia-Digital-Economy-Report (accessed February 15, 2019)
Digital life of Russian cities with a million-plus population. Model. Dynamics. Examples. (2016). (р. 94). Moscow: SKOLKOVO Institute for Emerging Market Studies Retrieved from: http://www.globalinnovationindex.org/ (accessed March 10, 2018)
Dobrynin A. et al. (2016) The digital economy – the various way to the effective use of technology (BIM, PLM, CAD, IOT, BIG DATA and others). International Journal of Open Information Technologies, 4(1), 21-26
Hamilton D. S. (2017). The Transatlantic Digital Economy 2017: How and Why it Matters for the United States, Europe and the World Washington (p. 128). DC: Center for Transatlantic Relations. Retrieved from: https://archive.transatlanticrelations.org/wp-content/uploads/2017/05/TDE-2017.pdf (accessed March 02, 2019)
Harding A., Blokland T. (2014). Urban Theory. A Critical Introduction to Power, Cities, and Urbanism in the 21st Century. (p. 294). London: Sage.
Hernández-Muñoz J. M. (2011). Smart cities at the forefront of the future internet. (р. 480). Berlin: Springer Berlin Heidelberg.
Index «Digital Russia». The reflection of Russian constituent units’ digitalization through the prism of open sources. October 2018. Retrieved from: http:// finance.skolkovo.ru (accessed March 04, 2019).
Jeschke, S., Brecher, C., Song, H. & Rawat, D.B. (2017). Industrial Internet of Things: Cybermanufacturing Systems. (р. 650). Switzerland: Springer International Publishing
Kapranova L.D. (2018). The digital economy in Russia: its state and prospects of development. Economics, Taxes and Law, 2, 58-69
Khochueva F.A., Shugunov T.L., Zhukov A.Z., Ingushev Ch.Kh. (2018). Information security through the prism of the digital economy Modern high technologies, 11(1), 65-67. Retrieved from: http://www.top-technologies.ru/ru/article/view?id=37239 (accessed February12, 2019).
Kupriyanovsky V.P. et al. (2016). Smart Cities as the «capitals» of the Digital Economy. International Journal of Open Information Technologies, 4(2), 41-52
Newsom G. (2013). Citizenville: How to Take the Town Square Digital and Reinvent Government (р. 249). New York: Penguin Press.
Piketty Т. (2014). Capital in the Twenty-First Century. (р. 696.) Cambridge (Massachusetts) and London (England): Harvard University Press.
Program «Digital economy of the Russian Federation», approved by the government order from 28 July 2017 № 1632-р. Retrieved from: http:// static.government.ru (accessed January, 23, 2019).
Sheth A., Anantharam P., Henson C. (2013). Physical-cyber-social computing: An early 21st century approach. IEEE Intelligent Systems, 28(1), 78-82
Shvetsov A.N. (2014). "Digital" inequality of the Russian cities and regions: evaluation methods and adequation policy. Outlines of global transformations: politics, economics, law, 3, 51-63.
Smart cities indicators NRITC-2017. (2017) Moscow: AO «National Research Institute of Technologies and Communication». Retrieved from: http://niitc.ru/ (accessed February 20, 2019).
The research of differentiation processes in Russian regions in the sphere of managing information society development, working out recommendations how to solve the inequality problem of Russian constituent units and what methods need to be used to monitor regional informatization (2014). Moscow: Institute of the information society. Retrieved from:http://www.iis.ru/projects/ (accessed February 15, 2019)
1. Candidate of economic sciences, associate professor, Department of management, Perm State National Research University, Russian Federation, e-mail: reader1201@rambler.ru
2. Candidate of economic sciences, associate professor, Department of management, Perm State National Research University, Russian Federation, e-mail: atvpsu@yandex.ru
3. Doctor of economics, professor, Department of management, Perm State National Research University, Russian Federation, e-mail: prudskiy.v.g@mail.ru