![]() ISSN 0798 1015
ISSN 0798 1015

![]() ISSN 0798 1015
ISSN 0798 1015
Vol. 40 (Number 25) Year 2019. Page 27
PANI Rojalin 1; BEHURA Debdutt 2; MISHRA Uma Sankar 3 & BISWAL Saroj Kanta 4
Received: 16/04/2019 • Approved: 11/07/2019 • Published 22/07/2019
ABSTRACT: This study proposes a time series analysis approach ARIMA (Auto Regressive Integrated Moving Average) model to predict weekly groundnut prices for the state of Odisha, India during January to December, 2019. Price data has been taken i.e from January 2004 to December 2018 from AGMARKNET website. Using MAPE and RMSE criterion the fitted model is considered as suitable for price forecasting. The result showed that the price will remain stable throughout the year. Result of the study is beneficial for farming community and other related stakeholders. |
RESUMEN: Este estudio propone un modelo de ARIMA (Media móvil integrada regresiva automática) para el análisis de series de tiempo para predecir los precios semanales de cacahuetes para el estado de Odisha, India, de enero a diciembre de 2019. Se tomaron datos de precios, es decir, de enero de 2004 a diciembre de 2018 de AGMARKNET. sitio web. Con el criterio de MAPE y RMSE, el modelo ajustado se considera adecuado para la previsión de precios. El resultado mostró que el precio se mantendrá estable durante todo el año. El resultado del estudio es beneficioso para la comunidad agrícola y otras partes interesadas relacionadas. |

Groundnut constituted 34 percent of the total oilseed acreage in the state of Odisha contributing more than 68 percent of the total oilseeds produced in the state during the triennium ending 2017-18.
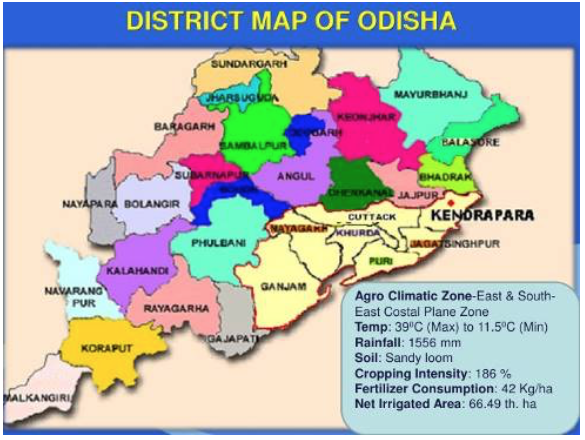
Groundnut as a cash crop has been losing its shine in Odisha mainly because of lack of timely availability of quality seeds and high price volatility. Area allocation to groundnut in the state during the last two and half decades declined from 318 thousand hectares during triennium ending 1995-96 to 210 thousand hectares in 2017-18 registering negative growth of 0.93 percent per annum. Production of groundnut declined from 4.66 to 3.74 lakh tons during the same period. However, productivity of the crop has increased from 1465 kg/ha to 1783 kg/ha (different issues of Odisha Agricultural Statistics). Groundnut is grown in the state during kharif (the autumn crop sown at the beginning of the summer rains) as well as rabi (the grain crop sown in September and reaped in the spring) season. Area under rabi groundnut comprises of 67 percent of the total groundnut area and is mostly rainfed. Major decline in area was observed in kharif season where area decreased from 164 thousand hectares in 1993-94 to 65 thousand hectares in 2017-18. Rabi area under the crop declined from 166 thousand hectares to 133 thousand hectares during the period. Among the districts, Bargarh registered largest decline in area from about 50 thousand hectares to 20.6 thousand hectares during the period. In fact all the major groundnut producing districts viz., Bolangir, Cuttack, Jagatsinghpur, Jajpur, Kendrapara, Dhenkanal, Angul, Ganjam and Bargarh experienced major shift in area allocation against groundnut during the period (figure 1). Some of the non-traditional districts like Balasore, Subarnapur, Kalahandi, Kandhmal, Boudh, Keonjhar, Koraput, Nawarangpur, Deogarh and Mayurbhanj registered minute area escalation under the crop. Decline in area has been mainly attributed to unstable market and high price fluctuations.
Figure 1
Agricultural Map of Odisha, India
Productivity of groundnut in Odisha is lower than the country’s average yield and scope for further increase is high. Non-adoption of improved technology, timely availability of quality seed and lack of awareness about market intelligence makes farmers suffer (Mohapatra et al. 2018). Timely forecasting of groundnut price information will help the groundnut farmers to a great extent in deciding their area allocation to groundnut.
Groundnut price of Odisha depends mainly upon major markets of Jajpur. The state wise groundnut wholesale price is controlled by majority of groundnut growing areas in the state. The groundnut price in the state is influenced by a minute fluctuation in price in the major markets. So volatility can be managed to a great extent by effective price forecasting. Limited research evidences are found where forecasting of groundnut price has been prescribed to farmers ahead of their area allocation to groundnut with relation to pre-sowing and pre-harvesting seasons which is very crucial for farmers to take necessary decisions. A weekly forecasting of price is very much essential to meet the requirement of taking decisive farming decisions. Hence, appropriate method of forecasting of prices of agricultural commodities at weekly basis before sowing and harvesting is planned to make stake holders reap major benefits at price front.
Time-series model is a significant statistical analysis practice used as a basis for manual and spontaneous scheduling in many presentation domains and is an major tool in forecasting future event (Gooijer and Hyndman, 2006). “Forecasts are calculated using mathematical models that capture a parameterized relationship between past and future values to express the behaviour and characteristics of a historic time series.” (Mitra et al. 2017).
The aim of the present study is to predict and forecast weekly price of groundnut in Odisha market. The study is trying to solve the research questions like: Does appropriate information in right time for right people lead to better efficiency and whether weekly price forecasting is efficient than monthly price forecast? As the price volatility of groundnut creates risks to producers, suppliers, consumers and other stake holders; it is important to forecast groundnut price at weekly basis in-order to diminish the error term. This study applies ARIMA technique which is very popular in various fundamental researches. The application of this technique is very limited in agriculture sector due to lack of data, weather fluctuation, pest attack, natural calamity etc.
Pani et al. (2019) compared weekly greengram price forecasting for the state of Odisha in India with the help of APE criteria. Study revealed that GARCH model was out performed the SARIMA model hence forecasting was done using GARCH model for three months. Mohapatra et al. (2018) forecasted Odisha groundnut monthly price using ARIMA (1, 1, 1) (1, 0, 1) model and indicated that the fitted model was suitable for forecasting price of groundnut in Jajpur district. Mitra, D. (2017) established time series model for forecasting oilseed and pulses price in India. Darekar et al. (2017) forecasted price of common paddy for India by using ARIMA technique. Applying ARIMA model Darekar and Reddy (2017) forecasted kharif paddy price of India from September to November 2017-18; and performance was measured testing AIC, BIC and MAPE and found that ARIMA model was the most illustrative model for price forecasting of paddy at all India level. Darekar and Reddy (2017) using Box-Jenkins ARIMA modelling method, forecasted pigeon pea price in India for the period November to January 2017-18 and tested reliability of model using goodness of fit methods like MAPE, AIC and BIC and the forecasted values of prices indicated an upward trend in months coming ahead. Darekar and Reddy (2017) have attempted forecasting of soybean price in India by using ARIMA approach and performance of model got tested using AIC, SBC and MAPE approach and suggested that the ARIMA model was the most representative model for forecasting soybean prices at all India level as well as the in the soybean producing states which would help farmers, processors and tradeINR Rs. Darekar and Reddy (2017) forecasted cotton price in India using ARIMA modelling method and performance got measured using AIC, SBC and MAPE approach and predicted increase in prices as well as area allocation to cotton in major cotton producing states of India. Darekar and Reddy (2017) using ARIMA model forecasted the maize price in India and proposed farmers to increase acreage under maize wherever suitable as the forecasted maize price during harvesting season in Indian market from September to December 2017-18 seems to be increasing. Panasa et al. (2017) forecasted maize monthly modal prices in Telangana, India using ARIMA model with the help of SAS 9.3 software and advocated that there would be increasing trend in maize price in Badepalli market in future. Jadhav et al. (2017) forecasted prices of maize, ragi and paddy of Karnataka state of India for the period September, 2016 to August, 2020 and found that forecasted prices of selected commodities were almost similar to actual prices which validated the findings. Evaluation of forecast was done using the criteria of MSE, MAPE and Theils U coefficient criteria. Ramanujam and Viswanathan (2018) examined various methods for forecasting prices of black pepper price in India and established that ARIMA model is the best fit with unbiased estimates of forecasts. Darekar and Reddy (2018) forecasted mustard prices in major mustard producing states of India and found that ARIMA (0, 1, 0) (0, 1, 1) is the most appropriate model to foretell future prices of mustard. Darekar and Reddy (2018) forecasted wheat price in India and ascertained that ARIMA (0, 1, 1) (0, 1, 1) model is most appropriate for forecasting wheat future prices with 95 percent accuracy level.
The longitudinal price series data of groundnut for the current study is collected from secondary sources i.e. AGMARKNET website. The analysis carries 708 data points. The collection period of historical data points are from January, 2004 to December, 2018 to conduct forecasting of groundnut prices in Odisha. The data points have been assembled as per the availability. The weekly price forecasting is done for the year 2019. The sowing and harvesting months for kharif groundnut in Odisha is June and October respectively, and for Rabi groundnut sowing and harvesting months are October and February respectively. Here forecasting for the whole year has been done to help farmers as well as traders to take timely decision. Before different models of ARIMA were fitted, Normality and Stationarity test were carried out to the data series.
The seasonal ARIMA (1, 1, 1) (2, 1, 1) S=4 model is best fitted for forecasting of groundnut price as study reveals (Table 1 and Table 2).
Normality test of the data series was carried out prior to run the model for forecasting of groundnut prices in Odisha. Figure 2 depicts the normality test through JB-Test statistics.
Figure 2
Normality Test
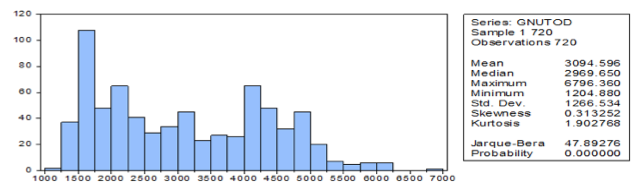
The figure clearly reveals that the curve is skewed positively as the value of skewness is 0.31; which is supposed to be zero. The value of 1.90 under Kurtosis analysis indicates that the price series is platykurtic as it is less than 3. The data series are found to be not normally distributed.
Since the data series was found to be non normal, Augmented Dickey Fuller (ADF) test was done to make the series stationary. The results presented in Table 1 indicates the series was made stationary at 1st order difference with P-value of 0 and 1% level of significance. The trend component of the data was removed making it suitable for price forecasting.
Table 1
Augmented Dickey Fuller Test statistics
for Stationarity of data series
ADF test Statistics |
t-Statistic |
Prob.* |
-14.7829 |
0.0000 |
|
1% level |
-3.43937 |
|
5% level |
-2.86541 |
|
10% level |
-2.56889 |
ARIMA has three parts like Auto Regressive (AR), Integrated (I) and Moving Average (MA).
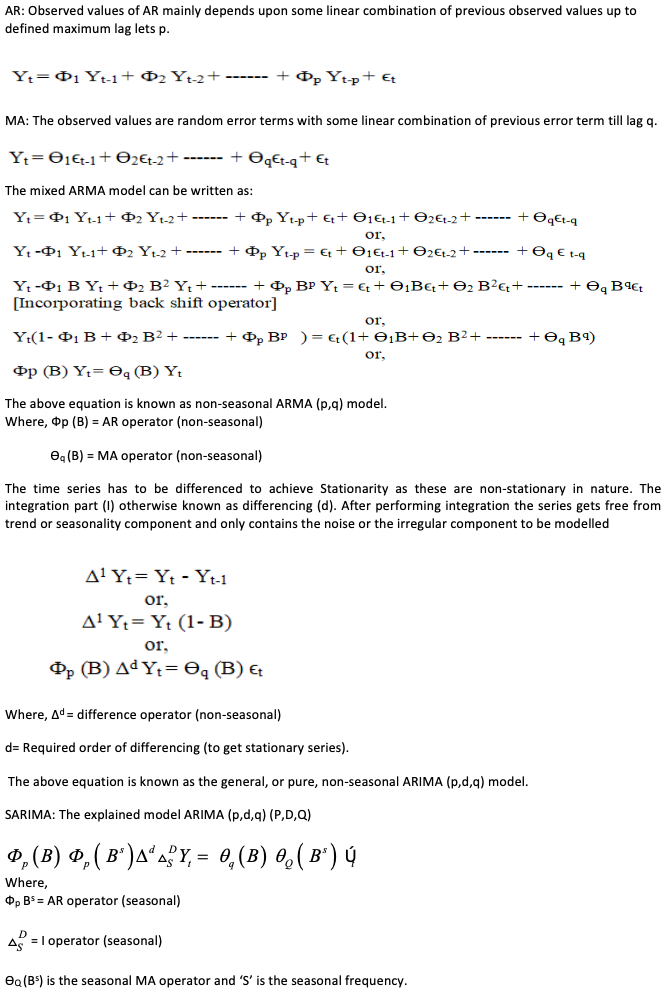
Before identifying seasonal ARIMA model non-seasonal (p,d,q) (p-Auto Regressive, d-Integrated, q-Moving Average) part is identified and the results are depicted in Table 2.
Table 2
ARIMA Model Identification
ARIMA |
Akaike Info Criterion (AIC) |
Schwarz criterion (SC) |
1,1,1 |
15.14615 |
15.15889 |
2,1,1 |
15.36882 |
15.38157 |
2,1,2 |
15.20976 |
15.22251 |
2,1,4 |
15.59813 |
15.61087 |
2,1,5 |
15.59022 |
15.60297 |
3,1,1 |
15.66011 |
15.67287 |
3,1,2 |
15.74667 |
15.75943 |
3,1,3 |
15.23099 |
15.24375 |
3,1,4 |
15.69751 |
15.71027 |
3,1,5 |
15.71792 |
15.73068 |
Out of the 24 ARIMA models tested for non-seasonal component, 10 consecutive models with 0 probabilities were found as suitable and presented in Table 2. The ARIMA model (1, 1, 1) is nominated since it is having the lowermost AIC and SC values. Afterwards seasonality test was performed and results are presented in Table 3.
Table 3
Parameters and Chosen Degree of Forecast Performance
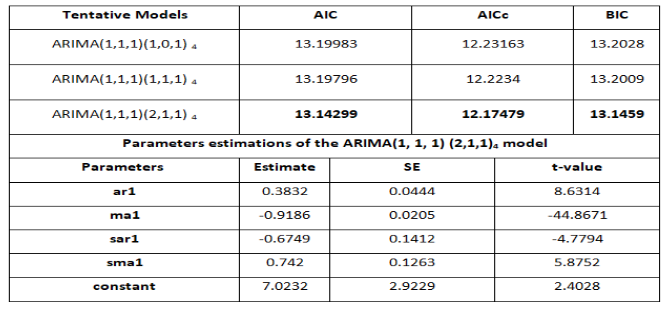
“The ARIMA model (1,1,1,) (2,1,1)4 is selected based upon considering the lowest AIC, AICc and BIC values; by comparing similar and close ARIMA models - ARIMA(1,1,1)(1,0,1)4, ARIMA(1,1,1)(1,1,1)4, and ARIMA(1,1,1)(2,1,1)4 those satisfies the conditions like the sample autocorrelation coefficients of the residuals are within the limits and Ljung – Box tests.” (Box, G. E.P, et. al, 2015).
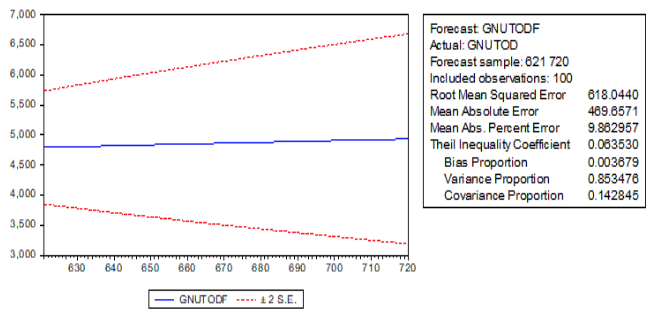
MAPE Validation: The observed MAPE of the Odisha market groundnut price was 9.86 (Figure: 3). The lower value indicates that the model is less erratic in context that actual value and forecasted values were very much close.
RMSE Validation: Standard deviation of the residuals is known as Root Mean Square Error (RMSE). RMSE measures the distance between regression line and the data points. In brief RMSE tells how the data is concentrated around the best fit line. RMSE for groundnut price in Odisha market was observed as 618.04 (Figure: 3).
Figure 3
Error Identification
Seasonal Index: Seasonal movements are the periodic and regular movements in time series with period less than one year. Hence, daily, weekly, monthly, quarterly and half-yearly periodic movements can be studied from time series data by segregating seasonal effect. However, in the current study, only monthly seasonal indices are constructed to know the price movements across the years and presented in Table 4. It reveals that highest index was observed in the month of October which is 107.75 and the lowest index of 91.76 was observed in the month of March.
Table 4
Seasonal index of groundnut price in Odisha
Months |
Seasonal Index |
January |
101.6067 |
February |
92.55056 |
March |
91.76453 |
April |
99.81975 |
May |
95.8941 |
June |
98.9259 |
July |
95.50945 |
August |
96.28503 |
September |
99.06059 |
October |
107.7482 |
November |
100.0891 |
December |
101.9108 |
Forecasting: To forecast future groundnut prices that would be prevailed for the state of Odisha during the year 2019, ARIMA (1, 1, 1) (2, 1, 1)4 model was identified and used as forecasting instrument and results are depicted in Table 5.
Table 5
Weekly Price forecasting of Groundnut
in Odisha(India) for the year of 2019
Months |
Weeks |
Price INR Rs./Qtl |
Months |
Weeks |
Price INR Rs./Qtl |
January |
1st |
4830 |
July |
1st |
4775 |
2nd |
4945 |
2nd |
4920 |
||
3rd |
4940 |
3rd |
4790 |
||
4th |
4805 |
4th |
4845 |
||
February |
1st |
4740 |
August |
1st |
4795 |
2nd |
4720 |
2nd |
4905 |
||
3rd |
4535 |
3rd |
4760 |
||
4th |
4619 |
4th |
4830 |
||
March |
1st |
4555 |
September |
1st |
4780 |
2nd |
4805 |
2nd |
4925 |
||
3rd |
4625 |
3rd |
4775 |
||
4th |
4795 |
4th |
4865 |
||
April |
1st |
4760 |
October |
1st |
4820 |
2nd |
4900 |
2nd |
4955 |
||
3rd |
4805 |
3rd |
4820 |
||
4th |
4815 |
4th |
4890 |
||
May |
1st |
4755 |
November |
1st |
4835 |
2nd |
4835 |
2nd |
4965 |
||
3rd |
4680 |
3rd |
4825 |
||
4th |
4750 |
4th |
4895 |
||
June |
1st |
4695 |
December |
1st |
4845 |
2nd |
4870 |
2nd |
4985 |
||
3rd |
4710 |
3rd |
4840 |
||
4th |
4820 |
4th |
4820 |
Table 5 reveals that the forecasted prices for groundnut in Odisha will vary from INR Rs.4535-4945/qtl, INR Rs.4680-4900/qtl, INR Rs.4760-4925/qtl and INR Rs. 4820-4985/qtl respectively for the periods January - March, 2019, April - June, 2019, July - September and October - December. The result indicates that the price will remain stable throughout the year. Data plot analysis of the time series has been presented in Figure 4.
Figure 4
Test Results for Forecasting Model
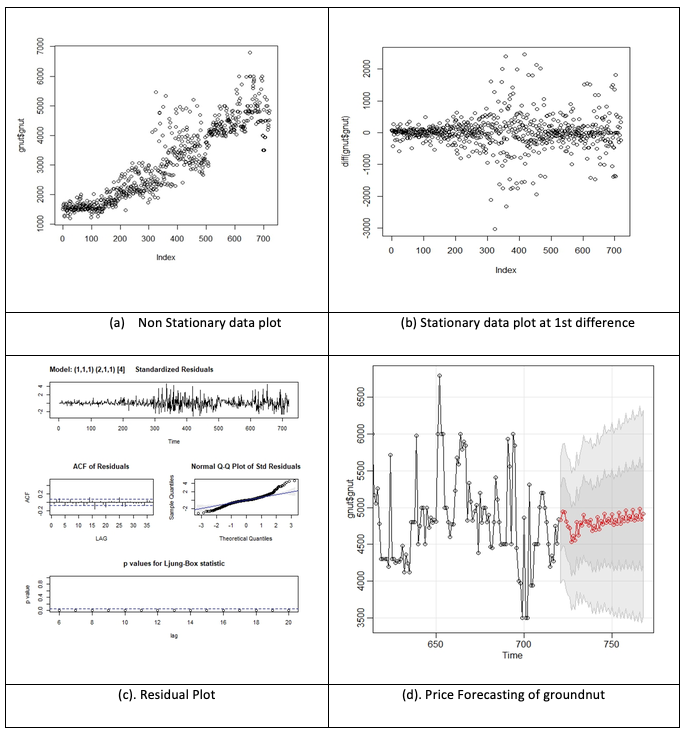
Figure 4 (a) shows the non-stationary data plot of the level data whereas, data plot of stationary series has been given in figure 4 (b). Residual plot and Price forecasting of groundnut graph has been given in figure 4 (c) and figure (d) respectively. It reveals that the historical data of groundnut prices for Odisha has been made stationary after taking 1st order difference.
The study reveals that the price of groundnut in Odisha remains constant. Farmers are advised for enhanced area allocation in order to maximize their return. Forecasting prices of groundnut for the entire season will certainly help farmers to take appropriate decisions during pre-sowing (whether to go for higher area allocation) and post-harvesting (to store or sale immediately the harvested crop). Necessary steps should be taken by Government for timely dissemination of forecasted price at farmers’ end to make the farmers reap maximum benefit. The study area is confined to Odisha region. Future research work can be taken to predict price on monthly basis as well as daily basis. Forecasting prices of several perishable and non-perishable agricultural commodities can be done by applying this technique. Analysis may be done to establish relations among markets across different states in the country to establish whether the markets are integrated or not.
Agricultural and Processed Food Products Export Development Authority. Available from: http://apeda.gov.in/apedawebsite/. Available from: https://www.news18.com/news/india/icar-to-make-odisha-hub-of-groundnut-production-417515.html.
Box, G. E., Jenkins, G. M., Reinsel, G. C., &Ljung, G. M. (2008). Time Series Analysis: Forecasting and Control John Wiley & Sons. Hoboken, NJ.
Darekar A and AA Reddy (2018). Oilseeds Price Forecasting: Case of Mustard in India. Agricultural Situationin India..
Darekar A, Reddy A (2017). Forecasting of common paddy prices in India, Journal of Rice Research, Vol 10 No. 1. http://www.icar-iirr.org/journal%202017-10-13.pdf.
Darekar A, Reddy AA. (2017). Predicting market price of soybean in major India studies through ARIMA model, Journal of Food Legumes, 30(2): 73-76.
Darekar A, REddy AA. (2018). Forecasting wheat orifices in India. Wheat and Barley Research.;10(1).
Darekar A, Reddy AA.( 2017). Price forecasting of maize in major states, Maize Journal.
Darekar, A., & Reddy, A. (2017). Forecasting of common paddy prices in India. Journal of Rice Research, 10(1), 71-75.
Darekar, A., & Reddy, A. A. (2017). Cotton Price Forecasting in Major Producing States. Economic Affairs, 62(3), 373-378 Print ISSN : 0424-2513, Online ISSN : 0976-4666.
DAREKAR, A., & REDDY, A. A. (2017). Price forecasting of pulses: case of pigeonpea. Journal of Food Legumes, 30(3), 42-46.
Dash A, Dhakre DS, Bhattacharya D. (2017). Forecasting of food grain production in Odisha by fitting ARIMA model. Journal of Pharmacognosy and Phytochemistry.;6(6):1126-http://www.phytojournal.com/archives/2017/vol6issue6/PartP/6-5-541-759.pdf.
De Gooijer JG, Hyndman RJ. (2006). 25 years of time series forecasting. International journal of forecasting. Jan 1;22(3):443-73.
Departmet of Agriculture Cooperations and Farmers Welfare. Ministry of agriculture & farmers Welfare. http://agricoop.nic.in/recentinitiatives/minimum-support-prices-msp-and-bonus-kharif-crops-2017-18-season.
Dhakre DS, Bhattacharya D. (2014).Statistical investigation of price behaviour of potato in Agra, Indian Research Journal of Extension Education. 14 (2):12-15. Available from: < https://www.seea.org.in/vol14-2-2014/03.pdf>. Accessed: July. 20, 2018.
Directorate of Marketing & Inspection (DMI), Ministry of Agriculture and Farmers Welfare, Government of India. Available from: http://agmarknet.gov.in/.
Dr V Ramanujam and Dr T Viswanathan. (2018). An Empirical Analysis of Forecasting Volatility of Pepper Price in the Spot Market in India. Research Gate.
Gaddi GM, Reddy BV, Jadhav V.( 2018). Application of ARIMA Model for Forecasting Agricultural Prices. J. Agr. Sci.Tech.Vol.19:981992.
GOI (2008) Economic Survey of India 2008, Government of India, New Delhi.
ICAR to make Odisha hub of groundnut production. (2011). News 18. November.
Maps of India. (2017). https://www.mapsofindia.com/top-ten/india-crops/cotton.html.
Mitra D, Paul RK, Pal S. Hierarchical. (2017). Time-series models for forecasting oilseeds and pulses production in India. Economic AffaiINR Rs. Mar 1;62(1):103. DOI: 10.5958/2230-7311.2017.00045.9.
Mohapatra S, Mohapatra U, Mishra RK. (2018). Price forecasting of groundnut in Odisha. The Pharma Innovation Journal 2018; 7(3): 111-114. Available from: <http://www.thepharmajournal.com/archives/2018/vol7issue3/PartB/7-2-33-193.pdf>.
Panasa V, Kumari RV, Ramakrishna G, Kaviraju S. Maize. (2017). Price Forecasting Using Auto Regressive Integrated Moving Average (ARIMA) Model. Int. J. Curr. Microbiol. App. Sci.6(8):2887-95. https://www.ijcmas.com/6-8 2017/Venkatesh%20Panasa,%20et%20al.pdf
PANI, R., BISWAL, S. K., & MISHRA, U. S. (2019). Green gram weekly price forecasting using time series model. Revista ESPACIOS, 40(06).
Savadatti P. (2017). Forecasting of Area, Production, and Productivity of Food Grains in India: Application of ARIMA Model. Arthshastra: Indian Journal of Economics & Research. Dec 1;6(6):7-22. DOI: 10.17010/aijer/2017/v6i6/120114. http://indianjournalofeconomicsandresearch.com/index.php/aijer/article/view/120114.
Tripathi R, Nayak AK, Raja R, Shahid M, Kumar A, Mohanty S, Panda BB, Lal B, Gautam P. (2014). Forecasting rice productivity and production of Odisha, India, using autoregressive integrated moving average models. Advances in Agriculture.;2014.http://dx.doi.org/10.1155/2014/621313.
USDA (2018). https://www.usda.gov/media/agency-reports.
www.indiastat.com
Zotteri G, Kalchschmidt M, Caniato F. (2005). The impact of aggregation level on forecasting performance. International Journal of Production Economics. Jan 8; 93:479-91.
1. Research Scholar, Faculty of Management Sciences, Siksha ‘O’ Anusandhan (Deemed to be University), rojalin.pani@gmail.com
2. Assistant Professor, Department of ABM, CPGS, OUAT, Bhubaneswar, Odisha, d_behura05@yahoo.co.in
3. Professor, Faculty of Management Sciences, Siksha ‘O’ Anusandhan (Deemed to be University), umasankarmishra@soa.ac.in , corresponding author
4. Associate Professor, Faculty of Management Sciences, Siksha ‘O’ Anusandhan (Deemed to be University), sarojkantabiswal@soa.ac.in