![]() ISSN 0798 1015
ISSN 0798 1015

![]() ISSN 0798 1015
ISSN 0798 1015
Vol. 40 (Number 27) Year 2019. Page 21
SYROMYATNIKOV, Denis A. 1; PYATKINA, Darya A. 2; KONDRATENKO, Larisa N. 3; KRIVOLAPOV, Sergey I. 4 & STEPANOVA, Diana I. 5
Received: 16/04/2019 • Approved: 03/08/2019 • Published 05/08/2019
ABSTRACT: Big data analysis for water supply and sanitation is important for ensuring urban viability. Our research is devoted to studying the methodology for analyzing big data of the water supply and sanitation systems. Based on a review of scientific publications and their analysis, a model for analyzing large data was proposed. It comprises information sources, data collection and storage platforms with indication of parameters for the programming model, runtime and storage environment, as well as data analysis and processing. |
RESUMEN: El análisis de big data para el suministro de agua y saneamiento es importante para garantizar la viabilidad urbana. Nuestra investigación se dedica a estudiar la metodología para analizar grandes datos de los sistemas de abastecimiento de agua y saneamiento. Sobre la base de una revisión de las publicaciones científicas y su análisis, se propuso un modelo para analizar grandes datos. Comprende fuentes de información, recolección de datos y plataformas de almacenamiento con indicación de parámetros para el modelo de programación, el tiempo de ejecución y el entorno de almacenamiento, así como el análisis y procesamiento de datos. |

The more data we get, the more difficult they are to be explained. People are no longer able to decipher and analyze data. There is a need to create some kind of environment for storing and processing big data (Ebner et al., 2014; Rijmenam, 2014; Erevelles et al., 2016). A huge amount of different data is being created and accumulated in various economy sectors within the context of the information society development. The flow of technological, audio, photo and video information necessary for managing enterprises is continuously growing in industry and business. New services based on the use of information and communication technologies are appearing. The demand for information products and services is also growing due to the development of the Internet, social networks, video, audio and location-based services (Ebner et al., 2014). The enterprises have to analyze large amounts of data from various sources in order to offer such services to customers. As a result, the accumulated information becomes a strategically important asset for the government, telecommunications and Internet companies, banks, retailers, as well as energy, housing and utility service. The effective management of this information significantly influences the results of their activities (Shaw, 2017).
The global problem of water resources contributed to the establishment of the International Water Resources Association (IWRA, www.iwra.org) supported by the United Nations. The organization was founded in Marseille on June 14, 1996. This is the world water policy center, aimed at improving the management of water resources and water supply throughout the world. The main task of the organization is sustainable management of water resources and water supply, as well as the implementation of effective water policies and strategies throughout the world (Rapousis et al., 2015; Shaw, 2017).
Big data analysis in the field of water supply and sanitation, as in any other infrastructure, is based on data collection, processing, analysis and decision making. At the same time, the data are taken from documents, web services, accounting systems, registers and water supply sensors. The above-mentioned methods of collecting and analyzing big data are now obsolete. They cannot cope with the current amount of information.
There are different formats of big data. They can be structured, semi-structured and unstructured. Structured data refer to the data that have an organized structure and can be clearly identified. For example, it is a database with specific information. Messages, video, audio and photo files are the examples of unstructured data. As data types become more complex, they are more difficult to be processed and analyzed. Thus, there is a need for a data warehouse, capable of storing and analyzing huge amounts of data.
It should be taken into account that water supply and sanitation facilities are at the initial stage of introducing modern data storage and processing systems. Today it is necessary to introduce new and modern system for storing and analyzing big data. This system should be characterized by a high information-storage capacity and take into account data velocity and complexity.
Water supply and sanitation services need to process and store a large amount of information. The introduction Big Data has been necessitated by the emergence of technical tools able to process data in a quick and cost-effective manner.
The introduction of Big Data technology in water supply and sanitation enterprises will give new opportunities. It will:
1. Provide access to systematized information, help to build detailed analytical profiles and make reports;
2. Integrate detailed data on tariffs, consumption indicators and statistics by characteristics;
3. Provide detailed analytical data on consumption, monitor the loss of water resources;
4. Prevent fraud, etc.
There are several levels of Big Data. The first level includes Data Lake, Data Mining and Data science. Data Lake is preservation of unstructured information. Data mining is a set of data analysis methods that are used to identify useful patterns. Data science is a discipline that studies the issues related to the analysis, processing and presentation of digital information in a perceptible form (Mithas et al., 2013).
The second level is represented by Data warehouse, which stores information in a structured form, divides it by source and converts into the correct data types.
And the third level of Big Data is Data mart, which calculates the indicators and provides information for generating reports, adding dimensions and the use of search.
All these levels and systems will allow a water supply and sanitation enterprise to quickly save, store, systematize and analyze data.
Over the past two decades, there has been an increased interest in the problems of building a highly efficient and highly reliable dispatching control and data collection system. On the one hand, this is associated with significant progress in computer technology, software and telecommunications, which increases the possibilities and expands the scope of application of automated systems and allows the introduction of these techniques in the field of water supply and sanitation (Saritas et al., 2015). On the other hand, the information technologies development, increased automation and the realignment of functions between man and equipment have worsened the interaction between the human operator and the control system (Ebner et al., 2014).
SCADA (Supervisory Control and Data Acquisition) system is the main and the most promising method of automated control of complex dynamic systems (processes) in the most important sectors. Large automated systems in the industry, energy, transport, space and military sectors, as well as in various government structures are based on the principles of dispatching control (Saritas et al., 2015).
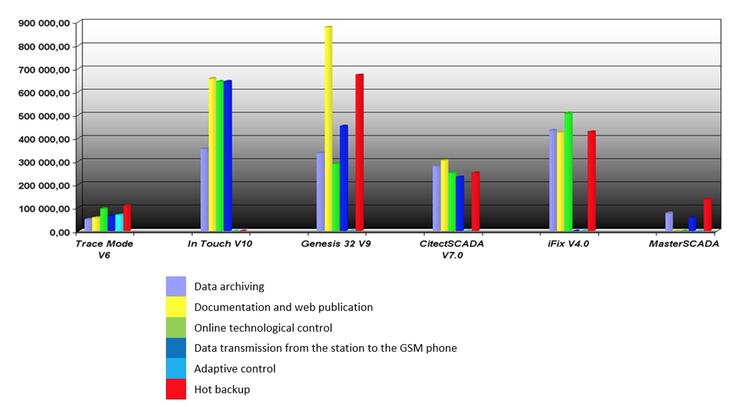
Master SCADA is designed to create automation, dispatching and accounting systems (automatic system for commercial accounting of power consumption, automated system of electric power technical metering) in industry, engineering networks and housing and utility sector in order to monitor lumped controlled objects. Autonomous SCADA is a system with a certain number of I/O points. The information about the technological process is displayed on a single computer. The system also allows you to connect OPC variables and inputs/outputs of controllers with Master PLC system; keep the process records in the internal database; create reports; use functional and/or calculation units to control the system. It provides access to technological processes and transmits data from stations [4]. This system allows you to archive and back up data, as well as document them with the Web publication. The MasterSCADA functionality is presented in Figure 1.
Figure 1
The Master SCADA functionality
Objective data within the system are collected by physical devices (smart objects), which are the sources of data on specific events. These devices can also change the operating modes of the water supply system (Franks, 2012). At the same time, all known SCADA systems are also integrated within the framework of analyzing big data of water supply and sanitation systems.
IBM and Esri have created and put into commercial operation hundreds of water metering systems that minimize customer risks and significantly improve management efficiency.
With due regard to the problems that water and sewerage companies should deal with and the level of modern information technologies in water management, we believe that the introduction of this model will create a single geographic information platform that will provide data visualization and integration, the use of real time streaming data, as well as in-depth analytics with the possibility of forecasting, modeling and decision-making support.
The construction of two GIS models is a crucial issue in reducing losses and ensuring the effective operation of water systems in the city. GIS water supply systems include pipelines, fittings, valves, hydrants, pumps, measuring equipment and reservoirs. The most important step is the comparison of these objects with the corresponding elements of the hydraulic model. In order to guarantee a one-to-one relationship between the GIS and the model, it is necessary that the model elements have a unique identifier obtained from the ID in the GIS. This can easily be done by reading the identifier (ID) field of a GIS object or asset (ASSET_ID) (Saritas et al., 2015)
Table 1 presents the fields for each class of GIS objects that must exist in the GIS database. These data facilitate long-term support of the model and should be kept up to date.
Table 1
Source data for constructing a GIS model
GIS objects |
Elements of the hydraulic model |
Recommended GIS attributes |
||
Class |
Type |
Class |
Type |
|
Hydrants and valves |
Point |
Nodes |
Point |
ID_asset, installation_date, out-of-sevice_date, height, fitting_type, date_of_change, GIS_change, model_change, service_change (Yes/No) |
Controlled valves |
Point |
Valves |
Point or line |
ID_asset, installation_date, out-of-sevice_date, zone_from, zone_to, height, diameter, valve_functional_type, housing type, date_of_change, GIS_change, model_change, service_change (Yes/No) |
Pump units and motors |
Point |
Pumps |
Point or line |
ID_asset, installation_date, out-of-sevice_date, zone, height, diameter, date_of_change, GIS_change, model_change |
Pipes |
Line |
Pipes |
Point |
ID_asset, installation_date, out-of-sevice_date, zone, diameter, material, relaying_date, relaying_type node_from, node_to, length, roughness, date_of_change, GIS_change, model_change |
Tanks and reservoirs |
Point |
Tanks and reservoirs |
Point |
ID_asset, installation_date, out-of-sevice_date, zone, bottom_level, surface_level, diameter, volume, date_of_change, GIS_change, model_change |
Source – (Shaw, 2017)
Taking into account the challenges that water and sewerage companies face with and the development of modern water management information technologies, it can be argued that a modern smart water system will allow the creation of a single geographical information platform. The platform will provide visualization and integration of monitoring and control systems, remote sensing and monitoring of physical facilities integrated with proactive asset management, the use of real time streaming data, the IT infrastructure for managing the information on water resources used by several organizations and allowing making decisions at the system level, in-depth analytics with the possibility of forecasting, modeling and decision-making support.
A constantly increasing flow of information in water supply and sanitation is accompanied by the introduction of hardware and software that can quickly process large volumes of information. There is also a significant reduction in the cost of collecting, processing, storing and transmitting information. This requires the analysis and systematization of data in order to improve the efficiency of this sector and the quality of life of the urban population.
Many scientists studied the above mentioned problems (Whetten, 1989; Lin et al., 2008; Wu, 2010; Zhou & Li, 2010; Franks, 2012; Rijmenam, 2014; Ritson, 2014; Steinbach, 2014; Rapousis et al., 2015; Proskuryakova, 2015; Erevelles et al., 2016; Perciavalle et al., 2017; Shaw, 2017). But they have not proposed a single universal solution. This fact was the reason for conducting our research.
The potential of Big Data technology in optimizing key business processes and reducing regulatory risks will be revealed by the access to the detailed data on the use and consumption of goods.
The problem is that there is little practical experience in applying Big Data in water supply and sanitation, but the need for big data analysis in this sector is constantly growing.
Big Data technology is a tool, a method for data analysis, but a method can also be a method object and this study analyzes methods of big data processing via mathematical statistics to find new opportunities for data management improvement.
The methodological basis of our research is Big Data, SCADA and Master SCADA methodologies. We also used statistical planning methods. These methods were the basis for studying the analysis of big data on water supply and sanitation in cities.
The goals set in the research were achieved with the help of general scientific and special methods of economic research, such as: monographic (in-depth theoretical study of Big Data analysis and Big Data in water supply and sanitation), graphic (illustration of indicators and their changes in the presented figures), as well as the method of spectral analysis carried out in STATISTICA (construction of water supply indicators and study of their impact through building cyclic series of water losses).
A large number of publications devoted to this issue does not solve the problem of choosing a methodology for collecting, storing, analyzing and processing big data.
The feature of proposed data analysis method can be expressed as detection of atypical elements. Atypical refers to an observation that is different from other observations to the point where a suspicion arises that it was generated by another mechanism. Thus, detecting atypical elements is searching for objects that do not correspond to a typical element in any database. In the past, atypical elements were considered only a noise, an interference that should have been removed from the set of measurements to improve the results of an algorithm used. Currently, atypical elements gain significance due to countless studies in the field of machine learning, data mining and statistics. At this point, some authors consider them part of tasks set in data mining, generalization, classification, grouping, prediction or regression. Depending on the field of activity, a detailed and thorough study of atypical data can reveal relevant information contained in a database. Among data related to credit cards, for example, detected atypical elements may help in detecting fraud. In medical applications, they can be used to diagnose a disease with a higher accuracy or to combat it. Even within computer networks, atypical and any other anomalies may cause suspicions about unauthorized activity.
In the context of water supply and sanitation, atypical data in a series of measurements may indicate the source of a malfunction, leakage, unauthorized intervention or indicate insufficient capacity of the water supply and sewerage network, etc. Thus, investigating atypical data from the systems of water supply and sanitation enables the improvement of their management, operation and safety.
There are three types of atypical data that are commonly found in databases. Among them, an “atypical point” or a range of objects with attributes that conflict with those of the normal objects. Detecting these objects is a goal of most detection methods. The second type can be defined as contextual, as it refers to specific objects that appear within a specific context of the input data set, that is, the value is not necessarily atypical but depending on the context, it is classified as such. For example, this happens in a series of climatological data where very low temperatures are considered winter temperatures but which show them to occur in summer. The temperature value for a given area itself is within the range of expected values but does not correspond to the season of the year. The third type can be defined as an atypical collective because isolated instances are not characterized as atypical but when combined with other instances, they exhibit abnormal behavior in relation to other instances. The most common methods for detecting atypical elements are statistics, a distance approach, dense approach, angular approach, cluster approach, and a subspace approach. Defining these approaches is beyond the scope of this article. Many algorithms aimed at improving detecting methods have been developed over decades but the problem of data size remains a common problem. These difficulties can be irrelevant if approaches address mathematical statistics, for example - when data are analyzed with the awareness of process randomness. In the case of a significant deviation of measured values from the expected random variable on a plot, points may be atypical or normal depending on whether the deviation falls within the acceptable range. On larger scales, however, the model becomes more complex and this makes accurate analysis more difficult to accomplish. Methods based on distance or density raise a data storage problem because most of them calculate the nearest neighbor by traversing the entire database for each point. In a massive data set, this operation will inevitably cause a memory overflow. An algorithm aimed at resolving such problems should follow a range of requirements like the use of evolutionary computation. Another solution to the large database problem may be the continuous monitoring of atypical distance-based data streaming. The main idea is to remove the memory limit from previous algorithms using a window sliding technique and thus enable gradual data reading. Thus, the present hybrid approach combines the algorithms used to solve high-dimensional problems with the algorithms used to solve massive data problems. To implement the proposed approach, ELKI (https://elki-project.github.io/algorithms/) and MOA (https://moa.cms.waikato.ac.nz/details/) software libraries were used. The first software package includes the widest library of algorithms for atypical data and covers different approaches, including those listed earlier. The second software package is designed for data mining in real time, that is, it has algorithms adapted for data stream processing. Its latest release introduces algorithms for finding inconsistent data in large databases. The hybrid approach implies two main procedures: first, a window size setting for data receival; second, a conditional test. When data are read, the values are saved in a vector. Then, a conditional test is performed with regard to the number of objects read - if it equals the window size set at the beginning, then the object processing may be started.
The studies were based on mechanical samples using state statistical data and the data from Rostov Water Service Company.
The inability to take advantage of big data often comes from their complexity and randomness. The discussions about the Big Data methodology present a conceptual framework that illustrates the impact of Big Data on data analysis in water supply and sanitation (Franks, 2012; Saritas et al., 2015). Having studied modern developments (Whetten, 1989; Lin et al., 2008; Ebner et al., 2014; Rijmenam, 2014; Rapousis et al., 2015; Proskuryakova, 2015; Ministry of Land, Infrastructure, Transport and Tourism, 2015; Erevelles et al., 2016; Ponce Romero et al., 2017), we defined some basic Big Data principles. The first principle is horizontal scalability. It means that there can be huge amounts of data and the big data processing system should expand dynamically. The second principle is fault tolerance. In case there is a failure in some equipment, the entire system should function. The third one is data locality.
In large distributed systems, data are usually distributed over a significant number of machines. However, data are often processed on the same server where it is stored in order to save resources. There is a need for new breakthrough technologies to ensure the operation of all three principles and the high efficiency of storing and processing big data (Gantz & Reinsel, 2012).
Figure 2
Data collection and storage algorithm. Data analysis for Rostov Water Service
Company and other water supply and sanitation enterprises (own development)
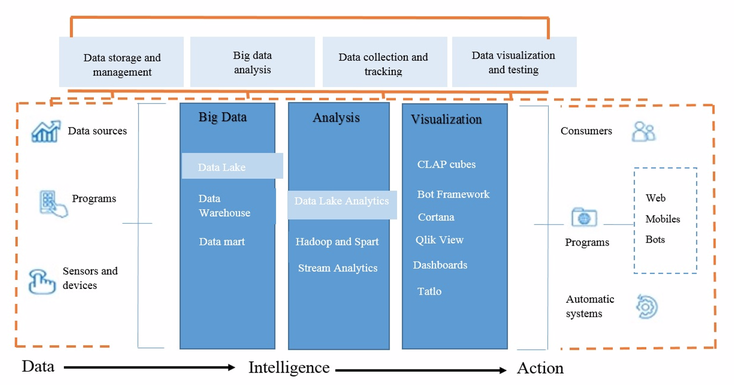
The data collection and storage algorithm for water supply and sanitation enterprises is presented in Fig. 2. We suppose that the Big Data source will be not only corporate databases and social networks, but also the entire flow of information from different sensors, measuring devices, sensor networks. For big data processing, innovative tools and methods have been developed on the basis of artificial intelligence, statistical analysis, mathematical linguistics, predictive analytics, and so on. For example, Hadoop, Data Lake and Data mart. In our algorithm Big data analysis is proposed for obtaining unknown, but necessary for the industry information.
The use of Big Data by the Rostov Water Service Company made it possible to get information from various sources using various data transmission protocols. In our case, there are 3 main sources of information:
• Web (application, website) – information from end consumers (meter reading, payments, processing of requests related to technical problems, telephone calls, etc.)
• Technological process control and management system – proxy servers, SCADA database, direct service connection, central dispatching office.
• Management accounting control system.
In the Rostov Water Service Company data storage begins with the first level – Data lake. Data are stored in an unprocessed and most often not structured form. The level of such storage is necessary for the rapid uploading of information into the warehouse without wasting resources for processing, customization and calculation. It also provides the ability to refer to the source of information.
Data warehouse is the second level of data storage in Rostov Water Service Company. The preliminary data structuring by sources, types, etc. begins here.
Data mart is the level of data storage and analysis. These are available data with calculations that can be used by the managers for analysis and decision making. At this level there are often closed user groups so that the manager, using sql query or excel, can extract relevant information in the right context, which may not occur in standard reports.
Over the years, Rostov Water Service Company has accumulated large volumes of transactional information which is going to be used to improve the product quality and strengthen the competitive advantage of the company in the market.
We suggest the implementation of the proposed model of collection, storage and processing of structured and unstructured data from different sources. Unstructured data will consist of click stream data (data on water supply and sanitation consumers), sentiment data regarding the human-chatbot communication, and consumer survey data on the quality of service.
The introduction of this methodology suggests the creation of a data warehouse that will collect and store structured and unstructured data. Data hub of Rostov Water Service Company will store consumer data. These data will make it possible to develop new proposals, create reports and make forecasts.
Such approaches and methods of storing and processing huge amounts of data are aimed at providing relevant high-quality information to the end consumer for making effective decisions. These consumers are employees of the company (analysts, technical and financial departments, as well as the top management of the company), government authorities and end customers.
Rostov Water Service Company applied the proposed by us methodology and showed the following results:
1. Customer service has been improved due to an optimized system for reading and providing data (automatic transmission and collection of meter readings, billing and distribution of bills);
2. Operating costs of the company have been optimized. It has reduced the cost of technological processes: energy, labor, time. Automatic data collection and analysis excluded manual labor with information and data. This helped to avoid input errors;
3. Possible risks have been minimized and the efficiency of the asset management has been improved. For example, the non-revenue water analysis helped to identify damage and conduct repair work in a timely manner. This data analysis allowed the company to save and restore equipment. The example here is the collection of data from sensors and water meters, information on sealing and rechecking;
4. The performance of Rostov Water Service Company has been improved through big data analysis and automatically created reports. The introduction of Big Data in Rostov water supply and sanitation sector systemized the data and transformed the existing information chaos into effective solutions. Sharing of data from different sources, such as GIS or SCADA has become more effective. Information security has also been improved: data access is automatically configured and allowed at the disposal of the management.
It was concluded that at the fundamental level big data indicate there is a huge amount of information in the water supply and sanitation sector. The analytical services of Rostov Water Service Company get data from dispatching control and data collection systems (SCADA), including flow statistics, online monitoring, as well as from laboratory information management systems (LIMS) and computerized maintenance management systems (CMMS).
For example, in Yandex the first big data processing system appeared around 2007–2008. It was used to process big data in production. The Big Data technologies developed by Yandex are also used by Seismotech to analyze and process geologic data, as well as to analyze and process data in CERN (European Center for Nuclear Research) projects.
Black & Veatch offers ASSET360 ™, an intelligent analytic platform, to provide public utility companies, cities and other facilities with a holistic understanding of their infrastructure-based systems. The service analytics of the company includes solutions for operational analysis and adaptive planning.
The rapid growth of streaming data does not allow specialists to analyze the full amount of information. This affects the accuracy of forecasts and the effectiveness of regional development programs, therefore the task of government and municipal authorities is to ensure that the automated analysis system has access to all existing data warehouses.
We offer water supply and sanitation facilities in Rostov to combine consumer data (for example, data from portable sensors) with geospatial data in order to get useful information for the company and visualization for consumers. Then it will be possible to analyze big data and predict consumption rates by combining expected and existing indicators.
When building a big data analysis model, we proposed to consider the following factors and indicators for monitoring and accounting: the capacity of the water supply system, as well as the amount of water sold in the water supply network, household water consumption per capita, non-revenue water in water supply networks, the non-revenue water in sewer networks, sewage treatment capacity, the amount of wastewater, the amount of domestic wastewater, the proportion of polluted wastewater in the total amount of wastewater, consumption of electricity, etc.
We have determined the nature of oscillations in the water loss dynamics. The highest frequency, which is inherent in one or another time series, was determined with the help of spectral analysis. Spectral analysis of non-revenue water trends and the their estimation in the city of Rostov-on-Don and the region were performed on the basis of the data collected over the five-year period (Fig. 3). In the spectral density graph the x-axis shows months and the y-axis presents cycles. It should be mentioned that a 12-month period was identified, which coincides with the annual cycle and repair work.
Figure 3
Spectral density of non-revenue water changes for the period of 2011-2016
(own development based on the Rostov Water Service Company statistics)
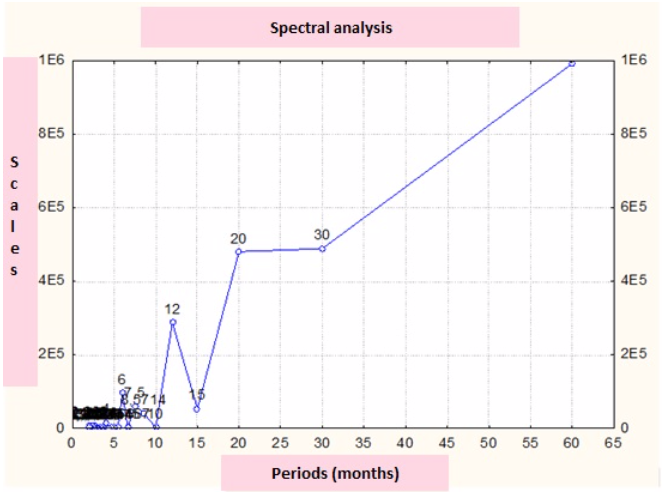
The advanced regression analysis predicts a 12% increase in non-revenue water by 2020. This can be explained by the fact that the equipment is worn out and there is no capital investment in water supply and sanitation. In addition, the big data analysis shows that public utility companies should expect an increase in the supply costs of services.
The spectral analysis showed that a fact-based big data analysis will play an increasingly important role in the water infrastructure management in the coming years. This emphasizes the importance of data for making sound, more reasonable and more accurate management decisions.
The dynamics and different timelines, such as daily fluctuations, weekly trends (especially differences on weekends and weekdays) and seasonal changes should be taken into account. Their data analysis requires data collection, storage and processing, which is done with the use of Big Data. It is necessary to compare one day with another, superimposing dynamic data in order to track daily fluctuations of the company’s data. For weekly trends, we suggest calculating plans. And for seasonal changes we suggest creation of charts and comparison of long-term trends. We believe that Big Data technology is a tool that will help water service companies transform the entire data flow into analytics and conclusions that can be used to improve the performance of water supply and sanitation systems. Correct data, analytics and decision-making system will contribute to the optimal and effective performance of water service companies.
Forecasting of the demand for water supply is one of the most important steps in the management of water infrastructure. However, this process is associated with various social, economic, political and environmental uncertainties that can lead to completely different results. Demand forecasting is feasible for decision makers at a high level due to the extended big data analytics. It is performed through pattern recognition and modeling of a number of scenarios using system dynamic modeling and advanced machine learning algorithms (Perciavalle et al., 2017).
The development and implementation of the models for collecting, storing, processing and analyzing big data will allow water service companies and public utility companies to optimize and manage their processes and strategies of infrastructure development. Extended analytics based on big data analysis can be used to predict the behavior of water consumers and forecast demographic variables (for example, population density), historical patterns (climate, temperature, humidity), infrastructure (technology used, productivity, equipment), political, economic, social and other parameters. These components are considered to be input variables for developing a predictive model for predicting the water consumption level.
Based on our research, we concluded that modern data analysis and improved big data analytics can make the management of water infrastructure reasonable, allowing decision makers to effectively and accurately assess, predict and distribute their resources. The trend analysis based on analytical methods of collecting hidden patterns and trends underlying historical data can help public utility companies to set priorities regarding their fixed assets, assess risks, track infrastructure components and implement action plans.
We also believe that the analysis of water demand will not only result in reasonable strategic plans and actions for the distribution of infrastructure resources and their management, but will also provide effective solutions to water conservation issues. It can also be used for the development of systems and methods for predicting and preventing water shortages.
The review of the studies devoted to the big data analysis has revealed that many theoretical and methodological aspects have not been sufficiently developed. The problems of collecting and storing big data, their systematization and analysis have not been properly studied (Whetten, 1989; Franks, 2012; Gantz & Reinsel, 2012; Mithas et al., 2013; Ebner et al., 2014; Ritson, 2014; de Ville et al., 2017). In many studies there are no clear recommended solutions to this problem (Whetten, 1989; Ponce Romero et al., 2017). Most scientific articles and learning materials are of a descriptive and recommendatory nature with insufficiently formalized tools that can be put into practice (Zhou & Li, 2010; Gantz & Reinsel, 2012; Proskuryakova, 2015; Nagashima et al., 2015; Erevelles et al., 2016; Shaw, 2017).
Big data and business analytics are the tools that can help water supply and sanitation enterprises to study the coverage of their services, analyze market data of their services, attract the right suppliers and predict further solutions (Lin et al., 2008; Rijmenam, 2014; Steinbach, 2014; Rapousis et al., 2015; de Ville et al., 2017).
It was concluded that Big Data are important because they make it possible to build predictive models in distributed file systems. The possibility to use all available data for segmentation and clustering is more significant. This will result in effective building of a large number of models for small clusters.
As big data and analytics are becoming more and more popular, big data analysis is expected to become a valuable tool for suppliers and contractors. The issues associated with industrial data collection have created some problems in this sphere. Both the quantity and quality of data play a decisive role in data analysis, planning and forecasting. We believe that forecasting and making future decisions are the newest and the most complex applications of big data in water supply and sanitation.
The study of scientific materials helped to determine that the inefficiency of water management is directly related to the fragmentation of the industry. This fact makes it difficult to ensure open and fair competition for projects, as well as limits the number of participants, which may result in higher prices for consumers. Thanks to the technology, now it is possible to create an efficient infrastructure, the performance of which can be improved by data analysis (Rijmenam, 2014; Ministry of Land, Infrastructure, Transport and Tourism, 2015; Perciavalle et al., 2017; Shaw, 2017).
Despite the potential benefits, some water service companies cannot optimize big data. In order to encourage public utility companies to use big data, in our research we present a theoretical basis and practical developments that show big data contribution to the expansion of competitive advantages. For example, an organization may successfully retrieve hidden consumer data from Big Data, but it may still not be able to effectively use hidden consumer ideas to facilitate its adaptive ability. Negative results occur when a water service company cannot organize and analyze big data to actively use them and improve the company’s opportunities (Whetten, 1989; Rapousis et al., 2015). We also believe that big data analysis will help to reveal hidden consumer needs and demands.
One of the possible solutions is the implementation of Big Data, which will create a web platform specifically designed to ensure a more effective communication between water service companies, suppliers, contractors and consumers. This will lead to maximum competition and lower prices. The model will consist of an electronic bidding platform allowing water supply and sanitation enterprises to accept sealed responses to requests and participate in e-procurement in a user-friendly environment. In the future, there will be a series of solutions using data to help public utility companies and suppliers make smarter business decisions.
In our research we have analyzed the modern possibilities of storing and systematizing big data, as well as the methods for analyzing and visualizing them. We have also carried out a review of MasterSCADA, SCADA and Big Data. In the course of our analysis, we concluded that the water supply and sanitation sector deals with processing and storing large amounts of data. This means that there is a growing need for technical tools that are able to process such data in a quick and cost-effective data. It is necessary to implement Big Data technology. It was established that the advantage of Big Data is that based on the available information, it is possible to build a great number of models for a large number of segments. This will help to make predictions using a corresponding model.
As a result of our research, we proposed a big data analysis model, which includes data sources, a data collection and storage platform detailing programming models, operation and storage environments, as well as data analysis and processing units.
Rostov Water Service Company was proposed the options for collecting, storing, analyzing and visualizing big data that will help to optimize and manage its development processes and strategies.
With the help of spectral analysis of big data, we determined the highest frequency of water loss cycles. In Rostov, there are cyclic 12-month periods, which coincide with the annual cycle and repair work.
The proposed methodology will provide comprehensive accounting, collection and storage of large amounts of data of the studied company. Quantitative, qualitative and statistical analysis was carried out within the framework of monitoring and metering indicators, production capacity of the water supply system, water sold to the water supply network, household water consumption per capita, non-revenue water in water supply networks, the non-revenue water in sewer networks, etc.
de Ville, N., Le, H. M., Schmidt, L., & Verbanck, M. A. (2017). Data-mining analysis of in-sewer infiltration patterns: seasonal characteristics of clear water seepage into Brussels main sewers. Urban Water Journal, 14(10), 1090-1096.
Erevelles, S., Fukawa, N., & Swayne, L. (2016). Big Data consumer analytics and the transformation of marketing. Journal of Business Research, 69(2), 897-904.
Ebner, K., Bühnen, T., & Urbach, N. (2014, January). Think big with big data: identifying suitable big data strategies in corporate environments. In 2014 47th Hawaii International Conference on System Sciences (pp. 3748-3757). IEEE.
Franks, B. (2012). Taming the big data tidal wave: Finding opportunities in huge data streams with advanced analytics. John Wiley & Sons.
Gantz, J., & Reinsel, D. (2012). The digital universe in 2020: Big data, bigger digital shadows, and biggest growth in the far east. IDC iView: IDC Analyze the future, 2007(2012), 1-16.
Lin, M., Wu, Y., & Wassell, I. (2008). Wireless Sensor Network: Water Distribution Monitoring System. Radio and Wireless Symposium (pp.775–778). IEEE.
Mithas, S., Lee, M. R., Earley, S., Murugesan, S., & Djavanshir, R. (2013). Leveraging big data and business analytics. IT professional, 15(6), 18-20.
Ministry of Land, Infrastructure, Transport and Tourism. (2015). Implementation of planned reconstruction. Retrieved from http://www.mlit.go.jp/crd/sewerage/policy/03.html
Nagashima, T., Tanaka, Y., & Ishihara, S. (2015). Measurement of wireless communication characteristics in sewer pipes for sewer inspection systems using multiple wireless sensor nodes. In 2015 IEEE 26th Annual International Symposium on Personal, Indoor, and Mobile Radio Communications (PIMRC) (pp. 2055-2060). IEEE.
Perciavalle, P., Woodall, P., Abrera, J., & Vallabhaneni, S., & Johnson, K. (2017). The Digital Water/Wastewater Utility of the Future: Case Studies in Leveraging Smart Utility Technology and Best Management Practices. Proceedings of the Water Environment Federation, 2017(15), 548-554
Ponce Romero, J., Hallett, S., & Jude, S. (2017). Leveraging big data tools and technologies: addressing the challenges of the water quality sector. Sustainability, 9(12), 2160.
Proskuryakova, L.N. (2015). Water Resources 2030. Policy Recommendation. National Research University Higher School of Economic.
Rapousis, N., Katsarakis, M., & Papadopouli, M. (2015). QoWater: A crowd-sourcing approach for assessing the water quality. In Proceedings of the 1st ACM International Workshop on Cyber-Physical Systems for Smart Water Networks (pp. 11). ACM.
Rijmenam, M. V. (2014). How geospatial data can enrich your customer experience and drive revenue. Smart Data Collective. Retrieved from http://www. bigdata-startups.com/geospatial-data-enrich-customer-experience-drive-revenue/
Ritson, M. (2014). Amazon has seen the future of predictability. Marketing Week
Saritas, O., Proskuryakova, L., & Kyzyngasheva, E. (2015). Water Resources–an Analysis of Trends, Weak Siglans and Wild Cards with Implications for Russia. Science, Technology and Innovation, (35), 1-27.
Shaw, A. (2017) Understanding Big Data In The Water Industry. Retrieved fromhttps://www.wateronline.com/doc/understanding-big-data-in-the-water-industry-0002
Shelton, T. (2017). The urban geographical imagination in the age of Big Data. Big Data & Society, 4(1), 2053951716665129.
Steinbach, P. (2014). Dynamic pricing pinpoints market value. Athletic Business.
Whetten, D. A. (1989). What constitutes a theoretical contribution? The Academy of Management Review, 14(4), 490–495.
Wu, L. Y. (2010). Applicability of the resource-based and dynamic-capability views under environmental volatility. Journal of Business Research, 63(1), 27–31.
Zhou, K. Z., & Li, C. B. (2010). How strategic orientations influence the building of dynamic capability in emerging economies. Journal of Business Research, 63(3), 224–231
1. Department of economy and foreign economic activity, North-Caucasus Federal University, Stavropol, Russian Federation
2. Department of applied informatics and probability theory, Peoples' Friendship University of Russia ( RUDN University), Moscow, Russian Federation
3. Department of advanced mathematics, Kuban state agrarian University I. T. Trubilin, Krasnodar, Russian Federation
4. Departament of analysis, making decisions and Financial technology, Financial University under Government of Russian Federation, Moscow, Russian Federation
5. Department of Finance and prices, Plekhanov Russian University of Economics, Moscow, Russian Federation, ORCID ID: 0000-0001-5981-6889; Contact e-mail: diana_s_diana_stepanova@list.ru