![]() ISSN 0798 1015
ISSN 0798 1015

![]() ISSN 0798 1015
ISSN 0798 1015
 Vol. 40 (Number 29) Year 2019. Page 23
SEPÚLVEDA, Felipe 1
Received: 21/05/2019 • Approved: 07/08/2019 • Published 02/09/2019
ABSTRACT: The purpose of this quantitative study was to analyze if there is an association between the school accountability ratings assigned to elementary schools in Texas (USA) with the students’ demographic characteristics attending those schools. Information from three large urban school districts in Texas was analyzed considering data from 398 elementary schools and the reading and mathematics TAKS test scores of 24,065 fourth grade students. |
RESUMEN: El propósito de este estudio cualitativo fue analizar la existencia de asociaciones entre los rankings de evaluación escolar asignados a las escuelas del estado de Texas (EE UU)con las características demográficas de los estudiantes que asisten en ellas. Información de tres distritos escolares urbanos de Texas fue analizada considerando datos de 398 escuelas elementarías en las pruebas de lectura y matemáticas (TAKS test) analizando los resultados de 24,065 estudiantes de cuarto año. |

The standards-based movement that followed high-stakes testing has existed in American education for more than 30 years. The current demand for educational accountability has been building and crystallizing through the post-Sputnik period when reforms based on excellence and accountability emerged due in part to the Elementary and Secondary Education Act (ESEA) of 1965 (Stronge et al., 2007). The ESEA defined Title I categorical school funding for educationally deprived students (Oakes & Lipton, 2006). Title I federal funds are directed to provide additional resources to schools with a high population of low-income and at-risk students. Throughout the 1980s, the changing world economy resulted in an accentuated academic achievement gap fomenting the belief among policymakers, business leaders, and the common citizens that something had to be done to lift the quality of American education. The release of A Nation at Risk (1983) reinforced the need for student accountability and elevated the level of demonstrated proficiency (Horn, 2003). During the 1990s, the standards-based educational movement started to materialize through a system that combined a centralized curriculum and local control over the public schools. The curriculum standards and assessments were be determined by public entities at the state level, but the details of curriculum teaching and professional development would be left to district and school leaders. During this era, a new direction in policy emerged where school reforms included the standards students were taught, how to measure and disclosure of how well students learned the defined standards, and in some states accountability for success or failure in achieving improved learning (Kress et al., 2011). In 1994, President Clinton reauthorized the ESEA, which required statewide academic standards for Title I students mirroring the same academic standards which applied for other students (Resnick & Zurawsky, 2005). As an effort to provide clear expectations and to guarantee all students received the knowledge and skills necessary to be college- and career-ready, members of the National Governors Association Center developed the Common Core State Standards (CCSS) initiative (Honigsfeld & Giouroukakis, 2011).
No Child Left Behind (NCLB) was a standards-based educational reform signed into law in 2002 by President George W. Bush. The act mandated common student proficiency levels and required the mastery-oriented conception of basic, proficient, and advanced levels of student performance in all states (Fuller, Wright, Gesicki, & Kang, 2007). The NCLB act increased accountability at the school level for improving the quality of education for all students. One of the major requirements of NCLB is to set high academic achievement standards for all students and ensure all students reach proficiency in those standards by 2014 (Heilig et al., 2010; Schraw, 2010). Each school must test five distinct ethnic groups (Black, Hispanic, White, American Indian, Asian/Pacific Islander) and three categories of students (low-income, bilingual, and special education) (Krieg, 2011). If the goals for each student subgroup are not met, school leaders must engage in an improvement plan and might be categorized as failing schools if they do not show improvement (Darling-Hammond, 2007). Consequences may include wide sanctions with public warnings, school restructuring, and administrators’ replacement.
Under former President Barack Obama, the educational reform efforts shifted with the Race to the Top program. The federal administrators designed a competitive grant program with federal money available for state education. In order to be eligible, state officials need to create the conditions for educational innovation in adopting internationally benchmarked standards, recruit and develop effective teachers and principals, design data systems to measure students’ success, and turn around the lowest performing schools (Martin & Lázaro, 2011). The purpose of the Race to the Top program, funded by the American Recovery and Reinvestment Act of 2009, is to promote longitudinal student data systems and the creation of new student assessments, which would be adopted by groups of states (Pilotin, 2010). Additionally, federal administrators favor the elimination of barriers to the value-added assessment of teachers and schools and push for more sophisticated statistical models to support accountability (Braun, 2009). In many aspects, the Race to the Top program promoted the refinement of the accountability systems developed under the NCLB reform and favored the adoption of common core standards across the states promoting a more consistent accountability system in the country.
Texas legislators were among the pioneers in implementing a statewide accountability system. In 1993, Texas legislators enacted the Texas public school accountability system to rate school districts and evaluate campuses. The state assessment is a direct measure school performance. Based on school performance, officials at TEA can sanction schools not meeting performance targets and reward schools exceeding targets (Kress et al., 2011). Since the first implementation in 1993, the Texas standards-based accountability system has evolved throughout different assessments and accountability. During 2003-2011, the school accountability instrument was the Texas Assessment of Knowledge and Skills (TAKS). Throughout this time, schools received categorical ratings based on annual standardized test results. School ratings depended on different indicators of performance including assessment results, longitudinal completion rates, and dropout rates (TEA, 2011). Accordingly, the Texas accountability model met the NCLB compliance with a status oriented system that reflected the proportion of students at specific levels of achievement on a given scale (Marzano & Waters, 2009). Based on students’ passing rates, campuses received ratings of Exemplary, Recognized, Academically Acceptable, or Academically Unacceptable. In 2012, the State of Texas Assessment of Academic Readiness (STAARS) replaced the end-of-the-year standards-based assessments (TAKS) (House Bill 3 Transition Plan, 2010). At the elementary level, the new assessment was more rigorous with questions on material covered on each grade level (TEA, 2011). At an individual level, the STAAR results include performance level based on a scale score, which could be: Advanced Academic Performance (Level I), Satisfactory Academic Performance (Level II), or Unsatisfactory Academic Performance (Level III). At the time the STAAR was implemented, the system to evaluate schools was still under discussion by the state legislators. TEA officials proposed developing an indicator of school performance that included four indexes: student achievement, student progress, closing the performance gap, and postsecondary readiness (Texas Education Agency, 2013).
During the last 40 years, the school reform efforts have focused primarily on the development of curriculum standards, assessments to measure student achievement, and school level reporting mechanisms to publicly explain results (Stronge, Ward, Tucker, & Hindman, 2007). Accordingly to this context, No Child Left Behind was designed as an educational reform that used standards-based assessments as a means to ensure accountability for all students regardless of race, socioeconomic status, language proficiency, or special education status to achieve academic proficiency as determined by each state (Harris, 2012). Educators must use research-based pedagogical strategies to provide quality instruction. However, family background is related to student achievement, and determining the school performance solely based on the student achievement on standardized tests might disproportionately punish socioeconomically disadvantaged schools (Ready, 2013).
Students living in wealthy communities often receive higher academic support from their families, which affects performance on standardized testing. Therefore, school academic achievement is a reflection of internal and external factors which are difficult to isolate in order to determine the exact effect of the school on students’ achievement on test scores (Price, 2010). Since family background may significantly impact student’s academic achievement, labeling schools based on testing performance might be an inequitable system that does not account for demographics which might influence students’ achievement on standardized testing. There is evidence that virtually all students, even those from disadvantaged backgrounds, can succeed in the right educational environment, but it is much more difficult to raise the achievement of disadvantaged children (Ballou, Sanders, & Wright, 2004). Since the student’s family background significantly influences the student academic achievement, labeling schools based solely on testing performance might be an uneven and inaccurate system to define school effectiveness. During 2003-2011, the school accountability instrument was the Texas Assessment of Knowledge and Skills (TAKS). This accountability model considered students’ sub-populations to assign achievement goals but accountability ratings were not adjusted for school with higher population of students that historically have performed low in standardized assessments. The problem is the status model used in Texas to determine school accountability does not account for students’ demographic characteristics. Subsequently, due to the well-described achievement gap, schools with higher population of students at risk may receive lower ratings. The purpose of this quantitative study was to analyze if there is an association between the school accountability ratings assigned to elementary schools in Texas with the students’ demographic characteristics attending those schools.
Publicly accessible data, regarding TAKS test scores and student demographics of public schools in Texas during year 2011, were analyzed. The variables included in the study have nominal characteristics (e.g., students’ socioeconomic status), and ordinal characteristics (e.g., school accountability rating). The analysis of data was based on qualitative techniques including non-parametric inferential statistics. The researcher used a quasi-experimental research design to test the suggested null hypotheses.
In this study, the researcher used data from three large urban schools districts in Texas. By using information from large school districts, it was expected to utilize a representative sample of the student population attending elementary urban public schools in Texas. Assessment data from 2011, end-of-the-year state standards-based assessments scores (TAKS test) in mathematics and reading from students attending fourth grades were included in the analysis. The scores represented the TAKS test vertical score average for each school rather than individual student scores or an achievement score.
A representative sample of the Texas student population attending the fourth grade was included in the study by analyzing data from the three largest public-school districts in the state. Information from these school districts provided a diverse set of data including schools with different academic performance. Also, using data from large school districts offered a representative sample of students attending urban public schools. Schools’ classification represented the TEA accountability rating in 2011 and variables in student data include ethnicity, socioeconomic status, and English proficiency. Altogether, the districts’ demographics is represented by 447,253 students in which 64% are Hispanics, 22% African American, 10% White, and 4% other ethnicities. The districts’ combined populations are considered 79% economically disadvantaged and 32% are classified as limited English proficiency. Each school academic performance was described by the proportion of students from each demographic group included in the study that meet the reading and mathematics passing standard.
The investigation included public data available through TEA’s website. The Texas Assessment Knowledge and Skills (TAKS) results from 2003 to 2011 are available through a public database (TAKS Aggregate Data System), and maintained by members of the Student Assessment Division of TEA. The data includes the TAKS results aggregated by region, district, and campus. A personalized report was generated to gather information about fourth grade TAKS results for reading and mathematics year 2011. The aggregate data represented the results at a campus level containing 2,064 variables for each campus including campus total average scores by grade level and results detailed by student demographics (i.e., ethnicity, socioeconomic status, and English language proficiency). A second database containing the schools’ accountability ratings from year 2011 was generated from TEA public records. Merging both databases created a new database containing information about TAKS test scores, school accountability, and students’ demographics at a campus level.
The data were tabulated specifying the school accountability rating and the students’ demographic variables. Descriptive statistics were used to visually analyze the research data. Three charts were generated showing the school accountability ratings (Exemplary, Recognized, Academically Acceptable, and Academically Unacceptable) and the number of students meeting the standard ordered by ethnicity (White, African American, Hispanic, and Asian), socioeconomic status (free/reduced lunch, non-free lunch), and English language proficiency (limited English proficient and non-limited English proficient). A set of contingency tables were created to analyze the sample frequency distribution of the school accountability ratings and the schools students’ demographics (ethnicity, socioeconomic status, and English language proficiency). The data were analyzed using two-group independent-samples chi-square tests (Huck, 2012).
The research data analysis included assessments results from students attending three large public school districts in Texas. The data analysis included information from 398 public elementary schools representing 24,065 students. The students’ demographic variables included in the study were ethnicity, English language proficiency levels, and socioeconomic status. Also, the sample included schools rated at different levels of accountability based on the criteria defined by the Texas Education Agency in 2011 (Table 1).
Table 1
Elementary School Rating Based on TAKS Test
Results 2011 – Based on this study sample
School Rating |
Number of Schools |
Number of Students |
Exemplary |
78 |
5,740 |
Recognized |
174 |
10,471 |
Acceptable |
130 |
7,156 |
Unacceptable |
16 |
698 |
Total |
398 |
24,065 |
The possible relationships between school accountability rating and students’ demographics were evaluated using a non-parametric inferential statistical analysis. Research Questions were formulated to evaluate the relationship between school accountability rating and students’ demographics (ethnicity, socioeconomic status, and English language proficiency), in terms of the percentage of students who met the test expectations. The corresponding null hypothesis was there is no relationship between the school rating and the student’s demographic characteristics defined by ethnicity, socioeconomic status, and English language proficiency. In order to analyze this research question, the researcher used the percentage of students from different demographic groups that met the test expectation of schools with different accountability ratings. For comparison, each section includes the number of students that met the test expectation tabulated by school accountability rating and students demographic groups. The relationship between the school accountability rating the students’ demographic variables considering the passing rate on each group is analyzed using a contingency table chi-square analysis.
To determine whether there was a relationship between the schools’ accountability rating (Exemplary, Recognized, Academically Acceptable, and Academically Unacceptable) and the student’s population by ethnicity (Hispanic, Black, White, Asian), the data were analyzed using a 4x4 cross-tabulation. The number of students that met the academic expectations of all tests taken was tabulated by school rating and student ethnicity (Table 2). The chi-square test for independence reported a p-value lower than the alpha level .05, (X2, 9, N = 24,065) = 2,849.4, p < 0.001). Consequently, the null hypothesis for no relationship between the school rating and the student’s demographic characteristics defined by ethnicity was rejected. The findings of this study show a significant association between the TEA school rating and the student’s ethnic groups.
Table 2
Number of Fourth Grade Students That Met Expectations for
All TAKS Tests − 2011 − Ethnicity and TEA School Rating
School Rating |
Hispanic |
Black |
White |
Asian |
Total |
Exemplary |
2,804 |
1,062 |
1,591 |
283 |
5,740 |
Recognized |
7,565 |
1,928 |
829 |
149 |
10,471 |
Acceptable |
5,332 |
1,588 |
182 |
54 |
7,156 |
Unacceptable |
379 |
250 |
66 |
3 |
698 |
Total |
16,080 |
4,828 |
2,668 |
489 |
24,065 |
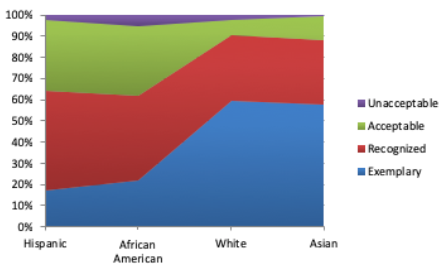
The population of students attending schools with different accountability rankings are not homogeneously distributed (Figure 1). Based on the data analyzed, there appeared to be a disparity among the school’s rating and the students’ ethnicity. In this sample, 91% of White students and 88% of Asian students attend Exemplary or Recognized schools. The student population of Recognized and Acceptable schools is 80% Hispanics and 73% African American students.
Figure 1
Distribution of fourth grade students attending public elementary schools
ordered by students’ ethnicity and school accountability rating 2011
School accountability and students’ socioeconomic status. The researchers used a 4x3 cross-tabulation contingency table to determine whether there was a relationship between the schools’ accountability rating (Exemplary, Recognized, Acceptable, and Unacceptable) and the students’ socioeconomic status (students qualifying for free lunch, reduced lunch, and no-free lunch). Table 3 presents the number of students that met the academic expectations of all tests taken in fourth grade tabulated by school rating and students’ socioeconomic status. The chi-square test for independence reported a p-value lower than the alpha level .05, (X2, 6, N = 20,785) = 3,168.4, p < 0.001). Consequently, the null hypothesis for no relationship between the school rating and the socioeconomic status defined by whether they qualify for free or reduced lunch was rejected. The findings of this study describe a significant association between the TEA school rating and the students’ socioeconomic status.
Table 3
Number of Fourth Grade Students That Met Expectations for All
TAKS test − 2011 − Socioeconomic Status and TEA School Rating
School Rating |
Free lunch |
Reduced lunch |
No Free Lunch |
Total |
Exemplary |
2,206 |
273 |
2,473 |
4,952 |
Recognized |
6,559 |
594 |
1,719 |
8,872 |
Acceptable |
5,666 |
238 |
464 |
6,368 |
Unacceptable |
465 |
34 |
94 |
593 |
Total |
14,896 |
1,139 |
4,750 |
20,785 |
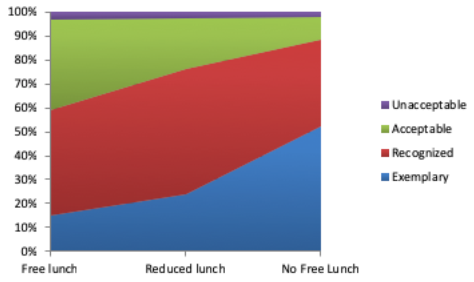
The population of students attending schools with different accountability ratings was not homogeneously distributed considering the students’ socioeconomic status (Figure 2). The data included in the study showed that 88% of the students that do not qualify to free or reduced lunch attended Exemplary or Recognized schools. However, 73% of students that qualified for reduced lunch and 82% of students that qualified for receive free lunch attended Recognized and Acceptable schools. Only 15% of students that received free lunch attended Exemplary schools and 52% of students that did not qualify for this benefit, representing wealthier families, attended schools rated as Exemplary.
Figure 2
Distribution of fourth grade students attending public elementary schools ordered
by students’ socioeconomic status and school accountability rating 2011
School accountability and students’ English language proficiency. To determine whether a relationship exists between the schools’ accountability rating (Exemplary, Recognized, Acceptable, and Unacceptable) and the student’s English language proficiency (English language learner (ELL) and non-English language learner), the researcher used a 4x2 cross-tabulation contingency table. School rating and students’ English language proficiency tabulated the number of students that met the academic expectations of all tests taken in fourth grade 2011 (Table 4). The chi-square test for independence reported a p-value lower than the alpha level .05, (X2, 3, N = 22,321) = 991.4, p < 0.001). Consequently, the null hypothesis for no relationship between the school rating and the students’ English language proficiency was rejected. The findings of this study show a significant association between the TEA school rating and the students’ English language proficiency.
Table 4
Number of Fourth Grade Students That Met Expectations for All TAKS Test
Taken − 2011 − English Language Proficiency and TEA School Rating
School Rating |
ELL |
No ELL |
Total |
Exemplary |
959 |
4,391 |
5,350 |
Recognized |
3,483 |
6,082 |
9,565 |
Acceptable |
3,018 |
3,719 |
6,737 |
Unacceptable |
198 |
471 |
669 |
Total |
7,658 |
14,663 |
22,321 |
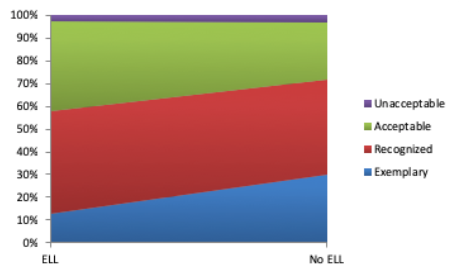
The population of students attending schools with different accountability ratings was not homogeneously distributed considering the students’ English language proficiency (Figure 3). The data included in the study showed that 71% of non-English language learners attended Exemplary or Recognized schools. However, 84% of students that are learning English attended Recognized and Acceptable schools. Only 13% of ELL attended Exemplary schools compared to 30% non-ELL attending to schools rated with the highest accountability level.
Figure 3
Distribution of fourth grade students attending public elementary schools ordered
by students’ English language proficiency and school accountability rating 2011
Texas was one of the pioneer states to implement the use of standard-based assessment results to create a school accountability system for public education. Some of the ideas founded on the Texas accountability system facilitated the design of the current federal educational reform, the NCLB act. After 12 years of implementation, the effects of the consequential accountability system defined by NCLB and the use of a standards-based accountability approach is being evaluated regarding the overall impact on improving the academic achievement of U.S. public education. Since the use of end-of-the-year standardized assessments will continue to be an essential tool to measure the school quality, it becomes important to design an accountability system that incorporates multiple dimensions describing the effectiveness of the educational program being implemented based on each school’s characteristics. This research was an examination of how the accountability system implemented in Texas during the years 2003 to 2011 considered the school population and standardized tests scores at the elementary level to assign a school rating that accounted for school academic effectiveness.
The analysis of the relationship between the students’ demographic characteristic and the school accountability rating revealed that students’ ethnicity, socioeconomic status, and English language proficiency are demographic variables significantly associated with the accountability rating assigned by TEA in 2011. The status approach based accountability system, used in Texas between 2004 and 2011, incorporated the percentage of students meeting the passing standard by school to assign the school rating. Therefore, schools with a higher proportion of students meeting the passing standard received the higher rating. This system seems logical toward holding schools accountable for having students master the grade level curriculum. However, the problem with this accountability model is that the use of the same end scale for measuring every school and every student attending public schools in the U.S. is done without recognizing the well-documented differences in the academic achievement of the diverse population of students (Baker & Johnston, 2010; Beatty, 2013; Hsieh, 2013). The results observed in this research confirm patterns described in the literature in which the students’ demographic attributes are related to their academic achievement (Hemphill, Vanneman, & Rahman, 2011; Reardon, 2013). The three demographic variables analyzed (students’ ethnic group, socioeconomic status, and English language proficiency) were significantly associated with the accountability rating granted to the school. The results of the data analysis indicated the accountability rating assigned to each school (Academically Unacceptable, Academically Acceptable, Recognized, and Exemplary) is not determined only by the effectiveness of the educational programs delivered to the students. Instead, students from more advantaged families added a significant impact on the final accountability rating assigned to each school. A scenario where school effectiveness is not statistically determined by the student demographic characteristics and exclusively defined by students’ academic achievement would be obtained by considering the students’ academic progress. Hence, no significant effects of students’ social background will impact the overall school rating. Based on these research findings, the accountability rating assigned to elementary schools did not represent only the quality of the education those students were receiving. Therefore, this accountability model is vulnerable to rewarding schools that serve students from economically advantaged backgrounds and penalize schools located in more disadvantaged context (Zvoch & Stevens, 2008). The results of this investigation confirm these statements regarding the restrictions of a status-based accountability model.
From the analysis of the data, it is possible to conclude the accountability ranking assigned to elementary schools in Texas was not only determined by the efficiency of the academic program implemented on each school. Hence, different students’ demographic variables showed to be significantly associated with the accountability rating assigned to elementary schools. Considering these research results, a discussion regarding what are the best accountability models to evaluate the school academic effectiveness should be explored. Recently, the Texas Education Agency implemented a new accountability model based on a new standardized end-of-the-year assessment (STAAR) and a new generation school accountability system. Under the new model school rankings are Met Standard or Improvement Required, which are based on four performance indexes that include student achievement, student progress, closing the performance gaps and postsecondary readiness (Texas Education Agency, 2013). The new accountability model represents a more systemic approach to define the schools’ academic performance compared with the previous model. The current accountability model includes a closing the achievement gap component weighting the STAAR test academic achievement by 30% and academic growth by 50% (The Texas Education Agency, 2019). This method to determine the school ranking provide a fairer way to evaluate schools progress on standardized assessment considering the student´s population characteristics. Also, the school rating scale uses a more positive language to communicate the school standardized assessments results, avoiding negative labeling (like Academically Unacceptable).
However recent research still report differences on performance on standardized assessment considering children attending bilingual or ESL English programs (reading and mathematics) and school districts located at the Texas border with Mexico compared with non-border school districts (Tang, Wang & Min 2019; Vela, Jones, Mundy & Isaacson, 2017). Efforts have been made to close the achievement gap of minority students’ populations (i.e. Hispanic) by providing more option to access higher education, but the results show that Hispanic college enrollment significantly increased as a result these initiatives, but graduation did not (Tajalli & Ortiz, 2017). This is an indicator that projecting minority student population to successfully pursue higher education careers should be based also on providing a quality education at primary and secondary level.
School accountability is a fundamental part of current educational reform. Setting a common curriculum across content areas and defining common core standards in all the states seems to be a trend that will continue. Similarly, end-of-the-year standards-based assessments continue to be the primary indicator of school academic effectiveness. In this study, the researchers examined the elementary schools’ results on standards-based assessments considering the schools’ rating and demographic characteristics. The information analyzed in the study could contribute to the discussion about the best methodology to determine school academic progress considering a systemic approach that integrates the end-of-the-year assessments results and the characteristic of the student population. In 2011, the leaders at TEA implemented a new accountability system called the STAAR, which replaced TAKS. The school accountability system associated with the STAAR results is currently under review as a measure for student achievement and for rating school performance. The data examined in this research might contribute to the discussion about how a public education system, with a diverse population of students, should use end-of-the-year standards-based assessments scores to hold schools accountable about the quality of education provided.
Baker, M., & Johnston, P. (2010). The impact of socioeconomic status on high stakes testing reexamined. Journal of Instructional Psychology, 37(3), 193-199.
Ballou, D., Sanders, W., & Wright, P. (2004). Controlling for student background in value-added assessment of teachers. Journal of Educational and Behavioral Statistics, 29(1), 37-66.
Beatty, A. S. (2013). Schools alone cannot close achievement gap. Issues in Science & Technology, 29(3), 69-75.
Darling-Hammond, L. (2007). Race, inequality, and educational accountability: The irony of “no child left behind.” Race, Ethnicity and Education, 10(3), 245-260.
Dronkers, J., & Avram, S. (2010). A cross-national analysis of the relations of school choice and effectiveness differences between private-dependent and public schools. Educational Research and Evaluation, 16(2), 151-175.
Fuller, B., Wright, J., Gesicki, K., & Kang, E. (2007). Gauging growth: How to judge no child left behind? Educational Researcher, 36(5), 268-278.
Harris, D. M. (2012). Postscript urban schools, accountability, and equity: Insights regarding NCLB and reform. Education and Urban Society, 44(2), 203-210.
Heilig, J. V., Cole, H., & Aguilar, A. (2010). From Dewey to no child left behind: The evolution and devolution of public arts education. Arts Education Policy Review, 111(4), 136-145.
Hemphill, C., Vanneman, A., & Rahman, T. (2011). Achievement gaps: How Hispanic and white students in public schools perform in mathematics and reading on the national assessment of educational progress (Statistical Analysis Report No. NCES 2011459). Washington, DC: NCES.
Honigsfeld, A., & Giouroukakis, V. (2011). High-stakes assessments and English language learners. The Delta Kappa Gamma Bulletin, 77(4), 6-10.
Horn, C. (2003). High-stakes testing and students: Stopping or perpetuating a cycle of failure? Theory into Practice, 42(1), 30-41.
Huck, S. W. (2011). Reading statistics and research (6th ed.). Boston, MA: Pearson.
Kress, S., Zechmann, S., & Schmitten, M. (2011). When performance matters: The past, present, and future of consequential accountability in public education. Harvard Law School Journal on Legislation, 48(1), 185-234.
Krieg, J. M. (2011). Which students are left behind? The racial impacts of the no child left behind act. Economics of Education Review, 30(4), 654-664.
Maleyko, G., & Gawlik, M. A. (2011). No child left behind: What we know and what we need to know. Education, 131(3), 600-624.
Martin, V., & Lázaro, L. M. (2011). The race to educational reform in the USA: The race to the top. Language and Education, 25(6), 479-490.
Marzano, R. J., & Waters, T. (2009). District leadership that works: Striking the right balance. Bloomington, IN: Solution Tree.
Oakes, J., & Lipton, M. (2006). Teaching to change the world (3rd ed.). New York, NY: McGraw-Hill.
Pilotin, M. (2010). Finding a common yardstick: Implementing a national student assessment and school accountability plan through state-federal collaboration. California Law Review, 98(2), 545-574.
Price, H. E. (2010). Does no child left behind really capture school quality? Evidence from an urban school district. Educational Policy, 24(5), 779-814.
Ready, D. D. (2013). Associations between student achievement and student learning implications for value-added school accountability models. Educational Policy, 27(1), 92-120.
Reardon, S. F. (2013). The widening income achievement gap. Educational Leadership, 70(8), 10-16.
Resnick, L., & Zurawsky, C. (2005). Getting back on course: Standards-based reform and accountability. Retrieved from http://datacenter.spps.org/uploads/SOTW_Standards_Based_Reform_and_Accountability_10_28_05.pdf
Schraw, G. (2010). No school left behind. Educational Psychologist, 45(2), 71-75.
Stronge, J. H., Ward, T. J., Tucker, P. D., & Hindman, J. L. (2007). What is the relationship between teacher quality and student achievement? An exploratory study. Journal of Personnel Evaluation in Education, 20(3), 165-184.
Tajalli, H. & Ortiz, M. (2017): An examination of Hispanic college enrollment and graduation: Has the Texas Closing the Gaps plan been successful?, Journal of Latinos and Education, DOI: 10.1080/15348431.2017.1348301
Tang, S., Wang, Z. & Min, Y. (2019). Texas–Mexico Border vs. Non-Border School Districts’ Growth Trajectory of High-Stakes Reading Performance: A Multi-Level Approach. Education Science, 38 (9), 1-15.
Texas Education Agency. (2010, December 3). House Bill 3 transition plan. Retrieved from http://www.tea.state.tx.us/student.assessment/hb3plan/
Texas Education Agency. (2011, October 20). Brochures. Retrieved from http://www.tea.state.tx.us/index2.aspx?id=2147485434&menu_id=692&menu_id2=796&cid=2147483661
Texas Education Agency. (2013). Accountability rating system. Retrieved from http://ritter.tea.state.tx.us/perfreport/account/2013/faq.html
Vela, A., Jones, D., Mundy, M. & Isaacson, C. (2017). Determining the effectiveness of bilingual programs on third grade state exam scores. Research in Higher Education Journal, 33, 1-15.
Zvoch, K., & Stevens, J. J. (2008). Measuring and evaluating school performance: An investigation of status and growth-based achievement indicators. Evaluation Review, 32(6), 569-595.
1. Assistant Professor, Head of Fundaments of Pedagogy Department. Universidad Católica de la Santísima Concepción, Chile. Centro de Investigación y Desarrollo CIEDE-UCSC. Contact e-mail: fsepulveda@ucsc.cl