![]() ISSN 0798 1015
ISSN 0798 1015

![]() ISSN 0798 1015
ISSN 0798 1015
Vol. 40 (Number 30) Year 2019. Page 1
TIKHOMIROVA, Tatiana 1 & NECHETOVA, Alena 2
Received: 10/04/2019 • Approved: 24/08/2019 • Published 09/09/2019
ABSTRACT: This paper represents a survey of techniques and methods for modeling unemployment in the labor markets of developed countries, Russia, and Russia’s regions. The work shares a set of author-developed econometric models for the short-term and mid-term forecasting of unemployment in Russia, which are adapted to the conditions of the nation’s economic development. The authors substantiate the interrelationship between the unemployment level and some factors like oil prices, the Consumer Sentiment Index, an author-proposed labor market indicator, and others. Also consider the causes of variances between model assessments of the unemployment level in Russia and official statistical data (2015–2017), which appear to be associated with hidden unemployment in the country. |
RESUMO: Este artigo representa um levantamento de técnicas e métodos para modelar o desemprego nos mercados de trabalho na Rússia e nas regiões da Rússia. O trabalho compartilha um conjunto de modelos econométricos desenvolvidos por autores para a previsão a curto e médio prazo do desemprego na Rússia, que são adaptados às condições do desenvolvimento econômico da nação. Os autores substanciam a inter-relação entre o nível de desemprego e alguns fatores, como os preços do petróleo, o Índice de Sentimento do Consumidor, o indicador do mercado de trabalho e outros. Considere também as causas das variações entre as avaliações do modelo do nível de desemprego na Rússia e os dados estatísticos oficiais (2015-2017), que parecem estar associados ao desemprego oculto no país. |

The labor market develops under the influence of multiple factors. Hidden unemployment, interregional migration flows, and seasonal employment make it harder to model processes in the labor market. In this situation, it is quite difficult to obtain adequate assessments of unemployment and substantiate activities on reducing it. The existing imbalance between the manpower demand and supply restricts the potential of both job seekers to land a job that matches their education and employers to have their vacancies filled, with the latter forced under these conditions to focus on resolving issues related to upskilling their workforce. This results in greater tension across the regional labor markets and in the national labor market as a whole. All this signals the need to develop and implement in practice a set of methods for managing the labor market. A crucial aspect of this kind of management is the appropriate interregional distribution of labor resources with a proper focus on taking account of regional balances between the manpower demand and supply (Tikhomirova & Sukiasyan, 2014; Tikhomirova, 2015; Lialina, 2019). The development of these methods is, inter alia, based on forecasting the unemployment rate using various metrics, including the characteristics of unemployment and employment, job offer indexes, various integrated characteristics of working conditions (pay, personnel skills, etc.) (Tikhomirova & Lebedeva, 2015; Davydenko et al., 2017; Plenkina and Osinovskaya, 2018; Tung, 2019).
Within the frame of this study, the authors examine a set of techniques and methods for assessing and forecasting unemployment in certain countries of the world and in Russia. These tools were adapted to source information for those nations. The paper features a set of author-developed models for forecasting the unemployment rate in Russia based on the following: official statistics on unemployment (the number of registered unemployed individuals per 1,000 people), variance between the official values for the unemployment level and the actual ones, level of insured unemployment, Labor Market Conditions Index, and an indicator of unemployment in periods of growth. All of these indicators characterize unemployment in the labor market in general, but each of them also reflects certain specific characteristics thereof. Accordingly, factoring them into models that reflect the dynamics of this phenomenon helps boost the models’ reliability and enhance their prognostic potential.
On the whole, models for forecasting unemployment employed in the practice of managing employment can be divided into two major groups: those for short-term and those for mid-term forecasting. Below is a detailed description of each of these types of model.
The literature offers various techniques for producing short-run forecasts of unemployment. Most of these techniques are predicated on the use of ARIMA models, which tie current values for its indicators in with its levels from past periods. This way to represent the unemployment process is normally justified when there is a stable economic situation, which predetermines certain entrenched consistent patterns in its dynamics. When the situation changes, these patterns are, naturally, substituted for by other patterns. In this context, the credibility of unemployment forecasts obtained via ARIMA models depends on the rationale for suppositions regarding the persistence of a stable situation under which those models were developed. This supposition may be viewed as justified when it comes to short-run forecasts, which predetermines the advisability of employing models of this class in the short-term forecasting of unemployment specifically.
For instance, in the US they use the ARMA (3,1) model to forecast the Labor Market Conditions Index (LMCI). This index is estimated based on 19 major indicators, which include unemployment as well (Chung, Fallick, Nekarda, & Ratner, 2014). The use of this model helps offset minor fluctuations of the index’s factors, identify a key trend in its dynamics, and obtain quite credible short-term forecast assessments of its values. However, the specificity of the index’s characteristics does not let one make an extensive use thereof to model the labor market in other countries. Plus, relatively low is the predictive capability of the ARMA (3,1) model, which provides reliable forecasts of the LMCI based on two points only, with subsequent projected values characterized by lower reliability and a considerable confidence interval.
Auto-regression models are also used in the UK to assess the labor market. In particular, works by N. McLaren and R. Shanbhogue (2011) and N. Askitas and K.F. Zimmerman (2009) feature unemployment forecasts developed based on these models. Note that the authors used as their source data variances in unemployment rates as recorded by official statistical sources and various sources across the Internet.
Researchers have used auto-regression models to assess the labor market in Italy as well. For instance, a work by C. Lacava (2008) examines models such as ARIMA, SARIMA (an ARIMA model with seasonality), and ARTM (Additive Regularization of Topic Models), employed to describe the dynamics of unemployment (based on gender, education level, and region).
Here it is worth noting that the above-mentioned variants of the ARIMA type model have been developed for specific regions and are, normally, not adequate to the conditions of development of unemployment in other regions with certain distinctive characteristics.
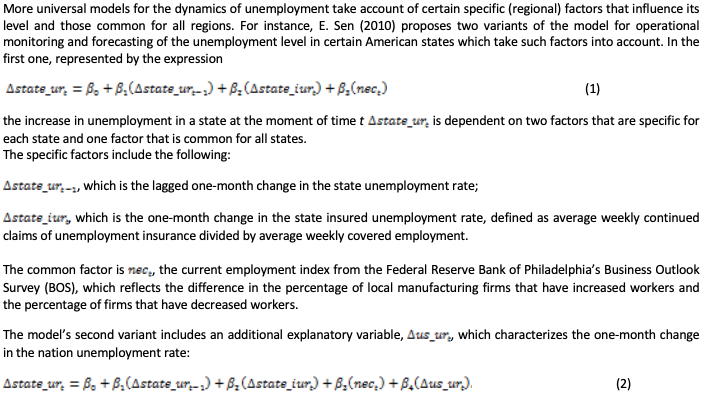
Based on the outcomes of comparing the actual data on unemployment with the projected values obtained for various states based on the above model variants, the models’ prognostic capabilities are nearly the same. For some states, assessments of the unemployment level obtained via Model 1 are better than those obtained via Model 2, while for others it is the other way round. In a published monthly forecast of the unemployment rate across the states Pennsylvania, New Jersey, and Delaware for the period January 2008 to August 2010, the actual unemployment rate was matched by 90% of the projected values. Earlier, a similar technique (Fernández, Menéndez, & Suárez, 2004) was employed to forecast employment in various sectors for the Spanish region Asturias, although the ARIMA type models appear to have demonstrated better prognostic results.
The above variants of unemployment model meet the requirements of operational efficiency, factor in regional characteristics, and are quite universal for the American states. However, they cannot be used in relation to many countries of the world, as there is a lack of statistical information across regions on variables of monthly change in insured unemployment and the current employment index.
Similar auto-regression models for assessing unemployment have been brought forward in works by Russian researchers and those from other countries (Schanne, Wapler, & Weyh, 2010; Semerikova & Demidova, 2016; Sukhanova & Shirnaeva, 2016). Shirt-term unemployment forecasts obtained based on them are characterized by quite a high degree of alignment with the actual data, which is testimony to the potential for using them in the operational management of unemployment in the regional labor markets.
For mid-term forecasts of unemployment, it may be possible to employ multifactor econometric models that can help identify key consistent patterns in its development by reference to the effect of socio-economic processes on it.
Models like these have been employed to assess unemployment by many researchers around the world (Mason, 2011; Malizia & Ke, 1993). With them, the unemployment level in a certain country or a region within it is dependent from a set of factors that characterize the socio-economic situation. These factors include income levels, level of development of various sectors of the economy, quality of life, and many others. Certain researchers have also added migration to this list of factors (Izraeli & Murphy, 2003; McCormick & Sheppard, 1992; Lawson & Dwyer, 2002).
The authors find particularly noteworthy the multifactor model for assessing the unemployment level brought forward in a work by A.S. Zeilstra and J.P. Elhorst (2006). What sets the model apart is that it incorporates various types of factors: regional and macroeconomic. Thus, the model simultaneously takes account of interrelationships between unemployment and the external and internal economies, which makes it possible to assess the process under study more accurately, as well as model the structural characteristics of the regional labor markets.
The largest number of factors is utilized as part of the multifactor models for assessing unemployment described in a work by P. Huber (2013). One of the models incorporates 26 source factors, and the second one includes 34 factors. In the authors’ view, using this many variables in a model is not a very effective thing to do. In an attempt to achieve the best approximation of model values, the researcher incorporates into the model a large number of factors, which oftentimes is accompanied by various effects, like, for instance, multicollinearity, which distorts the significance of the influence of each of them on the dependent variable. When there are numerous factors employed, one will not be able to eliminate the multicollinearity effect using special methods (e.g., the main components method) either. On top of that, to be able to credibly assess the parameters of such multifactor models, one will need a considerable number of observations, which are not always available.
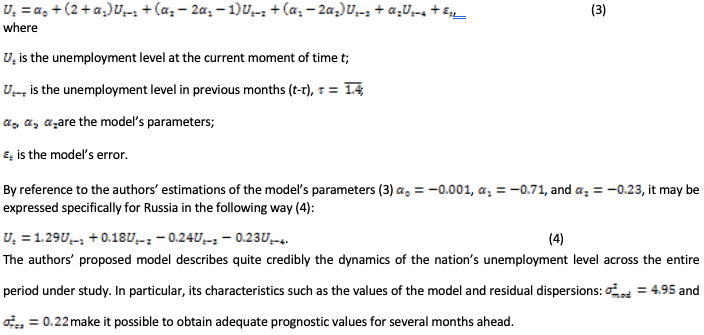
As part of this study, to generate short-term forecasts of unemployment in Russia the authors developed an ARIMA(2,2,0) auto-regression model that utilizes an integrated array of monthly values for the unemployment level Ut in the country, with unemployment values for the period from October of 1994 to October 2017 taken as source data (3):
Boosts in the credibility of forecasts of the unemployment rate are also linked with a preliminary substantiation of a certain phase in its dynamics. At its simplest a phase of this kind may be an increase or a decrease in it. This approach is new and has yet to enter wide use in science. A rationale for it has been provided in works by C.A. Fleischman and J.M. Roberts (2011) and R. Barnichon and C.J. Nekarda (2012), in which it is suggested that periods of growth and decline in unemployment should be modeled separately.
The model of expected growth in unemployment is a multifactor econometric relationship with lag exogenous variables represented by selected socio-economic and financial indicators which govern growth in this phenomenon. The reason behind the use of these indicators instead of classic ones is that they are the first to react to changes in the nation’s macroeconomic situation, which, in turn, helps model projected values for unemployment and assess the labor market’s future reaction to these changes.
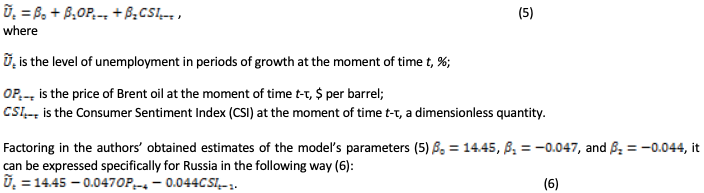
The model on anticipated growth in unemployment developed by the authors for Russia, based on the use of monthly data for the period October 1994 to October 2017, is represented by the following equation (5):
The model’s determination coefficient is above 90%.
The reason behind modeling unemployment separately based on growth and decline phases is the very nature of this phenomenon – its cyclicity and asymmetry, including gender asymmetry. Specifically, issues related to the separate modeling of periods of growth and decline in unemployment due to its cyclicity have been explored in works by R. Barnichon (2012) and A. Golan and J.M. Perloff (2004). Meanwhile, a focus on the asymmetry effect in modeling unemployment can be traced in works by P. Rothman (1998), C. Milas and Р. Rothman (2008), S. Moshiri and L. Brown (2004), and K.G. Abazieva and M.V. Grishin (2010).
To generate mid-term forecasts of Russia’s unemployment level, the authors developed a special multifactor regression model. The model factors in various social and economic indicators that are explanatory of the dynamics of this phenomenon in Russia.
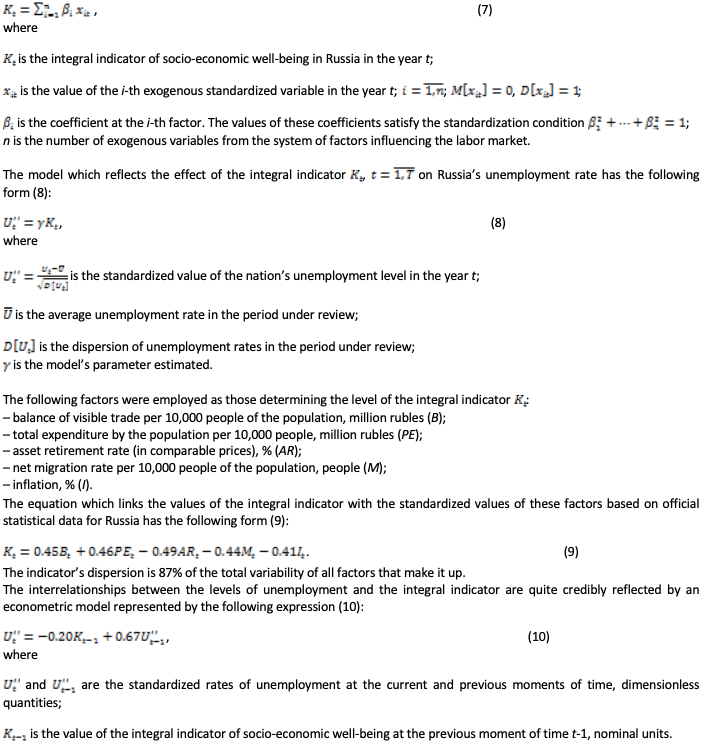
To prevent the effect of multicollinearity between these factors on assessments of the model’s coefficients, in obtaining them the authors employed the main components method. In accordance with this method, the authors used the selected factors’ annual values for the period 1994–2017 to put together an integral indicator of socio-economic well-beingviewed as the only variable that is explanatory of consistent patterns of change in unemployment in the country. This index was determined as a linear combination of standardized values of the factors, as per the following expression (7):
Model 10 does quite a good job approximating the unemployment process, its determination coefficient being over 88%.
The ARIMA (2,2,0) model (Expression 4) has shown itself to be quite a reliable tool for generating short-term assessments of Russia’s unemployment level. Based on its estimates for 1–3 months, the nation’s unemployment rate will be 5.4–5.6%.
Since the model is based on retrospective analysis of the process’s actual time series, it does not factor in the effect of external factors on unemployment. In this context, if monitoring unemployment is aimed exclusively at the indicator’s negative dynamics, i.e. growth in unemployment, it would be more effective to employ a model for expected growth in unemployment based on advance influence factors. What makes such models unique is the use of sustainable lag relationships between the unemployment rate and advance influence factors, which would be more elastic to changes in the macro-economy and signal an upcoming rise in unemployment.
The choice of Brent oil prices and CSI as indicators of unemployment in Russia was governed by their significance as characteristics of the nation’s economic situation. Oil prices have been a driver of Russia’s economy due to its entrenched focus on resources (Tikhomirova & Nechetova, 2014). As for the CSI, it reflects the population’s reaction to the socio-economic situation in the country.
Researchers T.M Tikhomirova and A.Iu. Nechetova (2017) have utilized methods of phase analysis, which helps offset the effects of the volatility of the time series under consideration (unemployment level, oil prices, and CSI), to establish a lag relationship between the CSI and oil prices and the unemployment rate based on quarterly and monthly data. In particular, it was proven that the CSI was ahead of the unemployment rate by one month, while the price of oil – by 4 months.
Based on the elasticity coefficients of the authors’ Model 6, when the price of oil increases $10 per barrel, Russia’s unemployment rate drops by 0.47%, while, when the CSI increases by 10%, one should expect a 0.44% drop in the unemployment rate.
Figure 1 displays graphs reflecting the dynamics of actual monthly data on Russia’s unemployment and estimates thereof obtained via Model 6 for the period 1994–2017.
Figure 1
Comparison of the dynamics of actual values for Russia’s unemployment
level with estimates thereof obtained via Model 6 (1994–2017).
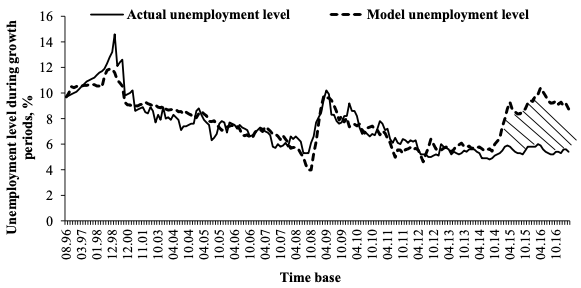
The graphs provided in Figure 1 also attest to an increased variance between the actual and model values for the unemployment level between 2015 and 2017 – the model estimate surpasses the actual values by 5-6%. In the authors’ view, these variances may be testimony to hidden unemployment in Russia, which is hard to gauge or assess.
One of the ways to understate the unemployment level is to shift workers from a full working day to an incomplete one. This issue is of an international nature and has repeatedly been the subject of discussion at the meetings of the International Labour Organization (ILO). ILO analysts have identified a few other forms of employment which are often used to understate the level of official unemployment, which are temporary employment or side work, online employment, multiple employment, and self-employment.
Russia is currently also faced with the issue of increases in the number of employees working part-time. Rosstat’s official website provides statistical data on the number of workers for whom the shift from a full working day to an incomplete one was undertaken exclusively at the employer’s initiative. For instance, in the third quarter of 2014 (the initial period of the model values for unemployment deviating from the actual ones) Russia’s total number of employees working part-time at the employer’s initiative was 81,000. In the second quarter of 2016, the figure reached 147,000 people, an increase of 1.8 times. In the first quarter of 2017, the number of employees working part-time at the employer’s initiative was down insignificantly – to 132,000. The rate of growth in this indicator is testimony to the fact that over the last several years people have been forced to work on terms that do not suit them but have not been considered as unemployed.
Thus, comparing model and officially recorded unemployment levels may help identify the size of its hidden component. In addition, the above models for unemployment may also help assess systematic distortions in official statistical data. The authors are of the view that those distortions have to do with the understatement of the real levels. This is attested by the fact that Russia’s average unemployment level for the 20-year period under review is about 8%. At the same time, a similar value that characterizes the average value for unemployment in periods of its growth came in at 14.5% in Model 6, based on advance influence factors. Thus, it may concluded in comparing the two values that under unvaried conditions of the external environment the level of unemployment in Russia will not be more than 8%, while in crisis situations, under the influence of global market conditions, it may grow to 14.5%.
The impact of factors characterizing the macroeconomic situation in the country on the unemployment level is indicated by graphs reflecting the dynamics of the integral index of the socio-economic situation in the country ( ) and the unemployment level in the period 1994–2017 in Figure 2.
For mid-term forecasts of unemployment in Russia, one may employ a multifactor regression model that incorporates – as an explanatory variable – an integral macroeconomic indicator of socio-economic development, obtained based on the main components method (see Model 10).
Figure 2
Dynamics of the unemployment level and the integral index
of social-economic well-being in Russia (1994–2017).
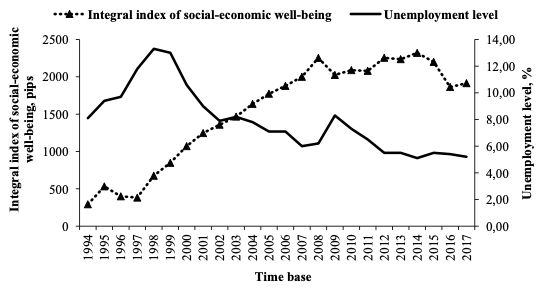
On the whole, these graphs attest to that an increase in the values of the integral indicator, which characterizes improvements in the nation’s socio-economic situation, is accompanied by a drop in the unemployment level. In other words, these processes in the period under review are characterized by a negative correlation. Of certain interest are changes in indicator trends for the last three years. It should be noted that, while there was a considerable decrease in the values of the integral indicator between 2014 and 2016, the unemployment level rose a little in 2016 relative to 2014, and that is considering that 2015 witnessed an increase in unemployment. This may be testimony to unemployment rate values being understated by official sources. Based on the elasticity coefficients in Model 10, when there is a 10-unit increase in the integral indicator of socio-economic well-being at the previous moment of time, the unemployment level in the current period will drop by 2%. Figure 3 illustrates a comparison of a set of actual and estimated values for the unemployment level obtained based on Model 10.
Figure 3
Comparison of the dynamics of actual values for unemployment in Russia
with projected values for it, obtained via Model 10 (1994–2019).
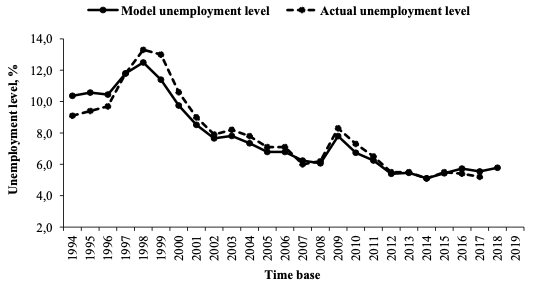
As evidenced by the graphs in Figure 3, the model levels of unemployment in Russia in the period 2015–2017 were a bit higher than the official ones (by about 6-7%), which also is testimony to actual values being understated. Based on a forecast via Model 10, in 2019 Russia’s unemployment rate will be 5.83%.
This model makes it possible to obtain mid-term assessments of unemployment not only for the labor market of Russia as a whole but each of its individual regions as well.
In developing forecasts of the unemployment level in a country and its regions, it may help to take into account a whole array of conditions that define the project’s aims, the characteristics of setting the objective for forecasting, the composition and volume of source information, the interrelationship between particular indicators, etc.
The development of short-term forecasts of unemployment (for 1–3 periods) is based on suppositions about the stability of the nation’s social-economic situation, which influences its level, and the persistence of entrenched consistent patterns in its dynamics in the near future. These consistent patterns can, with sufficient credibility, be described by ARIMA models, in which the unemployment rate in the current period is determined by their values in previous periods.
In particular, in forecasting the unemployment rate for several months, good results were achieved using the ARIMA(2,2,0) model, which reflects the linear relationship between the second increases in unemployment in the current period with similar increases in two previous periods.
At the same time, ARIMA models do not let one obtain credible results when there is a change in the situation in a country or a region that entails a change in consistent patterns in unemployment dynamics. In a situation like this, more credible forecasts of unemployment can be obtained via multifactor econometric models, which take into account the effect on it of factors that predetermine the laws governing its development. These factors normally include key macroeconomic indicators that characterize the economic situation in a country or a region. More specifically, in developing this kind of models for Russia, one could use balance of visible trade, population spending, asset retirement rate, net migration rate, and inflation.
A key issue in developing multifactor models for forecasting unemployment is the need to prevent the effect of possible correlation interrelationships between factors on assessments of their coefficients. When they are there, it may be advisable to assess the models’ coefficients using the main components method. Based on this method, the authors put in place for Russia an integral indicator that characterizes a state of the national economy that has an effect on the unemployment rate. In particular, this indicator attests that increases in the nation’s unemployment rate are associated with an increase in the asset retirement rate and an increase in in-migration and inflation, while declines in it – with an increase in the rate of economic growth.
Econometric models with principal components appear to be quite an effective tool for forecasting Russia’s unemployment level in a mid-term period of not more than three years. Having said that, the actual prognostic potential depends on the credibility of assessments of the characteristics of the country’s economic situation during the forecast period.
In forecasting unemployment during periods of its growth or decline, it may help to employ multifactor econometric models that factor in the advance effect of certain macroeconomic indicators on the level thereof. The work, in particular, shows that these factors in Russia may include oil prices and the CSI, which predetermine changes in the unemployment level four and one months, respectively, in advance.
The multifactor models for unemployment obtained for Russia also led the authors to venture the assertion about the actual values for it being understated, which, among other things, is due to official documentation not including data on hidden unemployment (associated with part-time employment, mandatory leave, and other types thereof).
The study was conducted with financial support from the Russian Foundation for Basic Research (Project No. 18-010-00513, entitled ‘Development of Strategies for Russia’s Shift to Expanded Reproduction’).
Abazieva, K. G., & Grishin, M. V. (2010). Gendernaya asimmetriya bezrabotitsy: Obshchaya dinamika i vliyanie krizisa [Gender asymmetry in unemployment rates: General dynamics and the impact of the crisis]. Uchet i Statistika, 3, 53–60. (in Russian).
Askitas, N., & Zimmerman, K. F. (2009). Google econometrics and unemployment forecasting. Applied Economics Quarterly, 55(2), 107–120.
Barnichon, R. (2012, March). Vacancy posting, job separation and unemployment fluctuations. Journal of Economic Dynamics and Control, 36(3), 315–330.
Barnichon, R., & Nekarda, C. J. (2012, November 21). The ins and outs of forecasting unemployment: Using labor force flows to forecast the labor market (FEDS Working Paper No. 2013-19). Retrieved from Federal Reserve website: https://www.federalreserve.gov/pubs/feds/2013/201319/201319pap.pdf
Chung, H. T., Fallick, B., Nekarda, C. J., & Ratner, D. D. (December, 2014). Assessing the change in labor market conditions (FEDS Working Paper No. 2014-109). Retrieved from Federal Reserve website: https://www.federalreserve.gov/econresdata/feds/2014/files/2014109pap.pdf
Davydenko V.A., Kaźmierczyk, J., Romashkina G.F., Żelichowska, E. (2017). Diversity of employee incentives from the perspective of banks employees in Poland - empirical approach. Entrepreneurship and Sustainability Issues, 5(1), 116-126.
Fernández, M. M., Menéndez, A. J. L., & Suárez, R. P. (2004). Defining scenarios through shift-share models. An application to the regional employment. Paper presented at the Regions and Fiscal Federalism: 44th Congress of the European Regional Science Association (ERSA), Porto, Portugal. Retrieved from https://www.econstor.eu/bitstream/10419/117193/1/ERSA2004_454.pdf
Fleischman, C. A., & Roberts, J. M. (2011, October). From many series, one cycle: Improved estimates of the business cycle from a multivariate unobserved components model (FEDS Working Paper No. 2011-46). Retrieved from Federal Reserve website: https://www.federalreserve.gov/Pubs/feds/2011/201146/201146pap.pdf
Golan, A., & Perloff, J. M. (2004). Superior forecasts of the U.S. unemployment rate using a nonparametric method. Review of Economics and Statistics, 86(1), 433–438.
Huber, P. (2013). Labour market institutions and regional unemployment disparities (WWWforEurope Working Paper No. 29). Retrieved from https://www.econstor.eu/bitstream/10419/125681/1/WWWforEurope_WPS_no029_MS95.pdf
Izraeli, O., & Murphy, K. J. (2003). The effect of industrial diversity on state unemployment rate and per capita income. Annals of Regional Science, 37(1), 1–14.
Malizia, E., & Ke, S. (1993, May). The influence of economic diversity on employment and stability. Journal of Regional Science, 33(2), 221–235.
Mason, S. (2011). Regional unemployment disparities and the affect of industrial diversity (Master’s thesis, Southern Cross University, New South Wales, Australia). Retrieved from https://epubs.scu.edu.au/cgi/viewcontent.cgi?article=1257&context=theses
McCormick, B., & Sheppard, S. (1992, March). A model of regional contraction and unemployment. The Economic Journal, 102(411), 366–377.
McLaren, N., & Shanbhogue, R. (2011). Using Internet search data as economic indicators. Bank of England Quarterly Bulletin, 51(2), 134–140.
Milas, C., & Rothman, Р. (2008). Out-of-sample forecasting of unemployment rates with pooled STVECM forecasts. International Journal of Forecasting, 24(1), 101–121.
Moshiri, S., & Brown, L. (2004, November). Unemployment variation over the business cycles: A comparison of forecasting models. Journal of Forecasting, 23(7), 497–511.
Lacava, C. (2014). Forecasting labour market indicators: Macro vs micro. Retrieved from https://editorialexpress.com/cgi-bin/conference/download.cgi?db_name=IAAE2014&paper_id=453
Lawson, J., & Dwyer, J. (2002, June). Labour market adjustment in regional Australia (RBA Research Discussion Paper No. 2002-04). Retrieved from Reserve Bank of Australia website: https://www.rba.gov.au/publications/rdp/2002/pdf/rdp2002-04.pdf
Lialina, A. (2019). Labor market security in the light of external labor migration: new theoretical findings. Entrepreneurship and Sustainability Issues, 6(3), 1105-1125.
Plenkina, V.V. Osinovskaya, I.V. (2018). Improving the system of labor incentives and stimulation in oil companies. Entrepreneurship and Sustainability Issues, 6(2), 912-926.
Rothman, P. (1998). Forecasting asymmetric unemployment rates. Review of Economics and Statistics, 80(1), 164–168.
Schanne, N., Wapler, R., & Weyh, A. (2010). Regional unemployment forecasts with spatial interdependencies. International Journal of Forecasting, 26(4), 908–926.
Semerikova, E. V., & Demidova, O. A. (2016). Ispol'zovanie prostranstvennykh ekonometricheskikh modelei pri prognoze regional'nogo urovnya bezrabotitsy [The use of spatial econometric models in forecasting the regional unemployment level]. Prikladnaya Ekonometrika, 3, 29–51. (in Russian).
Sen, E. (October, 2010). State unemployment rate nowcasts. Retrieved from https://www.philadelphiafed.org/-/media/research-and-data/publications/research-rap/2010/state-unemployment-rate-nowcasts.pdf
Sukhanova, E. I., & Shirnaeva, S. Iu. (2016). Prognozirovanie urovnya bezrabotitsy: Ekonometricheskii podkhod [Forecasting the unemployment level: An econometric approach]. Nauka XXI Veka: Aktual'nye Napravleniya Razvitiya, 1-2, 226–231. (in Russian).
Tikhomirova, T. M, & Nechetova, A. Iu. (2014). Ekonometricheskie modeli otsenki urovnya bezrabotitsy v regionakh RF v resursnoorientirovannoi ekonomike [Econometric models for assessing the unemployment level in Russian regions in a resource-oriented economy]. Ekonomika Prirodopol'zovaniya, 3, 4–25. (in Russian).
Tikhomirova, T. M., & Sukiasyan, A. G. (2014). Modified estimates of human potential in the regions of Russian federation taking into consideration the risks of health losses and social tensions. Ekonomika Regiona, 4, 164–177.
Tikhomirova, T. M. (2015). Uchet kadrovoi potrebnosti regionov RF v prognozirovanii struktury vypuska spetsialistov professional'noi podgotovki [Taking account of Russian regions’ manpower-related need for forecasts of the output of specialists who undergo vocational training]. Federalizm, 3, 55–74. (in Russian).
Tikhomirova, T. M., & Lebedeva, Y. S. (2015). Statistical modeling of migration attractiveness of the EU member states. Journal of Modern Applied Statistical Methods, 14(2), 257–274.
Tikhomirova, T. M, & Nechetova, A. Iu. (2017). Kratkosrochnoe prognozirovanie bezrabotitsy na osnove faktorov operezhayushchego vliyaniya [Short-term unemployment forecasting based on advance influence factors]. Federalizm, 2, 7–22. (in Russian).
Tung, L. T. (2019). Role of unemployment insurance in Sustainable development in Vietnam: Overview and policy implication. Entrepreneurship and Sustainability Issues, 6(3), 1039-1055.
Zeilstra, A. S., & Elhorst, J. P. (2006, September). Unemployment rates at the regional and national levels of the European Union: An integrated analysis. Paper presented at the Enlargement, Southern Europe and the Mediterranean: 46th Congress of the European Regional Science Association (ERSA), Volos, Greece. Retrieved from http://www-sre.wu.ac.at/ersa/ersaconfs/ersa06/papers/73.pdf
1. Department of Mathematical Methods in Economics in Plekhanov Russian Economic University, Russia. E -mail: tatiana-tikhomirova@list.ru
2. Department of Mathematical Methods in Economics in Plekhanov Russian Economic University, Russia