![]() ISSN 0798 1015
ISSN 0798 1015

![]() ISSN 0798 1015
ISSN 0798 1015
Vol. 40 (Number 34) Year 2019. Page 30
MARTYNOVA, Natalia, G. 1; BUDAROVA Valentina, A. 2; SHEREMETEVSKY, Artem, V. 3; DUBROVSKIY, Alexey V. 4; MALYGINA, Olesya I. 5; ZHARNIKOV Valeriy B. 6 & TELITSYN Vitaly, L. 7
Received: 17/06/2019 • Approved: 20/09/2019 • Published 07/10/2019
ABSTRACT: The article tells about the experience of application of technological solutions for processing the results of geodetic support of geophysical works in the territories of oil and gas fields. The object of research was a set of geophysical and geodetic field observations carried out in the territories of oil and gas fields, the subject - technological solutions for processing the results of planned high-altitude 3D seismic with the use of geographic information systems (GIS) and ground laser scanning. To develop the technology, the capabilities and geographic information systems were studied and a certain range of tasks were solved. |
RESUMEN: El artículo habla sobre la experiencia de la aplicación de soluciones tecnológicas para procesar los resultados del soporte geodésico de trabajos geofísicos en los territorios de los campos de petróleo y gas. El objeto de la investigación fue un conjunto de observaciones de campo geofísicas y geodésicas realizadas en los territorios de campos de petróleo y gas, el tema: soluciones tecnológicas para procesar los resultados de la sísmica 3D planificada a gran altitud con el uso de sistemas de información geográfica (SIG) y escaneo láser de tierra. Para desarrollar la tecnología, se estudiaron las capacidades y los sistemas de información geográfica y se resolvió un cierto rango de tareas. |

Land resources are important components of the biosphere, material conditions of life and activity of people (Kustysheva, Skipin, Petukhova, Dubrovsky, & Malygina, 2018). Particular attention is paid to the territories of oil and gas fields, as it is important to prevent negative processes in the use of land resources.
In the process of design, creation and operation of natural and technical systems receive a large amount of geodetic spatial information, reflecting the various aspects of the state of sustainable development of territories, including in time. Initial, the most accurate and detailed measurement and graphical information about the geospatial obtained as a result of the use of scientific and industrial complex geodetic technologies.
In geodetic practice, the concept of territorial formations as territories, including those allocated on an administrative basis, for example: territories equated to the Far North or territories of the Far North. In this article, the object of study is considered in the Far North, namely the Talinskoye field. The Talinskoye field is Located on the territory of the Russian Federation in the administrative-territorial unit in the Khanty-Mansiysk Autonomous Okrug – Ugra.
Geodetic basis of seismic exploration is created by development of geodetic networks thickening survey network, base geodetic networks for tie geological exploration.
When creating an information geological and geophysical space of the oil and gas territory, the main parameters are the results of geodetic support of ground geophysical works, including 3D spatial seismic survey, survey results obtained during ground laser scanning. In this case, a prerequisite is the use of modern means of processing, interpretation and presentation of the information received.
Seismic exploration is the main geophysical method of studying the structure of the Earth, as well as the main method in the search for minerals, engineering surveys. They can be carried out independently or in combination with other geological, geochemical and geophysical methods of research. Seismic exploration includes the study of the propagation of artificially generated elastic waves in the earth's crust and its upper mantle. In addition, they are designed to solve stratigraphic, structural, lithofacial, structural-formation, filtration, capacitive problems in the search for hydrocarbons.
The most common to date, the following types of seismic exploration – marine and land seismic exploration as areal-three-dimensional (3D) and profile-two-dimensional (2D), area-three-dimensional-monitoring (4D), area-three-three-component (3D-3K), and well multicomponent.
3D seismic surveys are carried out on a cycle of detailed studies, which are necessary to obtain continuous spatial parameters of the objects under study, and for the preparation and transmission of this data for exploration drilling, as well as for pre-exploration of objects during operational and exploration drilling. Seismic exploration by 3D method is carried out using area observation systems (Oil book: the term "3D seismic exploration").
Definition of terms in 3D, planning and design of shooting, orthogonal geometry, the multiplicity, the size of the search object, horizontal resolution, vertical resolution, depth of a search object, the interference of refracted waves, the maximum tensile normal increment, block diagrams, equations, spreadsheets of 3D project, researched options strategy field setups presented in the book Planning Land 3-D Seismic Surveys (Cordsen, Galbraith, & Peirce, 2000).
Today it is already obvious that the possibilities of area (3D) seismic exploration with different technologies of exploration and development of hydrocarbon deposits have surpassed all, even the most optimistic forecasts. Thanks to its use, the value of such an important indicator as the percentage of successful drilling for the detection of hydrocarbons has increased significantly, the production of raw materials, etc. All this as a result has radically adjusted the economic performance of production projects, made them more attractive to subsoil users. In addition, 3D seismic exploration for the first time provided geologists, geophysicists and field workers with the opportunity to obtain information about the structure of the medium in the inter-well space, formed by the results of dynamic analysis of the seismic wave field, conducted on the basis of accurate well information.
The variety of methods and modifications of geophysical studies, landscape and climatic conditions in which they are performed, makes it necessary to use a wide range of technical means, methods and technologies for their geodetic and navigational support, including their complex application (Guidelines for the use of spatial seismic 3D at different stages of exploration for oil and gas, 2000). In scientific works it is noted that "the tools for effective use of the results of complex field observations of the studied objects and processes are geographic information systems (GIS) and created on their basis a single geographic information basis of the oil and gas field" (Dubrovsky & Malygina, 2015).
A more problematic part is the automated processing of heterogeneous results of geodetic and navigational support of profile and area seismic exploration, represented by well-known complexes of appropriate techniques and technologies, in particular, developed on the scientific and production base of JSC "GEOTECH" holding.
In modern conditions of development of geoinformation technologies there is an opportunity of the automated processing of geophysical data and creation of "through" technology on the uniform geoinformation basis providing full combination of formats of intermediate and final results.
Therefore, it was required to develop a single-format methodology and technology of geodetic support of territories in order to create and build highly informative maps of the location of geophysical observations of 3D seismic surveys. For this purpose, the authors set and solved the following tasks:
- review and analysis of methods and technologies of automated processing of the results of geodetic support of longitudinal and area seismic survey in comparison with geodetic support of other geophysical methods of prospecting and exploration of mineral deposits;
- justified requirements for improving the quality and performance of automated processing of the results of geodetic seismic survey;
- a comparative analysis of the existing methods of processing the results of planning and high-altitude 3D seismic survey on the territory of exploration and exploitation of oil and gas fields;
- the technique and automated technology of processing the results of geodetic seismic survey based on the use of GIS and ground laser scanning;
- the "end-to-end" automated technology of coordination and creation of maps of 3D seismic survey locations is justified.
The technology of coordination of geophysical observation points to create maps of their location in 3D seismic exploration and the digital model of the field as a whole is designed to:
- to ensure the exclusion of combining different input and output data formats, especially when exporting the results to the geophysical service for the calculation and construction of output documents required in the processing and interpretation of geophysical measurements;
- to increase the possibility of operational corrections and additions in the subsequent geodetic works, design, computer analysis, geoinformation processing, archiving and storage of data;
- to ensure the economic effect of the data processing process and the formation of output and reporting materials.
The technology of coordination of points of geophysical observations and creation of maps of their location at 3D seismic survey developed by authors is presented in the General technological scheme of processes of formation and creation of output materials of geodetic support of volume seismic survey and digital model of the field as a whole in figure 1.
Figure 1
General technological scheme of processes of formation and creation of output materials
of geodetic support of seismic exploration and digital model of the field as a whole
(Source: author’s development)
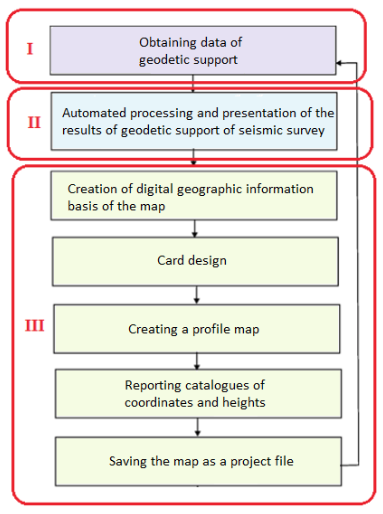
Based on the methodological and technological basis of geoinformation support of the territories of A. P. Karpik (Karpik, 2004), this technology can be explained in terms of the approach of the geodetic information support unit.
I-the reference block of the scheme represents the geodetic and integrated field observations necessary to monitor the state of sustainable development, especially in areas of intense activity or complex seismic-tectonic conditions. The observations covered by the first cluster should be spatiotemporal, monitoring changes in the state of sustainable development. The reference geodetic networks include the development of state geodetic networks – planned, high-altitude, gravimetric, geodetic networks of special purpose and survey justification. Shooting geospatial includes the creation of digital (topographic) models of territories, geodetic support of various engineering works, thematic surveys of various directions (Medvedeva & Budarova, 2015).
The second block includes processing of observation results and presentation of initial information products. Mathematical and primary technological processing of measuring and descriptive information on all components of geodetic and complex field observations are referred to the block of processing of observations and presentation of information. As a result of this processing, the parameters of the Earth, catalogs of planned coordinates, normal and geodetic heights of geospatial points, its initial topographic and thematic representation in analog and digital forms, depending on the methods of obtaining primary information, spatial and temporal characteristics of the parameters of socio-economic, environmental and other conditions, a variety of physical parameters of territories and individual objects.
The third block covers the complex of geodetic information and mathematical modeling, implemented on the basis of geoinformation technologies and designed for the formation and use of geospatial.
Systematic consideration of the block of geodetic information support of sustainable development covers all the processes of further processing of observations, implemented using geoinformation technologies. These include the collection and systematic formation of the original topographic and geodetic and thematic information, the conversion of analog images of territories into digital, modeling of territories, spatial analysis, etc. In fact, almost all of these processes are part of the modeling of geospatial and sustainable development parameters of the territory.
Information modeling of geospatial territories begins in the production of geodetic and thematic surveys, which result in digital models of 2D or 3D.
Other types of information modeling belong to the block of geodetic spatial information support of sustainable development, performed using geoinformation technologies.
New features and tools lead to the development of new technologies geophysical information support:
• creation and maintenance of coordinate-time systems;
• geo-information gathering;
• creation and maintenance of geographic information space;
• geoinformation modeling;
• GIS mapping;
• space-time analysis and design.
The technological scheme provides feedback. Due to this, measurements can be carried out in different time periods, data can be accumulated in the database and characterize the dynamics of changes in the field as a whole, there is a variant of geodetic monitoring, including the use of ground laser scanning.
In order to develop an automated technology for processing the results of geodetic support and the creation of output and reporting materials of seismic exploration, the capabilities of CREDO (Chadovich, Rusak, & Kuzmicheva, 2001): modules CREDO_DAT, CREDO_TER, CREDO_SR and Corel Draw graphical editor. Functioning of the CREDO program modules and Corel Draw graphical editor.
The analysis of this software revealed a number of specific features that affect the performance of the following procedures:
- formation of files with intermediate formats;
- exports in subsequent modules of the program CREDO;
- export them to Corel Draw graphical editor;
An important factor is the financial performance in the selection of one or more specific software products, and as a result – the cost of training.
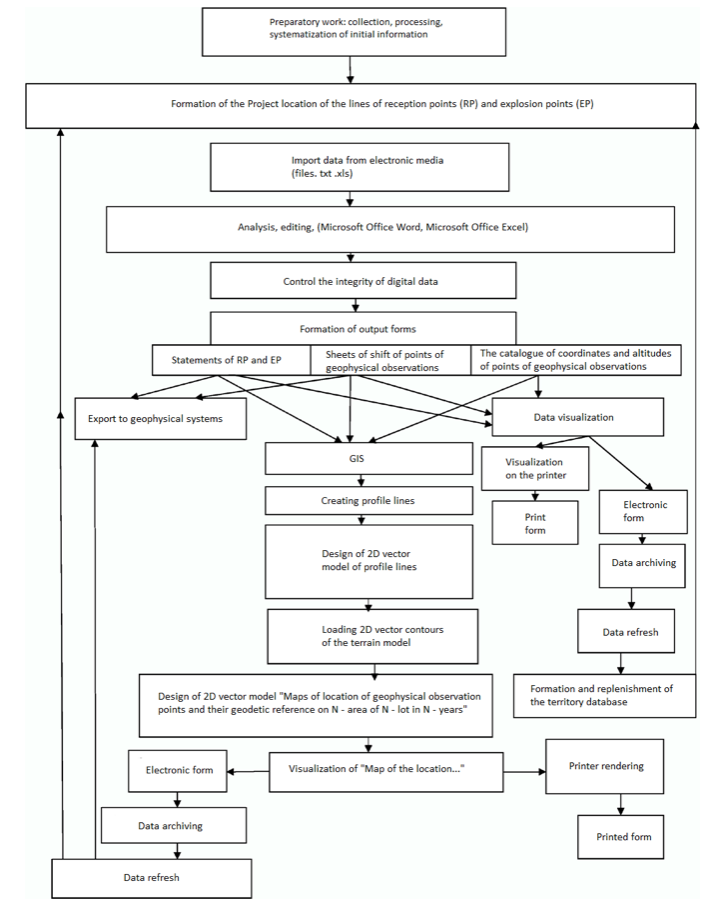
After the transition to a fully automated mode of collecting information from geodetic equipment (electronic total stations and GNSS - equipment) and the appearance on the market of geographic information systems - GIS had the opportunity to use one program instead of the four previously used. At the same time, at the stage of creating profile maps and geophysical observation points, the existing technologies of profile representation of seismic data are used.
It was proposed to integrate profile maps with a general overview map of the territory of possible development of the field. It allowed to realize the technical solution providing an opportunity to carry out transition from one profile to another by means of the query language integrated into GIS environment. Organized in such a way the technological process of creating output materials, including maps of the location of geophysical survey points 3D volumetric seismic, based on the proposed sequence of actions allows to implement end-to-end mode of automated processing of the results of geodetic support areas, using a single software product geographic information system, for example GIS-MapInfo Profesional (Zhuravlev, Kolotov, & Nikolayev, 2006).
The algorithm of this process is presented in figure 2 by the technological scheme of formation of output forms of information according to the data of geodetic support of volumetric 3D seismic survey using GIS.
Figure 2
Technological scheme of formation of output forms according to the geodetic
support of volumetric 3D seismic using GIS (Source: author’s development)
The reporting "Map of locations of geophysical observations and 3D seismic survey profiles ..." is prepared for storage in digital and analog form at a scale of 1:25 000. As a basis for the creation of "Maps..." are digital maps at a scale of 1: 25 000.
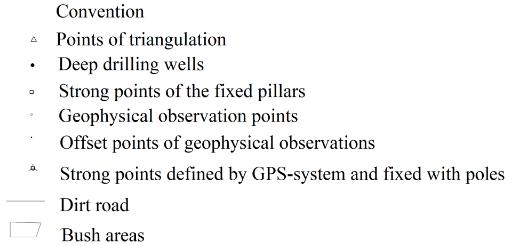
On the "Map..." are applied:
• the points defining the geometry of the profile: - start, end, intersection (crosses), if there is a breaking point of tears, thickening;
• waste profile lines ;
• GGS items;
• GPS points;
• multiples of 200 m ;
• deep drilling wells;
• communications (power lines, roads, oil and gas pipelines);
• human settlement ;
• hydrography;
• 2-kilometer grid (signed mileage);
• corners of sheets of the map of the reporting scale with extensions on a frame (without signatures);
• nomenclature of map sheets in a staggered manner;
• frame angles signatures: ° ' ".
"The Map..." each type of work geodetic reference, the elements of the topographic load and the other of the above points are drawn with symbols in accordance with Annex 1, contained in the "Guide..." (Nedosekin, 2003).
For registration of signatures used font Arial Cyr (11) or Times New Roman Cyr (12).
For visualization (display) of point objects, mainly 2 sets of symbols are used:
- UZgeopunkt
- Mapinfo 3.0 Characters.
For objects of one layer (theme, class) several parameters are set:
• line drawing template;
• area fill pattern;
• the type of icon to bitmap object;
• line colors and fill areas;
• the range of scales at which layer features are displayed[ 3].
For a single Windows package, a single computer font configuration is installed.
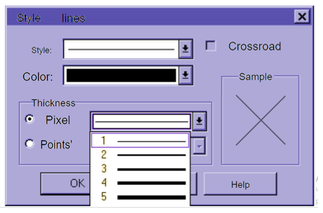
The thickness of the main lines (profile lines, reference stroke, reference lines, and digitizing - rivers and lake contours), as well as a thin inner frame, the removal of the frame and kilometer grid - pixel <1>. For the outer frame and roads the pixel <2> is used, for large rivers shown on maps with one thick line the thickness at points< 1> is used (see figure 3) .
Figure 3
The line style for rendering line features
(Source: author’s)
To build a "Map...", the final files are converted to a common format in which each point has its own name, chainage value, coordinates and height. To create a "Map..." file is prepared "Directory...", presented in table 1.
Table 1
A fragment of the file "Catalog..." to create a "map of the location
of the points of geophysical observations …» (Source: author’s)
02 |
2250 |
ХХХХ157.53 |
УУУУУ136.08 |
kol |
|
02 |
6542-02 |
ХХХХ 160.42 |
УУУУУ 421.25 |
kol |
|
02 |
8385 |
ХХХХ 001.52 |
УУУУУ 253.23 |
kol |
v.t. |
02 |
10919-02 |
ХХХХ 558.60 |
УУУУУ 329.70 |
d.st |
|
02 |
10924 |
ХХХХ 555.61 |
УУУУУ 333.70 |
kol |
v.t. |
02 |
13262-02 |
ХХХХ 313.69 |
УУУУУ 655.65 |
d.st |
|
Separately, layers are created (loaded with a list, with preliminary preparation of the file in Excel or in a text editor, or created manually as symbols) for wells, points of the state geodetic network, communications, GPS points, settlements, according to.
The order of the layers in the set is as follows: hydrography and settlements (as well as all area objects) are located in the lower layers, linear objects – above, the upper layers – point objects.
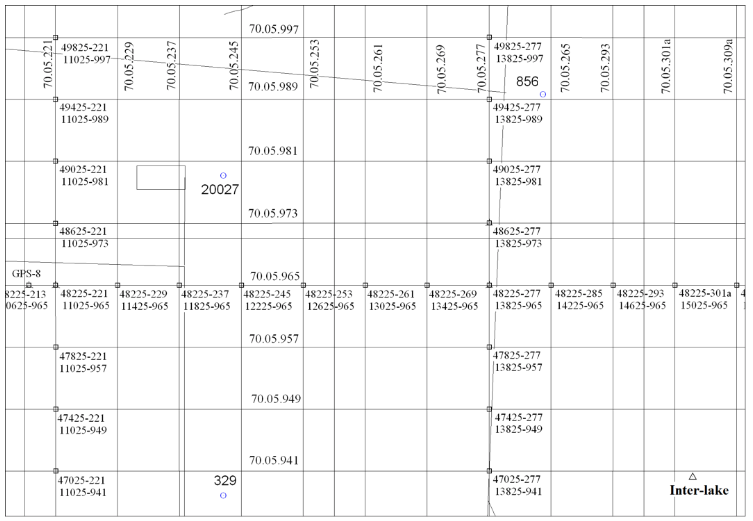
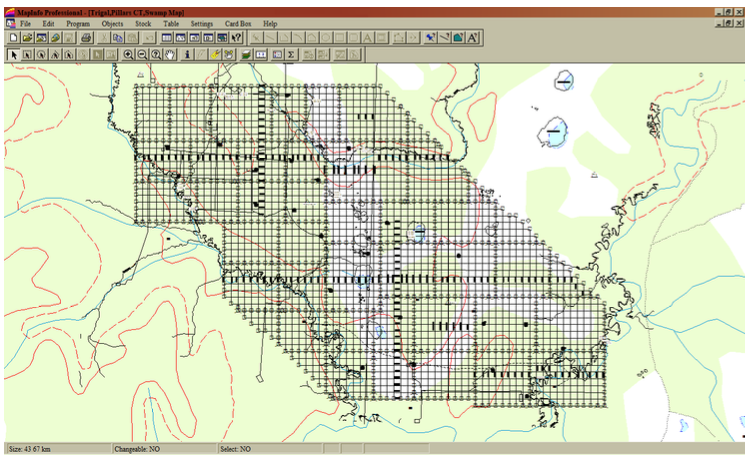
Figures 4 and 5 show a fragment of "Maps of locations of geophysical observations and their geodetic reference..."and the legend to it, obtained by automated data processing of geodetic support of seismic surveys on one of the squares, JSC "GEOTECH" holding talinskaya area of JSC "GEOTECH" holding, made in the GIS (Kalenitsky, Dubrovsky, & Budarova, 2010) (Budarova, 2009).
Figure 4
A fragment of "Map of the location of the points of geophysical
observations …» (Source: author’s development)
------
Figure 5
Legend to the "Map of the location of the points of geophysical
observations …» (Source: author’s development)
The creation, representation and storage "schemes of location of project profiles and points of geophysical observations ...", "location Maps of points of geophysical observations ..." and "Statements of coordinates and heights of points of geophysical observations along the lines of the explosion and" "Statements of coordinates and heights of the shift points of geophysical observations, Statements of coordinates and heights of deep wells" in a digital form allows rapid corrections and additions in subsequent surveying work, i.e. and also provides initial information processing of geodetic measurements and export data to various information systems.
The presented technology of output forms formation and 3D seismic survey maps creation is adapted and implemented in production using various software products. At the same time, the user, based on specific needs and design tasks, can regulate the sequence of actions, providing a resource-saving mode of technological processes, and perform work on the software that is used in the enterprise.
Thus, it became possible to reduce the financial costs of purchasing licensed software, as well as the costs associated with the training and retraining of employees of the organization.
In the course of research the authors have integrated maps of the location of profiles and points of geophysical observations with a General overview map of deposits and a map of the territory of the Khanty-Mansiysk Autonomous Okrug (KHMAO-Yugra) of the Tyumen region.
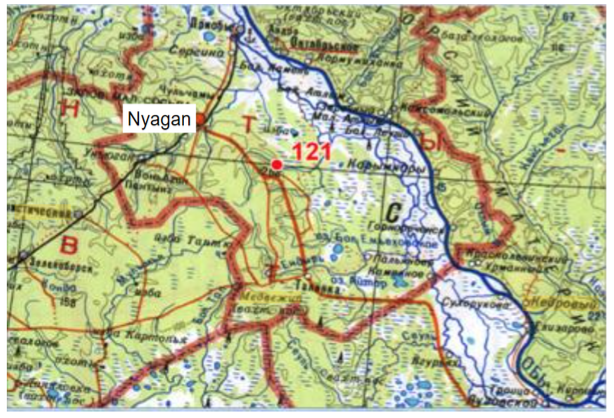
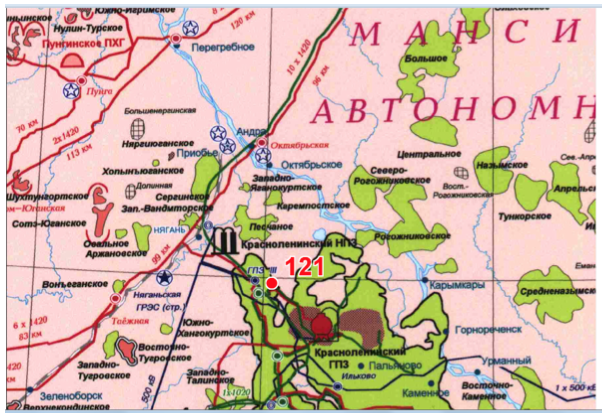
Figure 6 shows an example of a profile map of one of the 3D areas of the oil and gas holding talinskaya 3D area of JSC "GEOTECH" holding, integrated with fragments of the map of the territory of the Khanty-Mansiysk Autonomous Okrug of the Tyumen region, formed in GIS MapInfo. Figures 7 and 8 show the prospecting well No. 121 integrated with the General overview map of the territory of the Khanty-Mansiysk Autonomous Okrug (KHMAO-Yugra) of the Tyumen region and the General overview map of the territory of the possible development of the field, the location of which is determined by the results of 3D seismic survey data on one of the 3D areas of the oil and gas holding talinskaya square of JSC "GEOTECH" holding.
Figure 6
GIS with an example of a map of the location of profiles of one of the 3D areas of the
oil and gas holding talinskaya 3D area of JSC "GEOTECH" holding - on a fragment of t
he territory of the Khanty-Mansi Autonomous district (KHMAO-Yugra) of the Tyumen region
(Source: author’s development in GIS MapInfo Professional)
-----
Figure 7
. Search well No. 121 integrated with the General overview map of the territory of
Khanty-Mansiysk Autonomous Okrug (KHMAO-Yugra) of the Tyumen region
(Source: author’s development)
-----
Figure 8
Prospecting well No. 121 - on the General overview map of the territory
of possible development of the field (Source: author’s development)
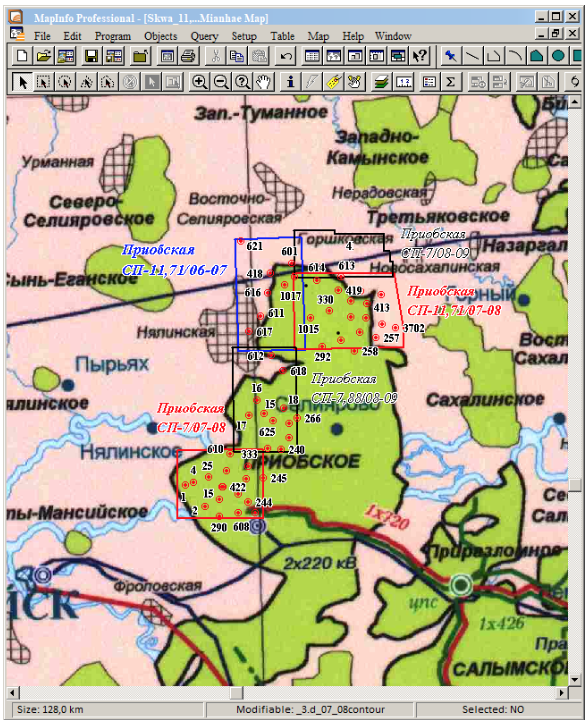
Also, an example of such integration of maps of locations of geophysical observations of seismic surveys carried out in different time periods, several - 7,11,71,88 - seismic lots with the location of prospecting and exploration wells on the Priobskaya area of JSC "GEOTECH" holding is shown in figure 9. At the same time the technical solution of transition from one profile to another by means of the query language integrated into GIS environment is developed.
Figure 9
A fragment of mestorozhdeniya c example of the integration of maps of the location
of the points of geophysical observations seismic surveys made in different time periods
(Source: author’s development in GIS MapInfo Professional)
The main results achieved can be determined by accuracy assessing of the planned height reference of the base station (table 2).
Table 2
Accuracy assessment of the planned height reference
of the base station (Source: author’s development)
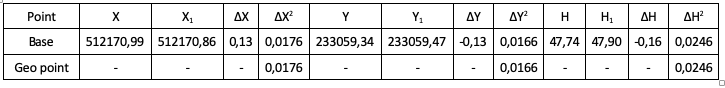
The error of the measurements was to coordinate ±0,185 meters, height ±0.157 meters. These measurement errors are within the normal range.
The technology of coordination of points of geophysical observations and creation of maps of their location at volume seismic prospecting in territories of oil and gas fields of Western Siberia at search, investigation and operation of fields of hydrocarbons allows:
- to ensure the exclusion of combining different input and output data formats, especially when exporting the results of geophysical services for the calculation and construction of output documents required in the processing and interpretation of geophysical measurements;
- to increase the possibility of operational corrections and additions in the subsequent geodetic works, design, computer analysis, geographic information processing, archiving, data storage and, if necessary, their transmission via the Internet;
- ensure the economic effect of the data processing process and the formation of output and reporting materials at least 10 % without loss of quality and accuracy;
- conduct geodetic and geophysical monitoring of territories and deposits.
The results of the study can be used for other oil and gas fields, as the presented technology is designed for the needs of geodetic works during geophysical surveys.
The main advantages of the methodology and technology presented in the study are:
1. Reducing the time spent on the creation of digital maps of geodetic support of seismic exploration in the search, exploration and operation of hydrocarbon deposits and for corrections and additions in the subsequent geodetic works, design, computer analysis, geoinformation processing;
2. Reducing the complexity and material intensity of the technological process of creating reporting materials for geodetic support of seismic exploration in the search, exploration and operation of hydrocarbon fields in Western Siberia;
3. Reduction of financial costs for the purchase of a specific software product and training of specialists.
Technology of coordination of points of geophysical observations, creating maps of their location in 3D seismic based on the use of geographic information systems allows:
- implement "end-to-end" automated technological process of coordination and creation of maps of 3D seismic survey locations, excluding the combination of different input and output data formats required in the processing and interpretation of geodetic and geophysical measurements;
- to increase the possibility of operational corrections and additions in the subsequent geodetic works, design, computer analysis, geoinformation processing, archiving and storage of data;
- to increase the productivity of work with ensuring the economic effect of the data processing process;
- regulate financial costs when choosing software products;
- reduce the cost of training specialists;
- to cover to the greatest extent all current trends in the seismic industry.
Budarova, V. A. (2009). Experience of 3d exploration-seismology maps making using gis-technologies. Proceedings of GEO-Siberia-2009: International Scientific Conference. 1, pp. 41-44. Novosibirsk: SGGA.
Chadovich, D. V., Rusak, V. M., Kuzmicheva, E. V. (2001). CREDO. CREDO_DAT 3.0. Practical guide to the use of complex CREDO. Minsk: NGO "Credo-Dialogue".
Cordsen, A., Galbraith, M., & Peirce, J. (2000). Planning Land 3-D Seismic Surveys. (B. A. Hardage, Ed.) Tulsa: SEG.
Dubrovsky, A. V., & Malygina, O. I. (2015). Topographic monitoring on oil-and-gas fields. Proceedings of Interjekspo Geo-Siberia-2015: International Scientific Conference. 2, pp. 226-233. Novosibirsk: SGUGiT.
Guidelines for the use of spatial seismic 3D at different stages of exploration for oil and gas. (2000). Mockow: Central geofiz. expedition.
Kalenitsky, A. I., Dubrovsky, A. V., & Budarova, V. A. (2010). Technology of processing of results of geodetic support of 3d seismic survey in the territories of oil and gas fields. Bulletin of Siberian state University of geosystems and technologies 2010 (1(12)), 21-27.
Karpik, A. P. (2004). Methodological and technological bases of geoinformation support of territories: monograph. Novosibirsk: SSGA.
Kustysheva, I. N., Skipin, L. N., Petukhova, V. S., Dubrovsky, A. V., & Malygina, O. I. (2018). Actual problems of land monitoring in the Russian Federation. Volume 39 (Number 16), page 35. Retrieved from: https://revistaespacios.com/a18v39n16/18391635.html
Medvedeva, Y. D., & Budarova, V. A. (2015). The use of geoportals for natural resource accounting. Proceedings of In the collection: Actual problems of architecture, construction, ecology and energy saving in the conditions of Western Siberia the Collection of materials of the international scientific-practical conference : in 2 volumes (pp. 254-259.). Tyumen: Tyumen state University of architecture and civil engineering.
Nedosekin, A. N. (2003). Guide to topographic and geodetic support of geological exploration: approved by JSC "Khantymansyskgeofizika" 04.04.2003. 74. Khanty-Mansiysk.
Oil book: the term «3D seismic exploration». (n.d.). Retrieved 06 02, 2019, from Oil book: http://kniganefti.ru/word.asp?word=286
Zhuravlev, V. I., Kolotov, A. Y., & Nikolaev, V. A. (2006). Maplnfo Professional version 9.5 user manual. Russian translation. Moscow: LLC " ESTI MAP”.
1. PhD in Engineering sciences, Tyumen Industrial University, 625000, Russia, Tyumen, 38, Volodarskogo St.. e-mail: natali.cherdanceva@mail.ru
2. PhD in Engineering sciences, Tyumen Industrial University, 625000, Russia, Tyumen, 38, Volodarskogo St.. e-mail: budarova@bk.ru
3. PhD student, Tyumen Industrial University, 625000, Russia, Tyumen, 38, Volodarskogo St. e-mail: artemshere93@gmail.com
4. PhD in Engineering sciences, Siberia State University of geosystems and technologies, 630108, Russia Novosibirsk, 10, Plakhotnogo St., e-mail: avd5@mail.ru
5. PhD in Engineering sciences, Siberia State University of geosystems and technologies, 630108, Russia Novosibirsk, 10, Plakhotnogo St., e-mail: 131379@mail.ru
6. PhD in Engineering sciences, Siberia State University of geosystems and technologies, 630108, Russia Novosibirsk, 10, Plakhotnogo St., e-mail: v.b.jarnikov@ssga.ru
7. Grand PhD in (Biology) sciences, PhD in Geographic sciences, Tyumen Industrial University, 625000, Russia, Tyumen, 38, Volodarskogo St.. e-mail: telitsynvl@tyuiu.ru