![]() ISSN 0798 1015
ISSN 0798 1015

![]() ISSN 0798 1015
ISSN 0798 1015
Vol. 40 (Number 35) Year 2019. Page 1
CABRALES, Sergio 1; MONCAYO, María 2 & ROMERO, Cesar 3
Received: 26/02/2019 • Approved: 02/10/2019 • Published 14/10/2019
ABSTRACT: This paper presents new evidence regarding the determinants of privatizing National Oil Companies (NOC) from a panel data of 49 oil-producing countries for the period 1996 to 2014. We find—ceteris paribus—that countries with greater corruption control, a more positive perception of government effectiveness, a more participatory political system, greater regulatory quality, and high efficiency in the execution of contracts and property rights, are more likely to privatize their NOCs compared with countries with lower levels in these governance indicators. |
RESUMEN: Este articulo presenta nuevas evidencias sobre los determinantes de la privatización de las Compañías Estatales de Petróleo de un panel de 49 países productores de petróleo para el período comprendido entre 1996 y 2014. Encontramos, ceteris paribus, que los países con mayor control de la corrupción, una percepción más positiva de la efectividad del gobierno, un sistema político más participativo, una mayor calidad regulatoria y una alta eficiencia en la ejecución de los contratos y los derechos de propiedad, tienen más probabilidades de privatizar sus compañías petroleras comparado con los países con niveles más bajos en estos indicadores de gobernanza. |

National Oil Companies (NOCs) [4] control 73% of world’s oil reserves and 65% of gas reserves, with the remainder controlled by International Oil Companies (IOCs) (Victor et al., 2011). This exposes a paradox regarding the ownership structure of oil and gas companies, since different studies have shown that, historically, NOCs are dramatically less economically efficient than the IOCs (e.g. Eller et al., 2007; Victor, 2007; and Wolf, 2009). Therefore, the inefficiency posed by NOCs suggests that privatization might be a better economic solution.
There has been an ongoing debate in the literature as to whether NOCs should be privatized or not (Goodman and Lovemen, 1990). It has been argued that the best economic performance in terms of efficiency as shown by an increase in revenue and global production, has been after a NOC becomes an IOC, even if only partially (Wolf and Pollitt, 2008). However, Vickers and Yarrow (1988) suggest that a decision regarding a NOC’s ownership structure may be influenced by government incentives and constraints. Hence, decisions regarding retention of state companies may be more closely related to government objectives than purely commercial objectives (Cabrales et al., 2017). Government objectives may include employment creation, income redistribution through subsidized prices, and the maximization of backward and forward linkages, in order to develop national oil industries (Fattouh and El-Katiri, 2012; Warshaw, 2012).
The issue of privatization has been previously explored by various authors (e.g. Clarkson et al., 1989; Clarkson, Hanke, and Thompson, 1989; Bienen and Waterbury, 1989) showing the superior efficiency of the private sector in managing resources and austerity in terms of costs. A limited amount of literature has focused on the study of privatization determinants in different industries and, ultimately, even less has covered the types of oil company ownership. Concerning the determinants of property types in the oil industry, the literature is very limited. Goodman and Lovemen (1990) arguing for nationalization and Warshaw (2012) arguing for a unified framework of nationalization and privatization are the most outstanding cases. These studies have found that when oil prices are high, the probability of nationalizing an oil company increases, while the probabilities of privatizing an oil company increase only when oil prices are low. In addition, both consider it relevant to include a variable that captures the shock of oil price (Pindyck, 1999), as shown in Annex A. Other variables, such as the level of production, the possibility of the diffusion of privatization and/or nationalization of oil companies, and the logarithm of the population of each country, were incorporated in such studies. The authors conclude that due to the economies of scale that manage this sector, countries with a high level of production can reduce the costs of expropriation, increasing the likelihood of nationalization. Finally, at a socio-political level, these studies conclude that democratic governments with strong systems of Checks and Balances are more likely to privatize their NOCs, while autocratic countries with weak systems tend to nationalize their oil companies.
Along the same lines, we expand upon the socio-political dimensions by deepening governance indicators that can affect the privatization of oil companies. Guriev et al. (2011) and Warshaw (2012) use the Executive Constraints and Polity 2 of the Polity IV data base indicators, which refer to the control executed by other powers over the Executive and the comprehensive democratic development, respectively. While these indicators involve two important governance issues, that is, the autonomy of the government and the level of democracy in countries, these analyses leave aside specific issues, such as the perceptions of agents on services and public policies, civil service, contract enforcement, property rights, the likelihood of crime and violence, and the inclusion of elites and private interests in power, among others, which are not explicit in their analysis.
Similarly, a higher level of detail is required to analyze the privatization behaviors in the oil industry, as it is according to World Bank indicators that the relative difference between countries can be measured. Such differences go beyond the political regime, as discussed in previous studies (e.g. Guriev et al., 2011; Ross, 2012; Warshaw, 2012). Thus, to achieve the core objective of this paper, a nonlinear probability model will be performed for a panel of data consisting of 49 oil producing countries during the time frame of 1996 to 2014. The main variables to be analyzed will relate to the following governance indicators: Voice and Accountability, Political Stability, Government Effectiveness, Regulatory Quality, Rule of Law, and Control of Corruption.
Therefore, the core objective of this paper is to identify which governance factors determine the decision to privatize NOCs. While previous studies have addressed research on the determinants that affect the type of ownership of companies in different industries, there are few studies that have focused on the oil industry (Guriev et al., 2011; Warshaw, 2012). The latest study on this issue, conducted by Warshaw, concludes that the most democratic regimes tend to have a greater number of privatizations than expropriations; however, he leaves the question open regarding which specific factors make this happen (Warshaw, 2012). Accordingly, the present paper aims to expand upon the socio-political dimensions that can affect the privatization of NOC. Consequently, the inclusion in this study of the six dimensions of the World Bank Governance Indicators allows one to understand which specific factors of governance influence the ownership structure of the oil companies, and to which extent, in both individual and aggregate ways.
This paper is organized as follows: the second section describes the methodology implemented and data used to measure the effects exerted by the socio-economic factors and the governance indicators on the probability of privatization of State oil companies; the third section shows the results obtained and the marginal effects found for each of the variables analyzed; and finally, the sixth section explains the findings and limitations presented.
In order to answer the research question, this study will follow an empirical approach constructed of a nonlinear probability model Logit, where the variable of interest will take the value of if the government´s shareholding percentage in the NOC decreases during the year , or if the shareholding percentage increases (Wolf & Pollitt, 2008).
where is a dummy variable that represent if the government´s participation in the NOC decreases during the year , and refers to the vector of observations of the country during the corresponding year , both made to the control variables set as well as to the explanatory variables set. While represents the vector of the coefficients associated with each type of variable previously mentioned, and corresponds to the model error.
Given that the structure of the data needed for this study corresponds to the same unit of the cross-sectional analysis (oil-producing countries) at different times, it is said to have a panel structure data. So, the type of effects to be considered in this study must be identified. On one side, there are the fixed effects, which assume that the error, , can be decomposed into a fixed and constant part for each individual, , and into a random part, , which meets the assumptions of the Ordinary Least Squares (OLS) Method; on the other hand, there are the random effects which have the same specification of the fixed effects model, except that such is a random variable with a mean value and a (Montero and Granados, 2011).
Therefore, the test that allows to identify the kind of effects that must be estimated in a panel data model is the Hausman Test. The null hypothesis of this test is that there are no systematic differences between the estimators of the fixed effects and the random effects. Thus, if the null hypothesis is rejected, there would be endogeneity in the model, so it is preferred to use a model with fixed effects. On the contrary, if the null hypothesis is accepted, it means that there is no correlation between the error and the repressors, , so it is preferred to choose a model with random effects (Wooldridge, 2001).
The sample used in this study consists of a panel data based on 49 oil-producing countries reported by the BP Statistical Review 2016, with a time frame between 1996 and 2014 [5]. The reasons behind only producing countries are being studied lie in the fact that these are more likely to have a NOC for the oil operation and - in most of the cases - these countries derive the highest revenue from oil, implying a greater reliance of the country towards the industry (Warshaw, 2012). As a result, the information reported by these countries will allow to perform a specialized analysis of the sector, avoiding distortions in the results.
As it was mentioned, the dependent variable will take the value of if the government shareholding of the country in its NOC decreases during the year , or 0 otherwise.
The information for partial privatization was mainly taken based on the research of Wolf and Pollitt (2008) and related media reports. Based on these, 25 privatizations were recorded in 12 different countries during the observed period. The detail of the countries with the dates of each event is shown below:
Table 1
Events of Privatization by country.
Country |
Year |
Argentina |
1999 |
Brazil |
2000, 2001 |
Canada |
2005 |
China |
1999, 2000, 2001, 2006, 2007 |
Colombia |
2007 |
UK |
1996 |
India |
1999, 2004 |
Italy |
1996, 1997, 1998, 2001 |
Norway |
2001, 2004, 2005 |
Romania |
2004 |
Russian Federation |
1999, 2006 |
Thailand |
1998, 2001 |
Data source: Wolf and Pollitt (2008) and related media reports
According to what was identified and explained in the literature review, three groups of relevant variables were identified:
![]()
It should be noted that the direction of the variable effect is not defined with certainty, because it depends on the types of random events which are included in this variable and that can affect positively or negatively the crude oil price. For more details of the estimates of this model it is recommended to check Annex A.
Table 2
Explanatory variables - Control
Variable |
Description |
Expected |
Source |
Sign |
|||
Oil Price |
At constant prices of 2015 |
(-) |
BP Statistical Review |
Shock |
Random effect. Residual econometric model |
(?) |
Authors |
Oil Production |
Ln(Production) |
(+) |
BP Statistical Review |
Diffusion of privatization between |
Number of privatizations in other countries |
(+) |
Authors |
Table 3
Explanatory variables - Socio-Economic
Variable |
Description |
Expected |
Source |
Sign |
|||
Population |
Log(population) |
(+) |
World Bank |
GDP per capita |
GDP per capita at constant 2011 prices, adjusted for Parity of Acquisitive Power |
(+) |
World Bank |
GDP Growth % |
Percentage variation of the GDP between and |
(-) |
World Bank |
Market Capitalization |
Market Capitalization / GDP |
(+) |
World Bank |
Government Debt |
External Debt / GDP |
(+) |
World Bank |
The Tables 2, 3 and 4 present a summary of the analyzed variables with the proper description, source, and expected sign. Similarly, Annexes B and C show the main descriptive statistics related to each variable.
Table 4
Explanatory variables - Socio-Political
Variable |
Description |
Expected |
Source |
Sign |
|||
Corruption Control |
Approximate range between . The higher the value of the indicator, the greater the control of corruption. |
(+) |
World Bank |
Voice and Accountability |
Approximate range between. A higher value of the indicator shows increased participation of citizens. |
(+) |
World Bank |
Political Stability and lack of lack of violence measures |
Approximate range between. A higher value of the indicator means a higher political stability and absence of violence. |
(+) |
World Bank |
Government effectiveness |
Approximate range between. A higher value of the indicator means a greater perception of effectiveness of the government. |
(+) |
World Bank |
Regulatory Quality |
Approximate range between . A higher value of the indicator means a greater perceived regulatory quality. |
(+) |
World Bank |
Rule of law |
Approximate range between . A higher value of the indicator means a greater the perception of compliance and trust in compliance to the social rules. |
(+) |
World Bank |
The correlation coefficients of Pearson, among the explanatory variables, are presented to identify redundant information and avoid potential multicollinearity problems that could result when estimating models:
Table 5
Correlation Matrix
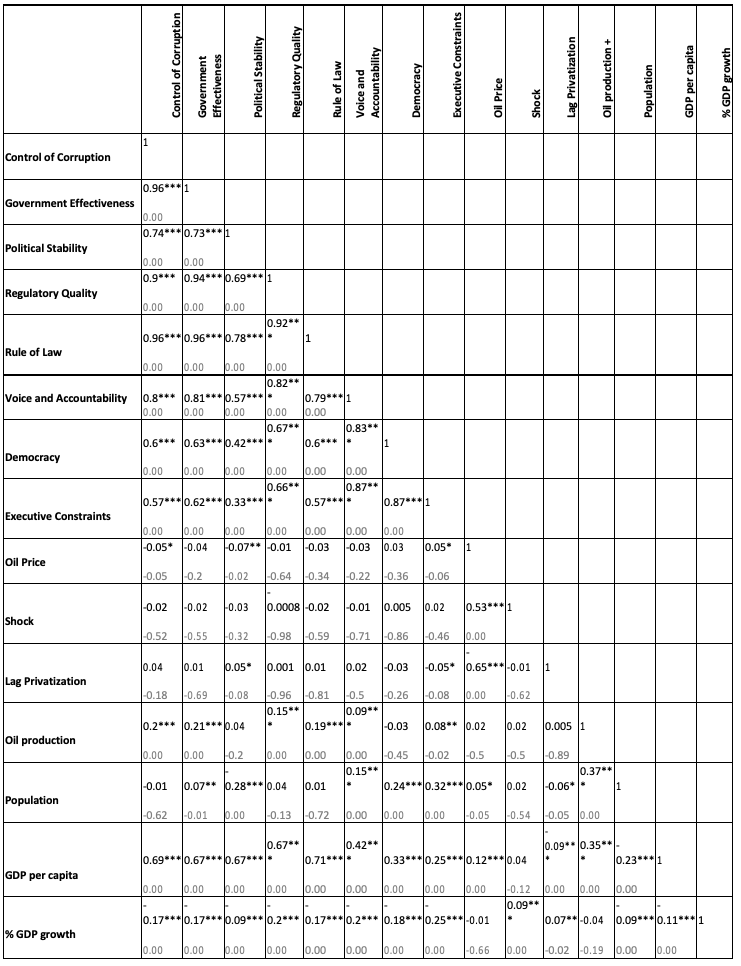
P-value at the bottom (*** p<0.01, ** p<0.05, * p<0.1)
As shown in the Table 5, Oil Production, % GDP Growth, and GDP per capita are correlated with governance indicators, being coefficients statistically significant at the level. However, for the first two variables these values are less than , and even for certain indicators this correlation is less than , suggesting that there is an association but no redundancy of information between these variables.
The opposite case occurs for the GDP per capita, as the magnitude of the correlation coefficients with governance indicators is above . This implies that these variables cannot be incorporated simultaneously when performing a regression, since inconsistent estimators would be generated due to the redundant information presented between them. The same is applicable for Oil Price and Diffusion of privatizations between countries variables, which have an inverse and significant correlation that can be explained by the lower trend to privatize at high regimes in oil prices, as it was specified in the description of variables.
Table 5 shows two additional variables to the ones mentioned in the previous section: Democracy and Executive Constraints. These variables refer to the index analyzed by previous studies (e.g. Guriev et al., 2009; Warshaw, 2012) in order to represent the political regime and the scope of institutional constraints on the decision-making of chief executives, respectively (Marshall and Jaggers, 2007). In this regard, it is worth noting that the governance indicators analyzed in this study have a strong and statistically significant relationship with these variables, more specifically, with the indicator Voice and Accountability, which measures the perceptions of participation and freedom of citizens. However, as it can be observed in the correlation matrix, indicators such as Control and Corruption, Political Stability and Rule of Law, have a lower magnitude in their correlation coefficients, indicating that there is information that the political regime and the institutional constraints cannot explain for themselves. Thus, the need to include other indicators to measure the relative differences between countries when analyzing the probability of privatization of oil companies is ratified.
After analyzing the 6 Governance Indicators, it is possible to see that they correlate among themselves with coefficients greater than . This prevents the inclusion of all these variables when performing the probability nonlinear model, due to the presence of possible multicollinearity issues. However, considering that these indicators are the explanatory variables studied in this work, and that regardless of the problem of correlation each of them provides different information when analyzing the socio-political dimension, it was decided to solve the problem described generating a Governance Index.
The method used to generate the governance index is called Principal Component Analysis (PCA), which is commonly used as a technique of dimension reduction (James et al., 2014). This method consists in finding linear combinations between variables known as principal components (PCs) that capture the greatest variance in the data. Thus, the first component will be defined as the linear combination that accumulates the highest variability regarding all possible linear combinations of other variables; and the following PCs are those that capture the remaining variability of the data and are orthogonal to the previous PCs (Kuhn and Johnson, 2013).
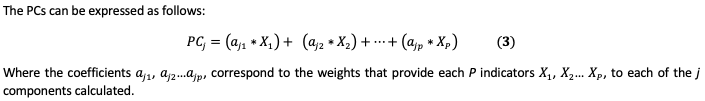
Using the statistical program R, the main components for the 6 Governance Indicators were generated, with the following results:
Table 6
Weights Matrix
|
PC1 |
PC2 |
PC3 |
PC4 |
PC5 |
PC6 |
Standard Deviation |
2.248 |
0.730 |
0.464 |
0.340 |
0.214 |
0.200 |
Variance Ratio |
0.842 |
0.089 |
0.036 |
0.019 |
0.008 |
0.007 |
Accumulated Ratio |
0.842 |
0.931 |
0.966 |
0.986 |
0.993 |
1.000 |
-----
Table 7
Proportion of Variance in each Component
|
PC1 |
PC2 |
PC3 |
PC4 |
PC5 |
PC6 |
Corruption Control () |
0.4294 |
-0.0052 |
0.3005 |
-0.5146 |
0.0426 |
-0.6772 |
Government Effectiveness () |
0.4329 |
-0.0476 |
0.3053 |
0.0039 |
-0.7669 |
0.3591 |
Political Stability () |
0.3474 |
0.8010 |
-0.4705 |
0.0853 |
-0.0704 |
-0.0640 |
Regulatory Quality () |
0.4213 |
-0.1830 |
0.1545 |
0.8110 |
0.1897 |
-0.2671 |
Rule of Law () |
0.4333 |
0.0781 |
0.2461 |
-0.2060 |
0.6074 |
0.5781 |
Voice and Accountability () |
0.3771 |
-0.5626 |
-0.7146 |
-0.1665 |
-0.0132 |
0.0520 |
Consequently, all the data variability can be achieved with the 6 main components. However, the first component includes a large portion of the data variance (), so it can be concluded that this component is suitable to generate the index governance. Thus, based on the Weight Matrix presented in Table 7, it was established that the index would be represented by the following equation:
Looking at the weighting of the governance index proposed, we can see that the weights do not differ much from each other. However, the greatest contributions were made by the following indicators: Rule of Law, Government Effectiveness and Corruption Control. This means that differences between countries are further concentrated on the quality of contract enforcement, property rights, government credibility in the formulation and implementation of policies, and finally in the levels of corruption perceived by society in their institutions.
In order to find the most robust model to explain the probability of privatizing state owned oil companies and avoid the correlation problems, different specifications were tested in each regression. However, only the Oil Price, Shock, and Population control variables were found to be significant, as shown in Table 8.
Table 8
Logit Model with Random Effects
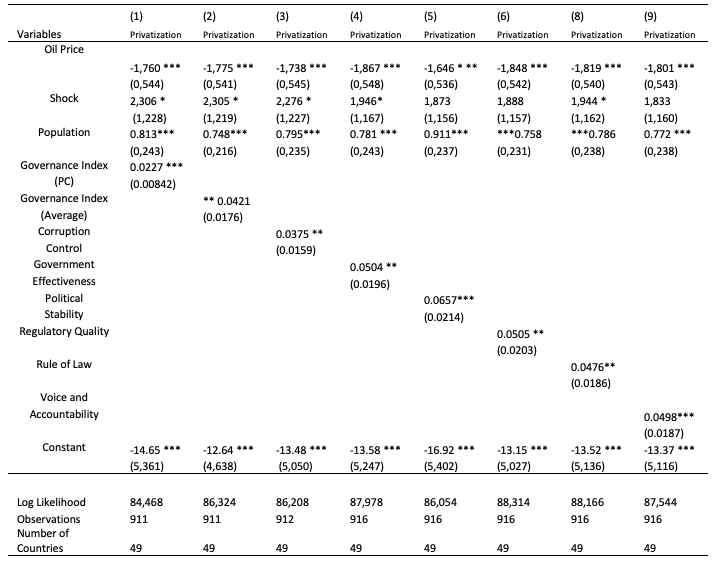
Standard errors in parentheses (*** p <0.01, ** p <0.05, * p <0.1)
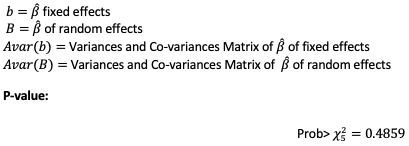
The panel data implementation with random effects was determined, since a statistic test equivalent to and a p-value greater than the significance level of were obtained when the Hausman test was executed. Consequently, statistically there is no correlation between the regressors and the error, so choosing random effects allows to obtain consistent and efficient estimators. Similarly, a more intuitive justification for this choice is that the information of the governance indicators changes very slowly over time, so a hypothesis of fixed effects in a specific country would cause a loss in the degrees of freedom, affecting the estimate of the effects of these variables (Bortolotti et al., 2001).
Table 8 presents 8 models which intend to test the significance of the governance indicators within the probability of privatization of oil companies. On the one hand, models 1 and 2 analyze the control variables and the governance index, while, on the other hand, the models from 3 to 8 study each of the six indicators separately. It is noteworthy to see that the difference between model 1 and 2 lies in the method of calculating the governance index. The first was calculated from the major components, while the second was taken as a simple average of the 6 indicators.
In terms of the direction of the coefficients, it can be concluded that in all models the included variables produce the expected effect. Likewise, regarding magnitude, the variable that influences the most the privatization in each model is the random shock in oil prices, although it is important to mention that not all specifications turn out to be significant.
Instead, it can be concluded that all governance indicators are indeed significant in explaining the probability of privatization of oil companies. Therefore, the relative differences in the countries in terms of regulation of institutions, political regime, political stability, control of corruption, and government effectiveness did influence the decision of a State to reduce its participation in the companies of this industry.
When comparing models, it must be noted that the Political Stability and Absence of Terrorism is the indicator with the highest coefficient in contrast to the other five indicators, and, in turn, this is the model with the largest log likelihood. This suggests that by its own, it could be the indicator of governance that better explains the probability of privatization of oil companies. It is noteworthy that this comparison does not apply to the magnitude of the governance index by the main components, as this only covers 84.2% of the variability of the data, and it is calculated from a percentage of each indicator, so the magnitude of the effect may be less strong.
Finally, based on the results, it was proceeded to calculate the marginal effects of each variable for the model with the governance index proposed by this study, obtaining the results shown in Table 9.
Table 9
Marginal Effects
Variable |
Marginal Effect |
Oil Price |
-0.03042 ** (0.012) |
Shock |
0.039865 * (0.024) |
Population |
0.014058 ** (0.006) |
Governance Index |
0.000392 ** (0.0001) |
Standard errors in parentheses (*** p <0.01, ** p <0.05, * p <0.1)
Thus, it can be concluded that with an increase of one dollar (USD) in oil prices, the probability of privatizing an NOC in a producing country would decrease by about 3.04 percentage points. Also, a unit increase in the deviation of the price trend causes an increase of 3.9 percentage points in the probability of privatization. Regarding the population, an increase of one point in the logarithm of the number of inhabitants causes the analyzed probability to grow by 1.4 percentage points. Finally, an increase in one point in the governance index leads to an increase of 0.03 percentage points in the probability that a State would decrease its participation in companies of the oil industry.
While different performance methodologies have proven an increase in technical efficiency of oil companies after a privatization event, many countries still continue to have a state oil company thanks to various social and political aspects that encourage this ownership structure. Thus, this study seeks to provide statistical evidence to identify the socio-political factors, especially on the governance indicators that influence how an oil producing State decides to reduce its stake in a state-owned oil company.
After analyzing a panel data from 49 countries in the period between 1996 and 2014, it can be concluded that the socio-political dimension is significant in explaining the privatization of the oil companies. Hence, ceteris paribus countries with greater control of corruption, a high perception of government effectiveness, a more participatory political system, a greater regulatory quality, and a high efficiency of the contracts enforcement and property rights, are more likely to privatize oil companies, compared to those countries that have a lower level in these indicators.
The above variables were statistically significant. However, due to the presence of a high correlation among them, these cannot be studied simultaneously. Consequently, this paper proposes a governance index calculated from the Principal Components method, in order to obtain an overall score on the socio-political dimension that each of the countries analyzed present.
One limitation of this study is the small number of privatization events occurred during the analyzed time frame (1996-2014). This, due to the availability of information of the governance indicators, which restricted us to this specific period. However, it is considered that this analysis has sufficient statistical evidence to conclude that the governance factors impacts directly on the type of ownership structure that the States decide to choose for their oil companies.
Finally, it is important to note that this study has positive character, not normative, so its purpose only lies in enriching the literature related to the privatization of oil companies, and does not intended to bias the reader for or against any type of ownership structure which was analyzed by this article.
In the end, there are socio-political considerations that must be pondered by governments when deciding whether to privatize their NOCs. If the decision is privatizing, governments must be aware of the different modifications and enchancements to the set of variables – corruption control, government effectiveness, participatory political system, regulatory quality, efficiency of contracts enforcement, and respect of property rights – that will impact the privatization decision and the successfulness of the process.
Agnew, D., Pearce , J., Pramod, G., Peatman, T., Watson , R., Beddington, J., Pitcher, T. (2009). Estimating the Worldwide Extent of Illegal Fishing. PLoS ONE.
Al-Obaidan, A., & Scully, G. (1992). Effiency differences between private and state-owned enterprises in the international petroleum industry. Applied Economics.
Bienen, H., & Waterbury, J. (2002). The political economy of privatization in developing countries. World Development.
Bortolotti, B., Fantini, M., & Siniscalco, D. (2001). Privatisation around the World: An Evidence from Panel Data. Journal of Public Economic.
Breen, M., & Doyle, D. (2013). The Determinants of Privatization: a Comparative Analyses of Developing Countries. Journal of Comparative Policy Analysis.
Cabrales, S., Bautista, R., & Benavides, J. (2017). A model to assess the impact of employment policy and subsidized domestic fuel prices on national oil companies. Energy Economics, 68, 566-578.
Clarkson , K., Hanke, S., & Thompson. (1989). Privatization at the State and Local Level. En P. Macavoy, W. Stanbury, G. Yarrow, & R. Zeckhauser, Privatization and State-Owned Enterprises. Springer Netherlands.
Eller, S. L., P. Hartley and K. B. I. Medlock (2007). Empirical Evidence on the Operational Efficiency of National Oil Companies. Houston, The James A. Baker III Institute For Public Policy, Rice University.
Fattouh, B., & El-Katiri, L. (2012). Energy and Arab Economic Development. United Nations Development Programme. Regional Bureau for Arab States. Arab Human Development Report. Research Paper Series.
Goodman, J., & Loveman, G. (1991). Does Privatization Serve the Public Interest. Harvard Business Review.
Guriev, S., Kolotilin, A., & Sonin, K. (2009). Determinants of Expropiation in the Oil Sector: A Theory and Evidence from Panel Data. Journal of Law Economics and Organization.
James, G., Witten, D., Hastie, T., & Tibshirani, R. (2014). An Introduction to Statistical Learning. New York: Springer.
Kaufmann, D., & Kraay, A. (2016). Worldwide Governance Indicators. Obtenido de Banco Mundial: http://info.worldbank.org/governance/wgi/index.aspx#home. Accessed 2017.12.06.
Kuhn, M., & Johnson, K. (2013). Applied Predicte Modeling. New York: Springer.
Marshall, M., & Jaggers, K. (2007). Polity IV Project. Obtenido de Center for Systemic Peace: http://home.bi.no/a0110709/PolityIV_manual.pdf. Accessed 2018.06.06.
Mizutani, F., & Uranishi, S. (2010). Determinants of privatization of public corporations: evidence from the Japanese experience. Empirical Economics.
Mogrovejo, J. (2005). Factores Determinantes de la Inversión Extranjera Directa en Algunos Países de Latinoamérica. Estudios Económicos de Desarrollo Internacional, Vol. 5
Montero Granados, R. (2011). Efectos fijos o aleatorios: test de especificación. Documentos de Trabajo en Economía Aplicada. Universidad de Granada.
Nolan, P., & Thurber, M. (2012). On the state’s choice of oil company: risk management and the frontier of the petroleum industry. En D. Victor, D. Hults, & M. Thurber, Oil and Governance: State Owned Enterprises and The World Energy Supply. New York: Cambridge University Press.
Pindyck, R. (1999). The Long-Run Evolution of Energy Prices. The Energy Journal, Vol 20.
Ross, M. (2012). The Oil Curse: How Petroleum Wealth Shapes The Development of Nations. New Jersey, Estados Unidos: Princeton University Press.
Sovacool, B., Mukherjee, I., Drupady, I., & L.D'Agostino, A. (2011). Evaluating energy security performance from 1990 to 2010 for eighteen countries. ELSEVIER.
U.S. Energy Information Administration. Who are the major players supplying the world oil market?. http://www.eia.gov/energy_in_brief/article/world_oil_market.cfm. Accessed 2018.02.6.
Vickers, J., & Yarrow, G. (1991). Economic perspectives on privatization. Journal of Economic Perspectives.
Victor, N. (2007). On Measuring the Perfomance of National Oil Companies . Program on Energy and Sustainable Development.
Victor, D. G., Hults, D. R., & Thurber, M. C. (Eds.). (2011). Oil and governance: state-owned enterprises and the world energy supply. Cambridge University Press.
Warshaw, C. (2012). The political economy of exporpiation and privatization in the oil sector. En D. Victor, D. Hults, & M. Thurber, Oil and Governance: State-Owned Enterprises and the World Energy Supply. New York: Cambridge University Press.
Wolf, C. (2009). Does ownership matter? The performance and efficiency of State Oil vs. Private Oil (1987–2006). Energy Policy.
Wolf, C. O., & Pollitt, M. G. (2008). Privatising national oil companies: Assessing the impact on firm performance.
Wooldridge , J. (2001). Econometric Analysis of Cross Section and Panel Data. The MIT Press. London, England.
World Bank, 1992. Legal framework for the treatment of foreign investment - volume 2: Guidelines. http://documents.worldbank.org/curated/en/955221468766167766/Guidelines, 1992. Accessed 2017.08.15.
The information for the estimation of the oil price was obtained from the series reported by BP Statistics for the years 1861 to 2015, taking the price of crude oil at US per barrel and deflating with the US consumer price index for the year 2015.
The estimation was made based on the specification of Pindick model (1999) and was obtained by applying the Ordinary Least Squares Method. The regression results are shown below:
Table 10
Estimated by OLS for
the crude oil price
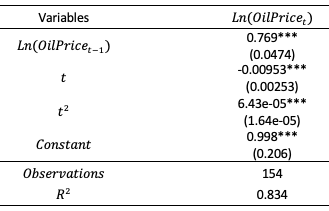
Standard errors in parentheses
(*** p<0.01, ** p<0.05, * p<0.1)
-----
Table 11
Descriptive statistics for the control
variables and explanatory variables
Variable |
Mean |
Standard Deviation |
Min |
Max |
Comments |
Oil Price |
4.0105 |
0.5771 |
2.92 |
4.76 |
N=931 |
Shock |
0.0116 |
0.2277 |
-0.56 |
0.31 |
N=931 |
Oil Production |
6.5976 |
1.3487 |
1.6094 |
9.3693 |
N=908 |
Diffusion of Privatization between countries |
2.4404 |
2.1631 |
0 |
7 |
N=931 |
Population |
16.8225 |
1.7534 |
12.6197 |
21.0339 |
N=931 |
GDP per capita |
23471 |
25112.38 |
993.09 |
134447.8 |
N=873 |
%GPD Growth |
4.8658 |
9.0666 |
-62.08 |
149.97 |
N=901 |
Capitalization Market |
55.1943 |
45.4679 |
0.04 |
303.57 |
N=440 |
Government Debt |
41.2709 |
29.7349 |
0.2139 |
283.7453 |
N=241 |
Corruption Control |
45.8464 |
20.8169 |
13.27 |
100.98 |
N=912 |
Government Effectiveness |
47.7698 |
19.861 |
7.49 |
97.13 |
N=916 |
Political Stability |
43.3786 |
19.8367 |
-13.7 |
80.34 |
N=916 |
Regulatory Quality |
46.5536 |
20.3817 |
6.19 |
90.46 |
N=916 |
Rule of Law |
45.294 |
19.9892 |
11.52 |
91.87 |
N=916 |
Voice and Accountability |
40.2261 |
20.4308 |
5.56 |
86.53 |
N=916 |
-----
Table 12
Mean Difference
Variable |
Privatization = 0 |
Privatization = 1 |
Mean Difference |
Oil Price |
4.0204 |
3.6528 |
0.3676*** |
Shock |
0.0123 |
-0.0136 |
0.0259 |
Oil Production |
6.5883 |
6.9222 |
-0.3338 |
Diffusion of Privatization between countries |
2.4073 |
3.64 |
-1.2327*** |
Population |
16.7763 |
18.4976 |
-1.713*** |
GDP per capita |
23520.31 |
21726.72 |
1793.589 |
GDP Growth (%) |
4.871 |
4.6824 |
0.1887 |
Market Capitalization |
55.1726 |
55.7688 |
-0.5961 |
Government Debt |
41.3329 |
39.8389 |
1.494 |
Corruption Control |
45.5824 |
55.7687 |
-10.03** |
Voice and Accountability |
39.8227 |
54.4284 |
-14.6008*** |
Political Stability |
43.1303 |
52.2312 |
-9.1009** |
Government Effectiveness |
47.4381 |
59.952 |
-12.1009*** |
Regulatory Quality |
46.2345 |
57.9256 |
-11.6911*** |
Rule of Law |
44.984 |
56.34 |
-11.3559*** |
(*** p <0.01, ** p <0.05, * p <0.1)
Annex D. Hausman test
Test statistic:

Table 13
Fixed Effects Estimation Vs. Random Effects Estimation
Coefficients |
||||
(b) |
(B) |
(bB) |
Avar(b)-Avar(B) |
|
Variable |
Fixed effects |
Random effects |
Difference |
SE |
Oil Price |
-1.69776 |
-1.865494 |
0.1677343 |
0.5005802 |
Shock |
1.799259 |
2.068972 |
-0.2697131 |
0.3767311 |
Population |
-0.9772124 |
0.8633829 |
-1.840595 |
8.103247 |
Current Account / GDP |
0.2063589 |
0.0742629 |
0.1320959 |
0.0801275 |
Normalized index |
0.1041051 |
0.0228562 |
0.081249 |
0.0615085 |
where,
1. Department of Industrial Engineering. Universidad de los Andes. Bogotá Colombia. Contact e-mail: s-cabral@uniandes.edu.co
2. Department of Industrial Engineering. Universidad de los Andes. Bogotá Colombia. Contact e-mail: mc.moncayo1575@uniandes.edu.co
3. Center for Energy, Petroleum and Mineral Law and Policy, University of Dundee, Dundee, United Kingdom. Contact e-mail: c.f.romero@dundee.ac.uk
4. It must be borne in mind that this paper categorizes a National Oil Company (NOC) when it is controlled by a national state, and an International Oil Company (IOC) when it is owned by private stockholders. The inclusion of mixed capital companies in one of these categories depends on the corporative arrangements regarding the administration of the company, the capital composition, and the legal regime that they must observe in their home country.
5. This time frame was selected due to the availability of data of sociopolitical explanatory variables which intend to be analyzed.