![]() ISSN 0798 1015
ISSN 0798 1015

![]() ISSN 0798 1015
ISSN 0798 1015
Vol. 40 (Number 35) Year 2019. Page 22
SYZDYKOVA A. 1.; ABUBAKIROVA A. 2 & KELESBAYEV D. 3; OMAROVA A. 4; AMANIYAZOVA G. 5; SAUBETOVA B. 6 & ANSHAYEVA D. 7
Received: 02/04/2019 • Approved: 09x/10/2019 • Published 14/10/2019
ABSTRACT: Foreign trade has an impact on the economy through both exports and imports. Exports are considered as a contribution to national income and economy, while imports are considered as an exit from the economy. In the literature, it is generally argued that exports have positive direct and indirect effects on the economy, while imports have a negative direct impact on national income. The aim of this study is to analyze the effect of exports and imports on national income with the quarterly data of 2000: 2017 period in Kazakhstan. The autoregressive distributed lag (ARDL) model was used for this purpose. According to the analysis results, the increase in both exports and imports in Kazakhstan increases the country's gross domestic product (GDP). While the 1% increase in exports in the long term leads to a 0.38% increase in gross domestic product, the increase in imports by 1% leads to an increase of 0.42% of gross domestic product. The long-term effect of exports is stronger than the short-term effect. Imports have a negative impact on economic growth in the short term and have a positive effect on the long term. Likewise, income elasticity of imports was statistically significant and positive. An increase of 1% in economic growth causes imports to increase by 0.60%. |
RESUMEN: El comercio exterior tiene un impacto en la economía a través de las exportaciones y las importaciones. Las exportaciones se consideran una contribución al ingreso y la economía nacionales, mientras que las importaciones se consideran una salida de la economía. En la literatura, generalmente se argumenta que las exportaciones tienen efectos directos e indirectos positivos en la economía, mientras que las importaciones tienen un impacto directo negativo en el ingreso nacional. El objetivo de este estudio es analizar el efecto de las exportaciones e importaciones en el ingreso nacional con los datos trimestrales del período 2000: 2017 en Kazajstán. Se usó el método de prueba de límites ARDL para este propósito. Según los resultados del análisis, el aumento de las exportaciones e importaciones en Kazajstán aumenta el PIB del país. Mientras que el aumento del 1% en las exportaciones a largo plazo conduce a un aumento del 0,38% en el PIB, el aumento de las importaciones en un 1% conduce a un aumento del 0,42% del PIB. El efecto a largo plazo de las exportaciones es más fuerte que el efecto a corto plazo. Las importaciones tienen un impacto negativo en el crecimiento económico a corto plazo y tienen un efecto positivo en el largo plazo. Asimismo, la elasticidad del ingreso de las importaciones fue estadísticamente significativa y positiva. Un aumento del 1% en el crecimiento económico hace que las importaciones aumenten en un 0,60%. |

The relationship between exports, imports and economic growth is one of the issues discussed in the economic literature. The most common evidence among economists is that exports have a positive impact on economic growth. In the last 40 years, many developing countries have abandoned their growth policies based on their import substitution, and have shifted to export-oriented growth policy (Zang and Baimbridge, 2012).
After the collapse of the Soviet Union, a new restructuring process started in Kazakhstan. In the beginning of the 1990s, the transition from the central planned and outward-facing model to an open model dominated by the market mechanism began. Kazakhstan has undergone various reforms in foreign trade within the framework of reforms aimed at establishing a multifaceted economy and moving to a free market. These, liberalization of foreign trade prices, restructuring of the foreign trade system, diversification of the market and changing the exchange system (Larsson, 2010).
The foreign trade reforms implemented by Kazakhstan started in terms of liberalization in foreign trade. In the liberalization of foreign trade, all import quotas were terminated, tariffs were reduced, all quotas and licenses applied, central export structure of strategic goods were canceled and barter trade was prohibited. With these measures, Kazakhstan has largely liberalized its foreign trade system, which has positively affected the country’s foreign trade.
Today, the foreign trade reform in Kazakhstan is largely completed. In this process, the structure of foreign trade has been largely liberalized by being not centralized, and foreign trade has turned to countries outside the former Soviet countries.
Kazakhstan has made an effort to enter the World Trade Organization (WTO) in order to ensure continuity in trade relations and to carry out its trade with developed countries, which are important in terms of foreign trade, on a more solid basis and on the 30th of November 2015 it became the 162th member of WTO.
In this study, the relationship between export, import and economic growth in Kazakhstan was investigated with ARDL cointegration test approach. Following this introductory chapter, the economy of Kazakhstan was evaluated in general. In the second part, the foreign trade structure of Kazakhstan was evaluated. In the third chapter, theoretical and empirical literature related to the subject are given. In the fourth chapter, data set, model and econometric method are explained. In the last section, the results of the application were evaluated and the study with the result section was completed.
The Republic of Kazakhstan was governed by the central planning economy of the USSR for approximately 70 years. After independence, it has been trying to develop its economy in a way that it can stand on its own feet in a new economic system - free market economy for 28 years (Syzdykova, 2018). This process, with the efforts to strengthen the economy; a troubled period that was not easy at all Özdil T., Turdaliyeva A., (2015). Two years after the independence, the hyperinflation period in Kazakhstan (1660%) has begun, but since 1996, it has achieved a steady growth trend, albeit at a low level (Figure 1).
Figure 1
GDP growth rate in Kazakhstan (1991-2017)
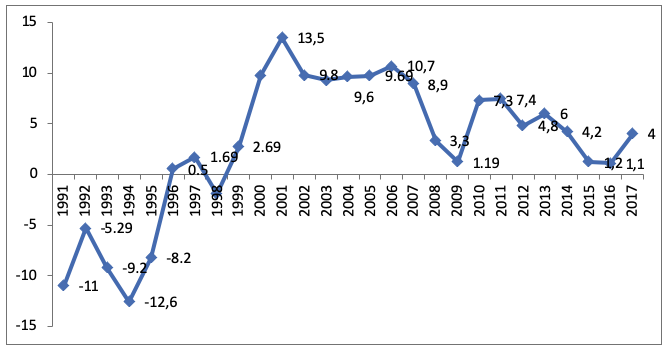
Source: World Bank data
As can be seen from Figure 1, Kazakhstan’s economy grew by 6.5% on average in the years 1999-2017. If we do not count the decrease due to the global crisis in 2009, gross domestic product increased from approximately USD 18 billion to USD 159 billion during the period. On the other hand, gross domestic product, which was 184.3 billion dollars in 2015, decreased significantly in 2016 and was 137 billion dollars. This is due to the decline in world oil prices (Table 1).
Table 1
Basic Macroeconomic Indicators
of Kazakhstan (1995-2017)
1995 |
2000 |
2005 |
2010 |
2015 |
2016 |
2017 |
|
Population, total (million people) |
15,8 |
14,8 |
15,1 |
16,3 |
17,5 |
17,7 |
18,1 |
GDP (bln dollars) |
20,3 |
18,2 |
57,1 |
148 |
184,3 |
137,2 |
159,4 |
GDP per capita (dollar) |
1288 |
1229 |
3771 |
9070 |
10510 |
7714 |
8837 |
GDP growth (annual%) |
-8,2 |
9,8 |
9,7 |
7,3 |
1,2 |
1,1 |
4 |
Inflation, consumer prices (annual%) |
176,1 |
13,1 |
7,5 |
7,4 |
6,6 |
14,3 |
7,4 |
Exports (bln dollars) |
5,9 |
10,2 |
30,4 |
65,5 |
52,9 |
43,6 |
55,7 |
Imports (bln dollars) |
8,9 |
8,9 |
25,4 |
44,2 |
45,2 |
39,1 |
40,3 |
Current account balance (% of GDP) |
-1,0 |
2,0 |
-1,8 |
0,9 |
-2,8 |
-6,5 |
-3,4 |
Total reserves (bln dollars) |
1,6 |
2,09 |
7,06 |
28,2 |
27,8 |
29,6 |
30,8 |
Foreign direct investment (bln dollars) |
0.964 |
13,7 |
25,4 |
7,4 |
6,3 |
16,7 |
4,5 |
Portfolio investments (million dollars) |
... |
19,3 |
149,7 |
133,9 |
5,7 |
-24,9 |
21,9 |
External debt stock, total (bln dollars) |
3,7 |
12,8 |
43,8 |
119,2 |
153,4 |
164,1 |
167,6 |
External debt stocks (% of GDP) |
18,5 |
75,7 |
84,7 |
92,6 |
88,5 |
131,7 |
118,4 |
Industry (% of GDP) |
29,9 |
37,7 |
37,6 |
40,6 |
30,9 |
32,0 |
32,0 |
Service (% of GDP) |
54,0 |
48,4 |
52,0 |
51,7 |
59,3 |
57,9 |
57,4 |
Manufacturing (% of GDP) |
14,6 |
16,5 |
12,0 |
11,3 |
10,3 |
11,3 |
11,2 |
Agriculture (% of GDP) |
12,3 |
8,1 |
6,4 |
4,5 |
4,7 |
4,6 |
4,4 |
Source: Created from World Bank data
As seen from the Table 1, the rate of inflation in Kazakhstan was 13.1% in 2000 and it has been able to reduce it to a single digit number since 2005. The country’s total exports are well above the import figures, and the country continues to provide foreign trade surplus. In 2017, Kazakhstan realized approximately 56 billion dollars of exports and 40 billion dollars of imports.
Looking at the sectoral distribution of gross domestic product, the service sector is the sector with the highest share with 50% shares. Industrial sector is in second place. The share of industry decreased from 40.6% in 2010 to 32% in 2017. The share of manufacturing and agricultural sector in gross domestic product is 11.2% and 4.4% respectively. The largest share in the industrial sector belongs to the mining and quarrying sub-sector (National Bank of Kazakhstan, 2018).
Immediately after gaining its independence, Kazakhstan applied various incentives to attract foreign investments in order to ensure its economic development. As a result, it has become the country that attracts the most foreign direct investment among the Central Asian countries. In 2017, Kazakhstan’s total foreign direct investment inflows were 147 billion dollars. In Kazakhstan, foreign direct investments, which have reached 5-6% of gross domestic product, are mainly concentrated in the oil and natural gas sector. 50-70% of the total foreign investments coming to Kazakhstan come to the energy sector.
Kazakhstan’s external debt stock has increased year on year, with total external debt stock amounting to 167.6 billion dollars in 2017. When the structure of external debt stock is examined; the share of public sector within the external debt stock is 8.4% and the share of the private sector is 91.6%. Moreover, 95.8% of Kazakhstan’s total external debt is composed of long-term debt. The share of inter-company debts arising from foreign direct investments made by foreign countries in long-term debts is very high. In addition, Kazakhstan owes approximately 120 countries, while 85% of its external debts belong to only 11 countries. These countries respectively; Netherlands, USA, France, Japan, Bermuda Islands, England, Russia, Virgin Islands, South Korea, China, Hong Kong and Switzerland (National Bank of Kazakhstan, 2018).
After Kazakhstan gained its independence, the reforms it had made in foreign trade and the foreign trade policy mentioned, on the other hand, Kazakhstan’s high import-export potential, significant developments in the field of foreign trade of the national economy emerged. According to Trade Map data, Kazakhstan is ranked 50th in the world in terms of total exports and it is in the 62th place in terms of imports (Trade Map, 2019).
Kazakhstan’s foreign trade volume amounted to 98 billion 429 million dollars in 2017, of which 55.7 billion dollars was for export and 42.6 billion dollars for import. Kazakhstan’s foreign trade volume increased 15-fold compared to the first years of independence (Figure 2).
Until 1998, Kazakhstan gave significant deficits in foreign trade. In 1995, the country’s foreign trade deficit was 126 million dollars, while in 1998 it was approximately $ 1 billion. However, after 2001, foreign trade started to give a surplus in oil prices which is the most important export item in Kazakhstan. Due to the fact that oil and gas are the main components of the country’s exports, the changes in the prices of these products in the world markets cause the foreign trade balance of Kazakhstan to continuously fluctuate. Since production in Kazakhstan is mostly concentrated in the oil and gas sectors, the demand for capital and consumer goods in the country cannot be met. The insufficiency of capital and consumer goods in Kazakhstan causes the country’s economy to be an economy based on imports. For this reason, the country’s large and open boundaries in the country, cheap, illegal and even in terms of quality is very high in the inflow of goods (Yücememiş et al., 2017). The ratio of exports to imports in Kazakhstan is around 130%.
Figure 2
Import and export of Kazakhstan
(million dollars)
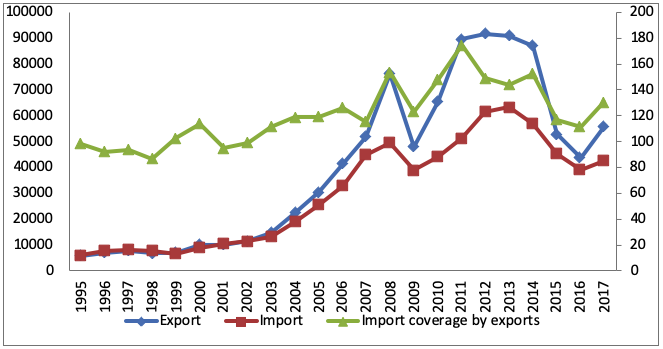
Source: World Bank data
Crude oil accounts for 67.7% of Kazakhstan’s total exports in 2017. Natural gas, iron and steel, copper and ore, slag (coal crumbs) and ash follow respectively. This shows that the energy and iron and steel industry is dominant in production in Kazakhstan (Table 2).
Table 2
Major Export Products of Kazakhstan (Million Dollars)
Product Label |
2001 |
2005 |
2010 |
2011 |
2012 |
2013 |
2014 |
2015 |
2016 |
2017 |
% |
Mineral fuels, mineral oils |
4757 |
19525 |
41032 |
63456 |
64485 |
64621 |
60700 |
31119 |
22334 |
30679 |
63.5 |
Iron and steel |
1008 |
2244 |
3683 |
6122 |
5890 |
3252 |
3383 |
2500 |
2750 |
4186 |
8.7 |
Copper and articles thereof |
704 |
1507 |
2153 |
3294 |
3770 |
2921 |
1830 |
2008 |
1918 |
2526 |
5.2 |
Inorganic chemicals |
271 |
846 |
2609 |
3011 |
3533 |
3129 |
2839 |
3105 |
2413 |
2168 |
4.5 |
Ores, slag and ash |
221 |
925 |
2185 |
4428 |
3994 |
2729 |
2603 |
1084 |
1193 |
2102 |
4.3 |
Zinc and articles thereof |
157 |
312 |
555 |
768 |
1031 |
487 |
588 |
577 |
553 |
837 |
1.7 |
Cereals |
343 |
240 |
988 |
759 |
1694 |
1338 |
1135 |
832 |
816 |
829 |
1.7 |
Precious stones, precious metals |
236 |
399 |
1213 |
1649 |
1893 |
1119 |
754 |
747 |
649 |
594 |
1.2 |
Aluminium and articles thereof |
48 |
25 |
372 |
557 |
492 |
489 |
380 |
419 |
382 |
533 |
1.1 |
Products of the milling industry |
28 |
147 |
556 |
565 |
619 |
587 |
574 |
499 |
518 |
487 |
1.0 |
Salt; sulphur; earths and stone |
49 |
102 |
298 |
711 |
742 |
521 |
586 |
549 |
359 |
363 |
0.8 |
Various grains, seeds and fruits |
2 |
5 |
31 |
91 |
253 |
187 |
273 |
230 |
203 |
279 |
0.6 |
Lead and articles thereof |
56 |
89 |
179 |
359 |
324 |
159 |
209 |
190 |
222 |
256 |
0.5 |
Other |
605 |
1480 |
1390 |
2337 |
3561 |
3159 |
3604 |
2095 |
2465 |
2503 |
5.2 |
All products |
8485 |
27846 |
57244 |
88107 |
92281 |
84698 |
79458 |
45954 |
36775 |
48342 |
100 |
Source: Trade Map, 2019
In the importation of Kazakhstan; in 2017, the most important import items were electrical machines with a share of 18.3% and 10% with machinery-mechanical devices (Table 3). However, the high volume of unregistered trade in the country makes the attempts to follow the course of imports difficult. Kazakhstan’s large, easy-to-pass borders with Russia, Kyrgyzstan and Uzbekistan allow for small-scale border trade, but the volume of border trade cannot be reflected in foreign trade date (Anessov, 2015: 29).
Table 3
Main Imported Products of Kazakhstan
(Million Dollars)
Product Label |
2001 |
2005 |
2010 |
2011 |
2012 |
2013 |
2014 |
2015 |
2016 |
2017 |
% |
Machinery, mechanical appliances |
1322 |
3381 |
4326 |
5561 |
6806 |
7497 |
6852 |
5600 |
4397 |
4719 |
16.1 |
Electrical machinery and equipment |
529 |
1521 |
2527 |
3815 |
3940 |
3997 |
3976 |
3068 |
2428 |
3017 |
10.3 |
Mineral fuels, mineral oils and products of their distillation |
793 |
2062 |
2379 |
4878 |
4814 |
5472 |
2319 |
1681 |
1516 |
1768 |
6.0 |
Vehicles and parts |
519 |
1697 |
1038 |
1871 |
3309 |
4511 |
4401 |
2021 |
1108 |
1750 |
6.0 |
Articles of iron or steel |
588 |
1565 |
1770 |
2005 |
3514 |
4416 |
2524 |
2584 |
1958 |
1706 |
5.8 |
Plastics and articles thereof |
125 |
431 |
783 |
1245 |
1397 |
1594 |
1485 |
1093 |
980 |
1121 |
3.8 |
Pharmaceutical products |
120 |
415 |
924 |
985 |
1298 |
1614 |
1420 |
1222 |
961 |
1093 |
3.7 |
Iron and steel |
142 |
658 |
498 |
1082 |
1204 |
1148 |
1049 |
875 |
656 |
1033 |
3.5 |
Medical or pharmaceutical products |
156 |
343 |
757 |
1972 |
1066 |
1231 |
1120 |
794 |
748 |
904 |
3.1 |
Ores, slag and ash |
60 |
124 |
111 |
195 |
634 |
373 |
532 |
525 |
694 |
857 |
2.9 |
Miscellaneous chemical products |
106 |
230 |
360 |
449 |
524 |
591 |
566 |
455 |
434 |
642 |
2.2 |
Furniture |
102 |
275 |
650 |
792 |
725 |
786 |
789 |
594 |
440 |
571 |
1.9 |
Other |
1718 |
4631 |
7900 |
13160 |
15307 |
15574 |
14262 |
10055 |
8854 |
10164 |
34.6 |
All products |
6280 |
17333 |
24023 |
38010 |
44538 |
48804 |
41295 |
30567 |
25174 |
29345 |
100 |
Source: Trade Map, 2019
In 2017, the first three places in Kazakhstan’s exports were Italy (17.93%), China (11.95%) and the Netherlands (9.82%). Kazakhstan’s total imports in 2017 decreased by 10.7 billion dollars to 30 billion dollars. According to 2017 date, Kazakhstan’s imports were mostly from Russia with a share of 39.10%. Russia was followed by China (15,99%) and Germany (5,06%) (Table 4).
Table 4
Foreign Trade of Kazakhstan by Major Countries
(million dollars)
EXPORT |
|||||||||||
Importers |
2001 |
2005 |
2010 |
2011 |
2012 |
2013 |
2014 |
2015 |
2016 |
2017 |
% |
Italy |
956 |
4190 |
9576 |
15045 |
15465 |
16480 |
16051 |
8136 |
7474 |
8669 |
17.93 |
China |
646 |
2422 |
10122 |
16291 |
16484 |
14373 |
9799 |
5480 |
4214 |
5777 |
11.95 |
Netherlands |
141 |
877 |
4160 |
6637 |
7479 |
9888 |
8724 |
4980 |
3255 |
4748 |
9.82 |
Russia |
1733 |
2926 |
3006 |
7514 |
6747 |
5875 |
6388 |
4547 |
3509 |
4515 |
9.34 |
Switzerland |
378 |
5509 |
1234 |
4952 |
4965 |
4313 |
4539 |
2659 |
2687 |
3100 |
6.41 |
France |
7 |
2665 |
4433 |
5414 |
5632 |
5460 |
4690 |
2681 |
1798 |
2861 |
5.92 |
Spain |
6 |
464 |
921 |
1135 |
768 |
1846 |
2363 |
1219 |
992 |
1444 |
2.99 |
Uzbekistan |
150 |
242 |
1101 |
1179 |
1343 |
1145 |
1083 |
942 |
922 |
1250 |
2.59 |
Turkey |
74 |
156 |
1234 |
2574 |
3229 |
2603 |
2272 |
1275 |
851 |
1145 |
2.37 |
Ukraine |
490 |
200 |
665 |
2670 |
2549 |
2041 |
1672 |
1173 |
911 |
1138 |
2.35 |
Other |
3904 |
8195 |
20792 |
24696 |
27620 |
20674 |
21877 |
12862 |
10162 |
13695 |
28.33 |
Total |
8485 |
27846 |
57244 |
88107 |
92281 |
84698 |
79458 |
45954 |
36775 |
48342 |
100 |
IMPORT |
|||||||||||
Exporters |
2001 |
2005 |
2010 |
2011 |
2012 |
2013 |
2014 |
2015 |
2016 |
2017 |
% |
Russia |
2751 |
6581 |
5475 |
16269 |
17110 |
17971 |
13807 |
10529 |
9129 |
11472 |
39.10 |
China |
171 |
1251 |
3964 |
5021 |
7497 |
8364 |
7357 |
5087 |
3665 |
4692 |
15.99 |
Germany |
485 |
1298 |
1828 |
2082 |
2270 |
2455 |
2314 |
1985 |
1443 |
1484 |
5.06 |
USA |
347 |
1204 |
1315 |
1716 |
2119 |
2155 |
1993 |
1484 |
1276 |
1253 |
4.27 |
Italy |
268 |
679 |
1581 |
1145 |
960 |
1036 |
1039 |
1176 |
835 |
946 |
3.22 |
Uzbekistan |
81 |
254 |
473 |
770 |
817 |
970 |
1017 |
725 |
587 |
735 |
2.51 |
Turkey |
136 |
399 |
616 |
729 |
786 |
926 |
1019 |
741 |
618 |
730 |
2.49 |
South Korea |
110 |
256 |
527 |
622 |
956 |
1265 |
1066 |
607 |
453 |
567 |
1.93 |
France |
141 |
291 |
501 |
687 |
584 |
1032 |
1085 |
670 |
660 |
535 |
1.82 |
Belarus |
46 |
207 |
251 |
623 |
675 |
698 |
773 |
488 |
332 |
508 |
1.73 |
Other |
1744 |
4913 |
7492 |
8346 |
10764 |
11932 |
9825 |
7075 |
6176 |
6423 |
21.88 |
Total |
6280 |
17333 |
24023 |
38010 |
44538 |
48804 |
41295 |
30567 |
25174 |
29345 |
100 |
Source: Trade Map, 2019
The relationships between export, import and economic growth have been a subject of much interest in the development and growth literature. The neoclassical view argues that there is a strong relationship between export expansion and economic growth, and that export expansion is one of the main determinants of growth. This causality from export to economic growth has been labeled in the literature as the export-led growth hypothesis (Çetintaş and Barişik, 2009). The number of studies on the economy of Kazakhstan is quite low. This is a situation that will increase the importance of this study.
Çetintaş and Barişik (2009) examined the relationship between export, import and economic growth for the 13 transition economies, including Kazakhstan. The result of the study shows that there is a one-way causality from economic growth to exports in these countries. It has been determined that the export hypothesis based on growth in transition economies is valid and that growth is more shaped by the increase in import demand.
In the study Sarı et al. (2010), investigated the relationship between economic growth and export in 5 Turkish Republics with data 1990-2008. In the short term, the authors stated that there is a one-way causality relationship from economic growth to exports and found that there is a bidirectional causality relationship between economic growth and exports in the long term.
Safdari et al. (2011) studied the relationship between export and economic growth in their work on 13 Asian countries and found a one-way causality relationship from exports to economic growth.
In his study Ağayev (2011), the panel of former Soviet Union (in 12 transition economies) conducted panel cointegration and panel causality analysis to show the relationship between export and economic growth in the country. The results of the research show that the increase in exports does not cause economic growth, in other words, the export-based growth hypothesis is not valid for these countries. The findings show the existence of a one-way relationship between growth and exports in both short and long term.
In their study Gül et al. (2013), gained independence with the collapse of the Eastern Bloc 6 investigated the growth of Turkey’s foreign trade and relations with the Turkish Republic. As a result of the analyzes, while there is a bilateral causality between export and growth in the long run, a unilateral causality relation from import to growth has been determined. However, this result was not reached in the short term. As a result of the study, the authors emphasize that Turkish Republics cannot achieve growth without reaching a certain level of industrialization and without macroeconomic transformations.
In the study Yardimcioglu and Gulmez (2013), the relationship between export and economic growth in the six Turkish Republics for the period 1995-2011 is to investigate. Panel cointegration tests, Pedroni FMOLS, Panel VECM and Pedroni Panel Causality methods were used in this study. As a result it was observed that the export and economic growth variables in the said countries had a cointegration relationship in the long term and the long term coefficient was 0.40. This means that an increase of 100 dollars in exports across the 6 Turkish Republics results in an increase of approximately 40 dollars in the long run over economic growth. However, according to the results of short-term causality analysis using Vector error correction model, bilateral and causality between export and economic growth have been determined both in the short term and in the long term.
In the study Ganiyev (2016) comparatively analyze the relationships between exchange rate, import, export and GDP in Kyrgyzstan and Kazakhstan, with ARDL cointegration approach. The results showed that foreign trade has positive impact on economic growth in Kyrgyzstan, both in the short and in the long term, whereas Kazakhstan imports play a greater role in economic growth. On the other hand, it revealed that export in Kyrgyzstan in the short term depends on the GDP and imports; in the long term re-export is coming to the fore. Also, it turned out that volatility of exchange rates in Kyrgyzstan, increasing uncertainties and risks, have a negative impact on economic growth, while devaluation in Kazakhstan reduce imports in the short and long run.
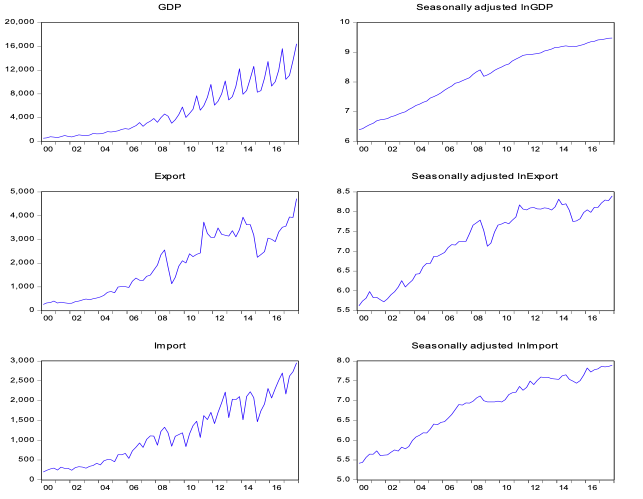
In this study, the gross domestic product (GDP), export (X) and import (M) data of 2000Q1-2017Q4 period were used. All data were seasonally adjusted and the logarithm was taken with Tramo Seats method. All data were obtained from Central Bank of the Republic of Kazakhstan. The general course of the variables used in graphical analysis is presented. According to this, the gross domestic product in Kazakhstan, exports and imports are constantly growing.
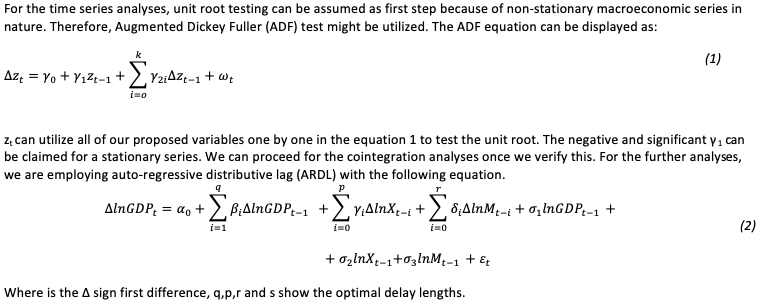
Figure 3
Graphic representation of the variables
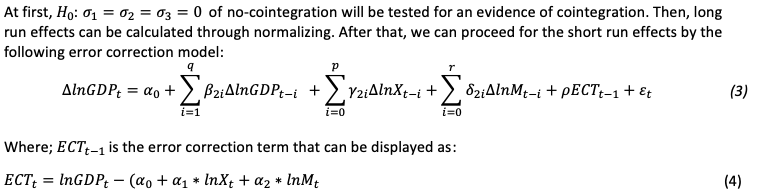
The coefficient of the error correction term (ρ) in the short term equation shows the rotation speed of the series to equilibrium. In the same way, the individual models are estimated for cases where the export (lnX) and import (lnM) data are dependent variables.
In order to test whether the series has a unit root, augmented Dickey–Fuller (ADF, Dickey and Fuller, 1981) a unit root test is used. The results for the ADF unit root test are reported in Table 5.
Table 5
ADF unit root test results
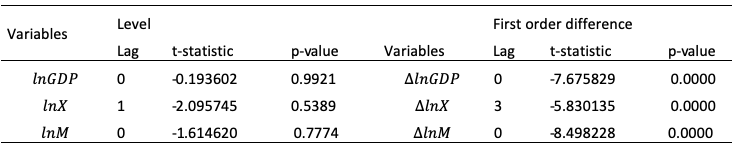
![]()
The results show in Table 5 that all variables (lnGDP, lnX and lnM) are not stationary at levels but stationary after first differences. A mix order of integration can be claimed after the unit root analyses. But, it is sufficient for the further cointegration analyses as ARDL is valid technique in this case.
According to the ARDL cointegration test method, if the found F-statistic is higher than the upper limit I (1) created by Pesaran et al., (2001), it is concluded that these series are cointegrated.
Table 6 displays the cointegration results of our models. According to the critical values of Pesaran et al., (2001), it can be rejected the hypothesis which states that there is no cointegration in the models where the GDP is the dependent variable of imports in Kazakhstan; in cases where exports are dependent variables, it cannot be rejected.
Table 6
F-statistic of cointegration relationship
Dependent variable |
Explanatory variables |
F-statistic |
Lower, I (0) |
Upper, I (1) |
lnGDP |
lnX, lnM |
10.609* |
3.79 |
4.85 |
lnX |
lnGDP, lnM |
3.976 |
3.79 |
4.85 |
lnM |
lnGDP, lnX |
5.320* |
3.79 |
4.85 |
Note: The critical values presented in the table were
obtained from Case III, Peseran et al. (2001: 300).
* indicates 1% significance level
According to the long-term coefficients (Table 7), the increase in both exports and imports increases the country's GDP, ie. foreign trade contributes significantly to the growth of the country's economy. 1% increase in exports in the long term leads to an increase of 0.38% in GDP, while the increase in imports by 1% leads to an increase of 0.42% in GDP. The long-term effect of exports is stronger than the short-term effect. Imports have a negative impact on economic growth in the short term and have a positive effect on the long term. Likewise, income elasticity of imports was statistically significant and positive. An increase of 1% in economic growth causes imports to increase by 0.60%.
Table 7
Long-Term Coefficients
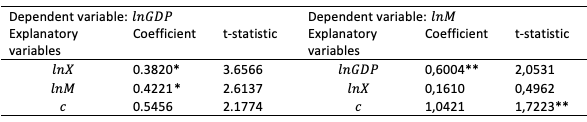
* and ** show 1% and 5% significance levels
Error citation models were estimated after cointegration relationships (Table 8).
Table 8
Error Correction Models
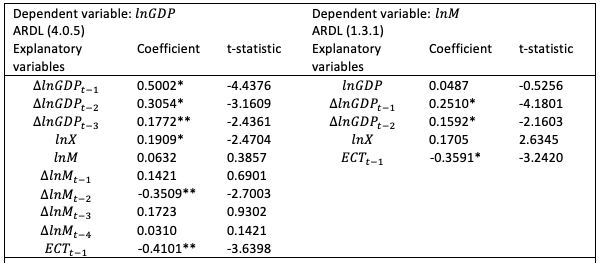
* and ** show 1% and 5% significance levels
It is seen that there is a significant effect of both exports and imports with their own delays to the GDP of Kazakhstan. The effect of only 2nd delay on imports was statistically significant at 5% significance level and its coefficient was negative. In other words, the effect of imports on growth in the short term is more negative. On the other hand, both GDP and export variables affect imports in the short term. However, the fact that both the GDP and the error correction terms of imports are high (-0.41 and -0.36 respectively) indicate that their speed to return to equilibrium is high.
Studies in the literature have shown that exports have positive direct and indirect effects on the economy in general. It is observed that imports have a negative direct impact on national income. On the other hand, it is suggested that imports of raw materials, intermediate and capital goods provide domestic production increase, and productivity increases in production through technology imports and that imports may have positive indirect effects on economic growth. The existence and effectiveness of these impacts are generally attributed to the share of foreign trade in the national economy and the structure of foreign trade.
Developing countries generally adopt the import substitution policy of import goods with domestic goods, or export-oriented industrialization strategy integrated with the international economy. As in all transition economies, the economy of Kazakhstan is experiencing the troubles of the transition to free market economy, generally based on the export of low value-added raw materials foreign trade structure, consumption and the presence of economic structure based on imports of intermediate goods, high value-added products cannot be produced, technological developments sufficiently to follow, such as foreign dependency bears the basic problems.
In the application part of the study, ARDL test was used in Kazakhstan to examine the relationship between economic growth, export and import. In this context, long and short term relationships between variables were estimated. According to the results, imports are an important source of growth due to external dependency in technology and investment goods (machinery and equipment share in total imports exceed 30%). At the same time, this may explain the increase in growth triggering imports. Since exports consist of approximately minerals, exports are mostly affected by external demand and the situation of world mineral markets and GDP is not affected by import variables.
In this respect, macroeconomic policies should be implemented quickly in accordance with the 2050 strategy plan. In this context; It is necessary to establish an economic system in which high value added products are produced by using advanced technologies based on free market economy financed by foreign capital and more domestic savings.
Ağayev, S. (2011). İhracat ve ekonomik büyüme ilişkisi: 12 geçiş ekonomisi örneğinde panel eştümleşme ve panel nedensellik analizleri. Ege Akademik Bakış, 11(2), 241-254.
Anessov, O. (2015). “Kazakistan ve Türkiye Ticari ve Ekonomik İlişkilerinin Büyümeye Katkıları”. Unpublished Master's Thesis. Marmara Üniversitesi Sosyal Bilimler Enstitüsü. İktisat Anabilim Dalı. Uluslararası İktisat Bilim Dalı. İstanbul.
Çetintaş, H., & Barişik, S. (2009). Export, import and economic growth: The case of transition economies. Transition Studies Review, 15(4), 636-649.
Dickey, D. A., & Fuller, W. A. (1981). Likelihood ratio statistics for autoregressive time series with a unit root. Econometrica: Journal of the Econometric Society, 1057-1072.
Fosu, A. K. (1990). Exports and economic growth: the African case. World Development, 18(6), 831-835.
Ganiyev, J.(2016). Kırgızistan ve Kazakistan’da Dış Ticaret, Döviz Kuru ve Ekonomik Büyüme Arasındaki İlişki. MANAS Sosyal Araştırmalar Dergisi, 5(3), 89-101.
Gül, E., Kamacı, A., & Konya, S. (2013). Dış ticaretin büyüme üzerine etkileri: Türk Cumhuriyetleri ve Türkiye örneği. Akademik Bakış Dergisi, 35, 1-12.
Larsson, J. (2010). The Transition in Kazakhstan: from command to market economy. Department of Economics at the University of Lund, Minor Field Study Series, (199).
National Bank of Kazakhstan, (2018). https://nationalbank.kz/?docid=146&switch=kazakh (Date of access: 09.03.2019).
Özdil T., Turdaliyeva A., (2015). Çıktı Sources of Economic Growth in the Kazakhstan Economy: An Analysis with an Input-Output Analysis Approach ‘. International Eurasian Economies Conference 2015 Proceedings. pp. 841-845.
Pesaran, M. H., Shin, Y., & Smith, R. J. (2001). Bounds testing approaches to the analysis of level relationships. Journal of applied econometrics, 16(3), 289-326.
Safdari, M., Mahmoodi, M., & Mahmoodi, E. (2011). The causality relationship between export and economic growth in Asian developing countries. American Journal of Scientific Research, 25, 40-45.
Sarı, S., Gerni, C., Değer, K., & Emsen, Ö. S. (2010, November). Geçiş Sürecindeki Türk Cumhuriyetlerinde Ekonomik Büyüme ve İhracat İlişkileri. In International Conference on Eurasian Economies (Vol. 2010, pp. 392-397).
Syzdykova, A. (2018). Orta Asya Ülkelerinde Enerji Tüketimi Ve Ekonomik Büyüme İlişkisi: Panel Veri Analizi. Journal of Economics & Administrative Sciences/Afyon Kocatepe Üniversitesi Iktisadi ve Idari Bilimler Fakültesi Dergisi, 20(1).
Trade Map, (2019). https://www.trademap.org/Index.aspx, (Date of access: 09.03.2019).
Yardımcıoğlu, F., & Gülmez, A. (2013). Türk cumhuriyetlerinde ihracat ve ekonomik büyüme ilişkisi: Panel eşbütünleşme ve panel nedensellik analizi. Bilgi Ekonomisi ve Yönetimi Dergisi, 8(1), 145-161.
Yücememiş, B. T., Arıcan, E., & Alkan, U. Türkiye–Özbekistan–Kazakistan Ekonomik İlişkileri Ve Bankacılık Sistemi. Finansal Araştırmalar ve Çalışmalar Dergisi, 9(17), 161-203.
Zang, W., & Baimbridge, M. (2012). Exports, imports and economic growth in South Korea and Japan: a tale of two economies. Applied Economics, 44(3), 361-372.
1. Akhmet Yassawi University, Turkestan, Kazakhstan
2. Akhmet Yassawi University, Turkestan, Kazakhstan
3. Akhmet Yassawi University, Turkestan, Kazakhstan. Email: dinmukhamed.kelesbayev@ayu.edu.kz
4. Yessenov University, Aktau, Kazakhstan
5. Yessenov University, Aktau, Kazakhstan
6. Yessenov University, Aktau, Kazakhstan
7. Yessenov University, Aktau, Kazakhstan