![]() ISSN 0798 1015
ISSN 0798 1015

![]() ISSN 0798 1015
ISSN 0798 1015
Vol. 40 (Issue 38) Year 2019. Page 12
KAZAKOV, Mikhail Y. 1
Received: 18/07/2019 • Approved: 28/10/2019 • Published 04/11/2019
ABSTRACT: The present state of the regional economic space is difficult to consider in isolation from the pattern of industrial specialization. In southern Russian regions, it is the currently aggravated socio-economic issues being determined by the crisis events and processes in the economy that make us adopt a new perspective to look at the need to establish a balanced spatial economic policy for preventing asymmetry and polarization in the development of separate territories. |
RESUMEN: El estado actual del espacio económico regional es difícil de considerar aislado del patrón de especialización industrial. En las regiones del sur de Rusia, son los problemas socioeconómicos actualmente agravados que son determinados por los eventos y procesos de crisis en la economía lo que nos hace adoptar una nueva perspectiva para considerar la necesidad de establecer una política económica espacial equilibrada para prevenir la asimetría y la polarización en el desarrollo de territorios separados. |

As an open economic system of the centre-peripheral type, the regional economic space is a multitude of various potentials, which ensures a certain level of socio-economic development of all local communities. The level of the potential is measurable and variable depending on the available set of general and specific factors and conditions that could be structured into the following groups: the availability of natural and climatic resources and minerals for industrial production development; territorial localization and the development level for basic transport infrastructure; human capital development level and the prerequisites for external recruitment of qualified personnel; institutional conditions for economic activity; the historical archetype of territorial economic development.
The entrenchment process for certain economic activities in the economic space of the region is of a prolonged nature accelerating and decelerating through time. The zoning of economic activity in space is uneven due to the different territorial availability of labour, production, and economic-infrastructural resources. Systemic properties of the regional economy are shaped and reproduced by the depth of spatial economic development and the intensity of efforts from economic agents. The capacity for creating the optimal conditions for maintaining a balance of production and consumption is a priority for regional system-building measures enabling sustainable socio-economic policy between the regional centre and its peripheries, a reduction of industry shifts and spatial economic asymmetry.
Our methodology of a system-diagnostic approach to the research of the economic space of the agro-industrial region necessarily requires to include the identification phase for the economic specialization of territories. It is due to this factor that the author's working hypothesis takes into consideration the direct correlation between the industrial distinctiveness of the region's economy and the level of socio-economic development of the peripheries. This hypothesis needs to be verified determining the subject area of the research and its relevance.
General provisions of the theoretic and methodological platform are formed by the author on the basis of a representative retrospective scientific base in the field of spatial-industrial analysis and system diagnosis of regional problems and situations ( Stroev & Stroeva, 2017) (Teterin, 2004) ( McFarlane, Blackwell, Mounter, & Grant, 2016) (Saparova, 2014) (Narolina, 2018) . In addition, the Russian experience of applying different techniques to identify industrial structural shifts is generalized and systematized for selecting the most rational one after reviewing many. The methodological basis of the research is presented by an array of fundamental techniques of scientific knowledge: analysis, synthesis, spatial, systemic, and hierarchical approaches. In the course of the research, we used a variety of instrumental and methodological facilities: abstract-logical and economic-statistical methods, system and comparative analysis, typological and graphic methods of representing results.
The duration of the research is 12 years (2005-2016) with the main issue being in the lack of sufficient official information at the municipal level. The information base is represented by the sources of the regional statistics agencies of the Stavropol territory, the database of municipal entities (statistical passports) of the region, as well as official sites of municipal entities.
According to the logic of research objective achievement, its course is defined as a consistent and coherent progression through the following analytical and diagnostic operations:
- analysis of the regional industrial specialization, identification of the leading and backward industries of the productive and tertiary sectors of the economy;
- examining the dynamic fluctuations of the regional industrial specialization and identifying the economic specialization of the peripheries in the model region;
- a spatial economic interpretation of the results and eventual classification of the peripheries in the analyzed model region by the industry specialization type and the intensity of its deformations for the period under research.
As a model region subject to detailed analysis on structural shifts in the industrial specialization of the economy, we selected the Stavropol territory located in the centre of the North-Caucasus Economic Region. It is a characteristic representative of agro-industrial regions so the research method tested on its empirical and factual basis can be applied to other subjects of a similar type.
To identify the industrial specialization of the Stavropol territory, we conducted an analytical sampling of indicators. Using them the leading industries of the regional economy were defined by applying different techniques.
Table 1 represents an empirical data from 2004 till 2016 on the industrial structure of gross value added in terms of 15 types of economic activity. Productive industries, wholesale and retail trade, and agriculture hold leading positions. Fluctuations of the indicator for the analyzed period are different:
- the level of value-added agricultural production decreased significantly in 2009 with a subsequent increase until 2011, a drop to 10.4% in 2012, and a sustained growth until 2016;
- the decline in added value is indicated for "Wholesale and retail trade" economic activity from 2010 till the research date; the volatility amounted to 1.8% throughout the analyzed period;
- the aggregate of industrial production branches makes a significant contribution to the regional gross product, the indicator fluctuations are insignificant (1.3%).
Table 1
Industrial structure of gross value added of Stavropol territory, %
Types of economic activity |
Years |
2016 vs 2004,% |
||||||||||||
2004 |
2005 |
2006 |
2007 |
2008 |
2009 |
2010 |
2011 |
2012 |
2013 |
2014 |
2015 |
2016 |
||
Agriculture, hunting and forestry |
20,8 |
16,3 |
14 |
16,8 |
14 |
10,6 |
12,4 |
13 |
10,4 |
12,1 |
15 |
17,2 |
17,5 |
84,1 |
Fishing, fish farming |
0 |
0 |
0 |
0 |
0,1 |
0,1 |
0,1 |
0,1 |
0,1 |
0,1 |
0,1 |
0,1 |
0,1 |
- |
Industry |
21 |
22,9 |
24,2 |
20,3 |
21 |
19,3 |
21,2 |
20,3 |
18,5 |
18,1 |
17,8 |
20,1 |
19,8 |
94,3 |
Mining |
1,6 |
2,1 |
2,8 |
1 |
1 |
0,8 |
0,8 |
0,7 |
0,8 |
0,7 |
0,7 |
0,6 |
0,5 |
31,3 |
Manufacturing |
13,8 |
14 |
15,2 |
14,3 |
15 |
12,4 |
14,1 |
13,7 |
12,1 |
11,8 |
11,8 |
14,9 |
14,2 |
102,9 |
Production and distribution of electricity, gas and water |
5,6 |
6,8 |
6,2 |
5 |
5 |
6,1 |
6,3 |
5,9 |
5,6 |
5,6 |
5,3 |
4,6 |
5,1 |
91,1 |
Construction |
6,3 |
5,3 |
7,2 |
7,2 |
7,9 |
7,3 |
7,7 |
9,9 |
8,6 |
8 |
7,7 |
6,5 |
5,7 |
90,5 |
Wholesale and retail trade |
17,1 |
17,4 |
17,8 |
19,1 |
19,8 |
20,6 |
21 |
20 |
21,1 |
19,6 |
18 |
17 |
15,2 |
88,9 |
Hotels and restaurants |
1,1 |
1,3 |
1,6 |
1,6 |
1,6 |
1,9 |
2,1 |
2,1 |
2,5 |
2,5 |
2,4 |
2,4 |
2,4 |
2 times |
Transportation and communication |
13,2 |
15 |
13,3 |
10,6 |
10,8 |
11 |
10 |
9,1 |
9,4 |
8,8 |
9,3 |
8,9 |
9,3 |
70,4 |
Financial activity |
0,1 |
0,3 |
0,1 |
0 |
0 |
0,2 |
0,3 |
0,5 |
0,5 |
0,4 |
0,3 |
0,2 |
0,3 |
3 times |
Real estate, renting, and services |
5 |
6 |
5,7 |
5,8 |
6 |
6,4 |
5,2 |
5,9 |
6,5 |
6,3 |
6,2 |
6,2 |
8,8 |
176 |
State administration, military security; compulsory social security. |
4,2 |
4,3 |
5 |
6,9 |
7,3 |
8,3 |
7,7 |
8 |
9,8 |
9,8 |
9,2 |
8,2 |
7,7 |
183,3 |
Education |
4,2 |
4,2 |
4 |
4,2 |
4,1 |
5,2 |
4,4 |
3,8 |
4,2 |
4,7 |
4,4 |
4,1 |
3,9 |
92,9 |
Healthcare |
5,8 |
5,9 |
5,9 |
6,4 |
6,3 |
7,9 |
6,9 |
6,5 |
7,3 |
8,1 |
8,1 |
7,5 |
7,7 |
132,7 |
Other |
1,2 |
1,1 |
1,2 |
1,1 |
1,1 |
1,2 |
1 |
0,8 |
1,1 |
1,5 |
1,5 |
1,6 |
1,6 |
133,3 |
Source:Official data from the website of the Ministry of agriculture of the Stavropol territory
The economic industries with the level of gross value added at 10% or more are of analytical value for our research. Figure 1 represents the dynamics of this indicator in terms of economic activities meeting this criterion.
Figure 1
Dynamics of domestic value added for
leading industries of Stavropol territory
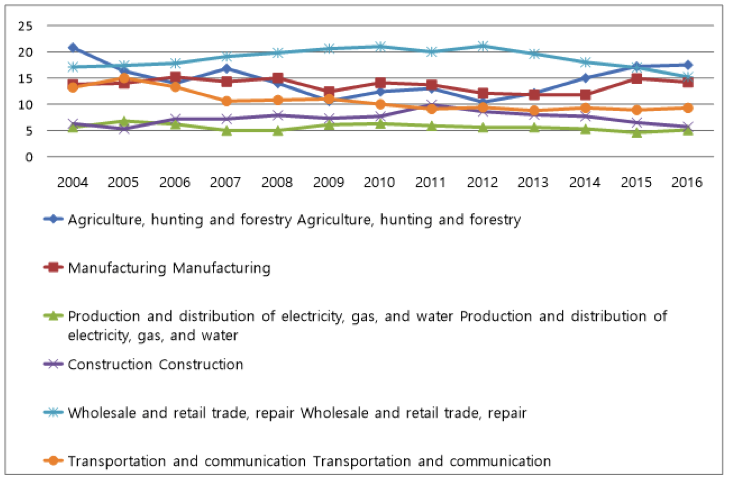
Source:Rosstat database
By grouping the data from table 1 and taking into account the sectoral characteristics of the economy of the Stavropol territory, we can conclude that the share of the tertiary sector of the economy is prevalent (56.9% in 2016, 51.9% in 2004).
The role of the productive sectors of the economy is paramount. Their development and modernization form the preferential momentum for a balanced regional economy. Due to this, the analysis of the primary (production of capital goods) and secondary (industrial production) sectors of the economy of the Stavropol territory is preferable for the purposes of our research. Further on the economic specialization will be analyzed from the production complex standpoint according to the following types of economy: 1) agricultural only; 2) agro-industrial (industrial-agricultural); 3) industrial only.
A common way of identifying the territorial industrial specialization is to determine the share of production indicators of separate industries and their ratio between each other or the average Russian level as the baseline for comparison. Different combinations of calculated values are the basis for attributing the territories to agro-industrial (industrial-agricultural) or to the mono-industrial specialization of the economy.
The author's point in this regard is based on the results of earlier scientific research (Kudrova & Chukanova, 2015) (Sysoyev, A.M. , 2013) (Grabowski, 2013) (Russu, 2015). Within this framework, the criteria for attributing the territories as agro-industrial can be defined according to the following:
- share of the domestic value-added industry is more than 10% in the overall structure of industries, with consistency in dynamics;
- the leading position of the industry in the regional economy is determined by the absolute values of the group of indicators: the value of fixed productive assets, fixed investments, the employment rate in the industry, with constancy in dynamics of development;
- minimum wear level for basic production assets, with a decrease in dynamics.
During the analyzed period, the value of fixed assets increased for all types of economic activity with the highest increase recorded for manufacturing (5.7 times in 2016) among production branches. The smallest growth in economic activities amounted to 156.6% for "Fishing, fish farming" and 171.4% for "Production and distribution of electricity, gas and water". The aggregate level of industrial economic activities (319 760 million rubles in 2016) and agriculture (151 696 million rubles in 2016) have the highest values for this indicator. Among the tertiary sectors, the significant value of fixed assets is recorded for "Transportation and communication" as well as for "Real estate, renting and services" economic activity.
By the degree of wear for fixed assets, the average minimum values for the entire analyzed period are recorded for the following types of economic activity: "Real estate, renting, and services" (37.6%); "Financial activity" (39.9%); "Wholesale and retail trade" (41.9%); "Manufacturing" (45.4%); "Agriculture, hunting and forestry" (46.4%). The maximum level of wear is for "Mining" (69.9%).
The volume of investments characterizes the competitiveness of industries with the largest share recorded in 2005 for "Transportation and Communication" economic activity making 25.6 % of total regional investment volume, whereas in 2016 it was "Agriculture, hunting and forestry" with 25.5%.
The ability of the industry to provide employment plays an important role in the socio-economic condition of the region. So, obviously, the following economic activities are crucial for the regional labor market: for "Wholesale and retail trade" the average level of employment is 222.3 thousand people or 17.5%; for "Agriculture, hunting and forestry" it is 218.1 thousand people or 17.1% of all employed in the region; it is 143 thousand people for "Manufacturing". It should be noted that during the analyzed period there was no sharp redistribution of the employed from productive sectors into the tertiary one. Such consistency of the labour market structure indicates a stable development level of specialization industries in the region.
The result of analyzing the industrial specialization of the Stavropol territory is represented in table 2, showing the rating of indicative figures.
Table 2
Rating of industrial specialization indicators of Stavropol territory’s economy
Types of economic activity |
1 |
2 |
3 |
4 |
1 |
2 |
3 |
4 |
||||
2004 |
2016 |
2004 |
2016 |
2004 |
2016 |
2004 |
2016 |
2016 vs 2004,% |
||||
Agriculture, hunting and forestry |
4 |
3 |
4 |
5 |
3 |
1 |
1 |
2 |
372,1 |
-2,6 |
13,1 |
88,7 |
Fishing, fish farming |
15 |
15 |
3 |
12 |
- |
- |
н.д. |
н.д. |
156,6 |
13,7 |
0,0 |
н.д. |
Mining |
8 |
10 |
14 |
14 |
8 |
9 |
14 |
14 |
248,8 |
-12,7 |
3,1 |
68,1 |
Manufacturing |
5 |
4 |
9 |
4 |
4 |
2 |
3 |
3 |
573,1 |
-10,6 |
9,2 |
88,0 |
Production and distribution of electricity, gas, and water |
3 |
5 |
11 |
10 |
5 |
6 |
11 |
11 |
171,4 |
-13,8 |
-0,3 |
109,9 |
Construction |
12 |
12 |
12 |
11 |
9 |
12 |
7 |
6 |
363,3 |
-15,1 |
0,4 |
118,3 |
Wholesale and retail trade |
10 |
8 |
6 |
1 |
6 |
5 |
2 |
1 |
589,7 |
-11,9 |
2,3 |
112,1 |
Hotels and restaurants |
14 |
14 |
13 |
3 |
- |
14 |
12 |
12 |
469,5 |
-30,0 |
0,1 |
148,5 |
Transportation and communication |
1 |
1 |
7 |
15 |
1 |
3 |
6 |
5 |
421,6 |
12,5 |
-13,0 |
108,4 |
Financial activity |
13 |
13 |
1 |
6 |
10 |
13 |
13 |
13 |
415,2 |
10,2 |
-0,5 |
175,3 |
Real estate, renting, and services |
2 |
2 |
2 |
2 |
2 |
10 |
9 |
9 |
364,3 |
0,9 |
-15,1 |
144,8 |
State administration, military security; compulsory social security. |
7 |
6 |
11 |
8 |
12 |
4 |
8 |
10 |
558,7 |
-14,7 |
6,8 |
123,1 |
Education |
9 |
9 |
8 |
9 |
13 |
7 |
4 |
7 |
384,3 |
-1,6 |
4,8 |
87,4 |
Healthcare |
6 |
7 |
5 |
13 |
7 |
8 |
5 |
4 |
305,6 |
5,1 |
0,9 |
103,0 |
Other |
11 |
11 |
10 |
7 |
11 |
11 |
10 |
8 |
296,8 |
-13,6 |
1,7 |
172,6 |
Source:Rosstat database and author's calculations
Note: there are indicators in the first row of the table marked as follows: 1 - value of fixed assets, million rubles; 2 - degree of wear for fixed assets, %; 3 - fixed investments, %; 4 - employment rate, thousand people.
In the productive sector, the agricultural production and separate productive industries (manufacturing) hold leading positions. According to assessments, agriculture holds the best indicators to credibly confirm the agro-industrial production-branch structure of the economy of the Stavropol territory. Trade activity has leading position among industries of the tertiary sector.
Characterizing dynamic changes in the industrial structure, it can be concluded that there are no significant fluctuations in indicative figures of industry specialization, which has positive and negative consequences for the region. The permanent structure provides a guaranteed amount of socio-economic effects. As for positive points, we can highlight the stability of tax payments, a balanced employment structure, the growth of the resident population, and the decrease in the vacancy rates. However, there are also negative points: the effect of low dynamics of the regional economy; an intensification of existing social issues (owing to the continuity of economic conditions); out-migration due to the lack of necessary vacancies; spatial permanence of the territory (lack of spatial economic momentum for changes).
The structure of the industrial specialization is a certain internal organization of elements within the region. The process of structural transformation is constant and depends on several factors at the same time significantly affecting the spatial characteristics of the territory and the level of socio-economic development of the region in general.
To analyze quantitative changes in structure, we used a linear factor of absolute structural shifts with a variable comparative base:
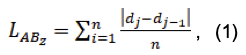
where LABZ is a linear factor of absolute structural shifts (chain, or with a variable comparative base); d is for proportions of indexes; n is the number of graduations in structures; j is for comparable periods.
The analytical value of analyzing structural industrial shifts consists in shaping a general concept of the permanence or dynamics of indicators for the economic condition of peripheries. We selected two key indicators:
- production volume (for productive industries), trade turnover (without small business entities), thousand rubles;
- the number of employed, people.
The estimate is the average deviation from proportions. A step-by-step comparison of the aggregate data set characterizes the rate of change in socio-economic processes affecting the industry specialization of peripheries in the Stavropol territory.
The traditional interpretation of the calculations’ results includes the following estimating intervals:
However, due to focusing analytical actions on micro-level it should be considered that the speed of processes in the peripheries is much lower than that of a regional centre or urban area. Therefore, we decided to expand the estimating intervals for analyzing structural industrial shifts in peripheries:
- below 2% for small structural shifts (intangible);
- 2-5% for structural shifts of average intensity (slightly tangible);
- 2-10% for structural shifts tangible for the economic space of the peripheries;
- over 10% significant structural shifts introducing changes in socio-economic indicators (tables 3,4).
Table 3
Areas of Stavropol territory with significant and medium level of structural shifts
(indicator: volume of production, trade turnover of; MD - municipal district, UD - urban district)
Assessment criteria |
2009-2005, % (on average for each year) |
2010 vs 2009,% |
2011 vs 2010,% |
2012 vs 2011,% |
2013 vs 2012,% |
2014 vs 2013,% |
2015 vs 2014,% |
2016 vs 2015,% |
Peripheries with significant structural industrial shifts (over 10%) |
||||||||
below 2% |
Andropovsky MD Krasnogvardeisky MD
|
Krasnogvardeisky MD |
Andropovsky MD Budennovsky MD |
Krasnogvardeisky MD |
Krasnogvardeisky MD |
Andropovsky MD |
Krasnogvardeisky MD |
Andropovsky MD Budennovsky MD |
2-5 % |
Budennovsky MD |
Andropovsky MD |
Krasnogvardeisky MD |
Andropovsky MD Budennovsky MD |
Budennovsky MD |
|
Andropovsky MD |
|
5-10% |
|
|
|
|
|
Budennovsky MD Krasnogvardeisky MD |
Budennovsky MD |
|
over 10 % |
|
Budennovsky MD |
|
|
Andropovsky MD |
|
|
Krasnogvardeisky MD |
Peripheries with medium structural industrial shifts (below 10%) |
||||||||
below 2% |
Blagodarnensky UD Mineralovodsky UD |
|
Blagodarnensky MD Grachevsky MD Mineralovodsky UD Novoaleksandrovsky UD |
Grachevsky MD Novoaleksandrovsky UD
|
Blagodarnensky MD Novoaleksandrovsky UD
|
Blagodarnensky MD Grachevsky MD Mineralovodsky UD Novoaleksandrovsky UD |
Mineralovodsky UD |
Grachevsky MD Novoaleksandrovsky UD
|
2-5 % |
|
Blagodarnensky UD Grachevsky MD Mineralovodsky UD Novoaleksandrovsky UD |
|
|
Grachevsky MD Mineralovodsky UD |
|
Grachevsky MD
|
Blagodarnensky MD Mineralovodsky UD |
5-10% |
Grachevsky MD Novoaleksandrovsky UD Shpakovsky MD |
|
|
Blagodarnensky MD Mineralovodsky UD |
|
|
Blagodarnensky MD Novoaleksandrovsky UD |
|
Source:Author's calculations
----
Table 4
Areas of Stavropol territory with variable and permanent industrial structure
(indicator: volume of production, trade turnover of; MD - municipal district, UD - urban district)
Peripheries with variable industrial structure (shifts below 5% ) |
||||||||
Assessment criteria |
2009-2005,% (on average for each year) |
2010 vs 2009,% |
2011 vs 2010,% |
2012 vs 2011,% |
2013 vs 2012,% |
2014 vs 2013,% |
2015 vs 2014,% |
2016 vs 2015,% |
below 2% |
Aleksandrovsky MD Izobilnensky MD Petrovsky UD Predgorny MD Sovetsky MD |
Aleksandrovsky MD Georgievsky UD Izobilnensky MD Sovetsky MD |
Aleksandrovsky MD Georgievsky UD Izobilnensky MD Kirovsky UD Petrovsky UD Predgorny MD Sovetsky MD |
Aleksandrovsky MD Georgievsky UD Predgorny MD |
Georgievsky UD Kirovsky UD Predgorny MD Sovetsky MD |
Aleksandrovsky MD Georgievsky UD Izobilnensky MD Petrovsky UD Predgorny MD Sovetsky MD |
|
Aleksandrovsky MD Georgievsky UD Izobilnensky MD Predgorny MD |
2-5 % |
Georgievsky UD Kirovsky UD |
Kirovsky UD Petrovsky UD Predgorny MD |
|
Izobilnensky MD Kirovsky UD Petrovsky UD Sovetsky MD |
Aleksandrovsky MD Izobilnensky MD Petrovsky UD |
Kirovsky UD |
Aleksandrovsky MD Georgievsky UD Izobilnensky MD Kirovsky UD Petrovsky UD Predgorny MD Sovetsky MD |
Kirovsky UD Petrovsky UD Sovetsky MD |
Peripheries with permanent industrial structure (below 2%, with possible irregular minor exceedance) |
||||||||
Аpanasenkovsky MD, Arzgirsky MD, Ipatovsky MD, Kursky MD, Levokumsky MD, Neftekumsky MD, Stepnovsky MD, Trunovsky MD, Turkmensky MD |
||||||||
In contrast to the monetary indicator, we calculated structural industrial shifts in the employment size for the indicated types of economic activity, which are directly influenced by another group of factors, primarily social. Table 5 represents the results of the calculations.
Fluctuations in the employment size during the analyzed period were not so significant comparing to the monetary indicator of the economy state of the peripheries. However, there is a general trend:
- by 2015-2016 the rate of change in the employment structure significantly increased;
- 2011 was the most stable year with no significant fluctuations and exceedances of a stable level (below 2%);
- a significant change in the employment structure is caused by the following types of economic activity: agriculture (in most cases due to reducing staff), manufacturing (due to increasing the numbers of employed), trade (reducing numbers of employed).
Table 5
Structural shifts of industrial specialization of peripheries in Stavropol territory
(indicator - employment size, MD - municipal district, UD - urban district)
Peripheries |
Years |
|||||||
2009-2005 |
2010 vs 2009 |
2011 vs 2010 |
2012 vs 2011 |
2013 vs 2012 |
2014 vs 2013 |
2015 vs 2013 |
2016 vs 2015 |
|
Aleksandrovsky MD |
0,46 |
1,22 |
3,28 |
2,43 |
2,63 |
1,37 |
1,34 |
1,32 |
Andropovsky MD |
0,48 |
0,59 |
2,38 |
3,02 |
1,31 |
0,98 |
1,65 |
3,56 |
Аpanasenkovsky MD |
0,08 |
0,6 |
0,43 |
0,67 |
0,28 |
0,21 |
1,79 |
0,76 |
Arzgirsky MD |
0,12 |
0,08 |
1,43 |
1,79 |
1,85 |
0,91 |
1,37 |
2,14 |
Blagodarnensky UD |
0,1 |
0,78 |
0,78 |
0,91 |
3,67 |
0,77 |
1,2 |
2,33 |
Budennovsky MD |
0,05 |
1,37 |
1,07 |
0,33 |
1,03 |
5,62 |
0,92 |
4,04 |
Georgievsky UD |
0,1 |
0,33 |
1,42 |
1,07 |
0,12 |
0,32 |
4,46 |
3,13 |
Grachevsky MD |
0,32 |
3,7 |
1,08 |
0,54 |
2,59 |
3,68 |
4,89 |
2,74 |
Izobilnensky UD |
0,02 |
1,86 |
1,08 |
2,84 |
0,52 |
1,18 |
0,43 |
1,08 |
Ipatovsky UD |
0,13 |
2,92 |
0,51 |
0,93 |
1,78 |
1,98 |
1,86 |
2,19 |
Kirovsky UD |
0,16 |
0,73 |
2,27 |
0,86 |
1 |
1,5 |
4,54 |
3,72 |
Kochubeevsky MD |
0,24 |
0,42 |
0,82 |
0,35 |
0,57 |
1,19 |
0,46 |
0,53 |
Krasnogvardeisky MD |
0,39 |
4,38 |
1,67 |
3,01 |
0,94 |
0,58 |
0,31 |
1,28 |
Kursky MD |
0,16 |
0,78 |
1,53 |
1,94 |
0,51 |
1,36 |
1,19 |
6,69 |
Levokumsky MD |
0,07 |
0,97 |
0,94 |
0,87 |
1,48 |
1,68 |
0,54 |
3,24 |
Mineralovodsky UD |
0,53 |
0,9 |
1,24 |
1,71 |
4,32 |
0,68 |
1,68 |
0,78 |
Neftekumsky UD |
1,33 |
1,98 |
0,68 |
1,62 |
1,31 |
0,84 |
3,01 |
1,85 |
Novoaleksandrovsky UD |
0,53 |
1,18 |
0,53 |
1,41 |
2,13 |
1,98 |
3,55 |
1,21 |
Novoselitsky MD |
0,3 |
0,06 |
0,32 |
0,16 |
0,34 |
0,27 |
0,11 |
0,23 |
Petrovsky UD |
0,13 |
1,79 |
0,93 |
1,05 |
1,24 |
2 |
0,64 |
1,97 |
Predgorny MD |
0,3 |
1,81 |
1 |
0,71 |
0,72 |
0,54 |
2,92 |
3,47 |
Sovetsky UD |
0,14 |
0,92 |
0,68 |
1,14 |
0,19 |
0,7 |
0,42 |
0,5 |
Stepnovsky MD |
0,23 |
0,42 |
2,83 |
1,06 |
1,18 |
0,25 |
3,63 |
3,13 |
Trunovsky MD |
0,01 |
0,48 |
0,16 |
0,49 |
0,08 |
1,45 |
0,81 |
0,49 |
Turkmensky MD |
0,02 |
0,63 |
0,56 |
0,22 |
1,57 |
1,24 |
0,94 |
0,39 |
Shpakovsky MD |
0,1 |
0,38 |
0,5 |
1,59 |
0,25 |
2,26 |
0,96 |
0,89 |
Source:Author's calculations
During the discussion of the results obtained in this research with the experts in the field of spatial economics at several panel sessions within the scientific community of Stavropol, Krasnodar, Rostov, and Belgorod territories of the Russian Federation, a vision for further scientific prospects for the development in this direction was articulated. It consists of the need to create a common concept of an adaptive selective policy of spatial economic development in the regions with the corresponding agro-industrial profile. A critical comparison between our research activities and a number of similar ones (Kiseleva & Orlyanskaya, 2012) (Kovaleva, 2015) allowed to determine the logic, perspective, and relevance of their further development.
According to the scientific community (Persteneva, 2012) (Ederer & Reschenhofer, 2018) it is undoubtedly necessary to improve the system-diagnostic research methodology for the agriculturally-oriented regions of southern Russia that have an important geo-economic position not only for the Russian Federation, but also for the entire macro-region of Transcaucasia.
The comprehensive analysis of the industrial specialization of the Stavropol territory as well as the structure of industrial distinctiveness for the peripheries leads to a conclusion about the permanence of economic orientation of the region in general. In the context of active spatial economic transformations, this permanence determines the domestic reserves for economic growth as well as contributes to the retaining the region's position within the national division of labor.
Prospects for applying the research results are linked to derived development of complex special measures on the direct and indirect impact on system-creating factors for forming the specialization of the regional economy within the framework of the spatial economic policy of regional development. In this regard, the author's diagnostic approach may represent a significant addition to the analytical and methodical support for the study of the economic space of southern Russian regions with a similar specialization of the economy. Also, the results of the research could be of benefit to the territorial authorities, the corporate sector in developing strategic directions of the economic activity.
McFarlane, J. A., Blackwell, B. D., Mounter, S. W., & Grant, B. J. (2016). From agriculture to mining: The changing economic base of a rural economy and implications for development. Economic Analysis and Policy(49), 56-65.
Stroev, A. I., & Stroeva, G. N. (2017). Agriculture as a branch of the specialization of the region. Scientists notes PNU, 8(4), 150-156.
Ederer, S., & Reschenhofer, P. (2018). (2018)” Macroeconomic imbalances and structural change in the EMU” 46, 59-69. Structural Change and Economic Dynamics(46), 59-69.
Grabowski, R. (2013). Agricultural distortions and structural change. Journal of Asian Economics(24), 17-25.
Kiseleva, N. N., & Orlyanskaya, A. A. (2012). The estimation of a level of social and economic development of rural territories of region. Fundamental research, 11(5), 1266-1270.
Kovaleva, T. Y. (2015). Statistical indicators in the analysis of the structure of the socio-economic system. International scientific journal "Innovative science(4), 23-28.
Kudrova, N. A., & Chukanova, K. V. (2015). Prospects of development of economy Tambov region in the conditions of realization of policy of import substitution. Social and economic phenomena and processes, 7(10), 155-160.
Narolina, Y. V. (2018). The investment at attractiveness of the agro-industrial regions. REGION: Systems, Economics, Management, 41(2), 19-29.
Persteneva, N. P. (2012). (2012)”Criteria for classification of indicators of structure differences and shifts” 3 (2) , 478-482. Fundamental research, 3(2), 478-482.
Russu, C. (2015). Structural Changes Produced in the Romanian Manufacturing Industry in the Last Two Decades. Procedia Economics and Finance(22), 323-332.
Saparova, G. K. (2014). The Current state of regional development in the context of the development of transnational clusters. Rusnauka . Extracted from http://www.rusnauka.com/40_OINBG_2014/Economics/13_179833.doc.htm, 5, 9-12.
Sysoyev, A.M. , A. M. (2013). To the issue about the technique of the assessment of modernization potential of economy of the russian regions. Social and economic phenomena and processes , 49(3), 136-144.
Teterin, N. I. (2004). Strategic planning of socio-economic development of the agro-industrial region. Ekaterinburg: Ural Academy of public service.
1. FSAEI HE Belgorod National Research University. Russia Federation. Email: lyasay21@yandex.ru