![]() ISSN 0798 1015
ISSN 0798 1015

![]() ISSN 0798 1015
ISSN 0798 1015
Vol. 40 (Issue 40) Year 2019. Page 24
SANNY, Lim 1; TUERAH, Ester L. 2; RIFKYVAR, Melissa A. 3 & MERCADO, Michel H. 4
Received: 13/07/2019 • Approved: 04/11/2019 • Published 18/11/2019
4. Conclusions and suggestions
ABSTRACT: National Single Window is a system that can help improve the quality of international trading with custom clearance so that it can encourage local business actors to trade internationally. Indonesia has the system of Indonesia National Single Window which has started operating since 2012 as a realization of the Association of South East Asian Nations (ASEAN) Economic Community (AEC) in the past 2015. The purpose of this research is to analyze the level of satisfaction of this website portal based on six criteria, which are: Efficiency, Trust, Reliability, Facility Automation, Citizen Support, and Compensation. This research uses the MUlticriteria Satisfaction Analysis (MUSA) Method to analyze the data from 32 respondents. The result of this research found that Trust and Compensation, out of all six criteria, were the ones mostly affecting the global satisfaction of the INSW users. It was also found that for how the system works for now, Facility Automation and Citizen Support has the highest satisfaction index out of all the criteria. |
RESUMEN: La Ventana Única de Tramites es un sistema que ayuda a mejorar la calidad de las relaciones comerciales internacionales con el despacho de aduana con el objetivo de animar a los empresarios locales para abrir sus puertas al comercio internacional. Desde el 2012, empezó a funcionar en Indonesia el sistema de Ventana Única Nacional de Indonesia (INSW) siendo parte del conjunto de la Comunidad Económica de la Asociación de Naciones del Sudeste Asiático (ASEAN). El objetivo de este estudio es analizar el nivel de satisfacción de este sitio web que se basa en seis criterios: Eficiencia, Confianza, Confiabilidad, Automatización de instalaciones, Apoyo ciudadano y Compensación. Este estudio aplica el método de Multicriteria de Análisis de Satisfacción (MUSA) para analizar los datos de 32 encuestados. El resultado de esta investigación identificó que la confianza y la compensación de estos seis criterios son los que más afectaron a la satisfacción de los clientes de INSW en general. También se identificó del proceso de operación actual de este sistema que la Automatización de instalaciones y Apoyo ciudadano tienen el índice de satisfacción más alto de todos los criterios. |

Globalization has affected every important aspects of life (Nurhaidah, 2015). From the economic point of view, globalization had opened up the possibility to expand market through international trading, because in this modern time there is no country that is completely self-sufficient. International trade will always be a constant need due to difference of resources, capabilities, and specialization each country has. So, for that, each country has to involve trade with other countries (Vijayasri, 2013). It means that international trade is essential for the increase of the world economy through its influences related to the expansion of investments in different countries, international trade development, and communication development (Surugiu, M. R., & Surugiu, 2015).
According to Ningsih (2016), if compared to nation-wide trading, international trading is a lot more complicated and complex, where the complexity is mainly because of political and state boundaries that affects trade, such as tariffs, quotas, and customs duty. The issues of international trade and economic growth have become so important together with the introduction of trade liberalization policies of developing countries all over the world. Trade between developing countries especially in ASEAN is becoming as important as trade between developing and developed countries. By growing the domestic market of a developing country and pursuing regional economic integration, developing countries can diversify the productions away from their traditional export markets in Europe and America (Vijayasri, 2013).
To make it easier for international trading, Indonesia joined ASEAN Free Trade Area (AFTA) with the other member countries of the Association of Southeast Asian Nations (ASEAN) in 1993 to establish a free trade agreement in hopes that it would promote economic development of the ASEAN countries as the expansion of exports would result in output growth and the expansion of imports would improve productive efficiency (Okabe, 2013). In the year 1980s and 1990s it is clear that global trade was expanding rapidly. With the results in complexity, speed of the supply chain and the number of parties involved, it highly affected the requirements for information control of the flow of goods. But even with the developments of information and communications technologies (ICT) and trade data exchange standards at that time, trade documentation exchanges are still mostly done manually, or paper based. It is one concern in the modern trade environment that such practice could not satisfy the need for efficiency and security. In Recommendation No. 33 of the United Nations Economic Commission for Europe or also known as UNECE defines the Single Window as a “facility that allows parties involved in trade and transport to lodge standardized trade-related information and/or documents to be submitted once at a single entry point to fulfill all import, export, and transit-related regulatory requirements” (Tsen, 2011). This means that this window is used as the development of trade documentation for a better efficiency and security in one single platform.
Association of South East Asian Nations (ASEAN) was one of the first organizations to create a concept of a regional Single Window. Some countries under ASEAN organization have already had their own single window concept that works within the countries’ government agencies nationally, which is called the National Single Window (NSW). In December 2005, ASEAN concluded the agreement to establish and implement the ASEAN Single Window (ASW). The ASW is the first regional initiative that was created to enhance regional connectivity (Tsen, 2011). It is also a key component to achieve the ASEAN Economic Community (AEC) in 2015 (http://asw.asean.org/). To implement ASW, each ASEAN members must have its own NSW portals. These portals will then work as an integrated system of what we call the ASW to create an easier and simpler form of international trade documentation environment for ASEAN countries. Indonesia itself achieved Indonesia National Single Window (INSW) that was inaugurated in January 2010 after several years of introduction and gradual implementation. The application of INSW was conducted by facilitating an online-system or web-based portal through INSW Portal. This portal will integrate information related to the process of handling customs documents and goods release, which ensures the security of data and information and integrate the flow and process information between internal systems automatically, such as customs clearance, licensing, port/airport, and other additional systems related to the process of handling customs documents and goods disbursements (http://bsn.go.id/). INSW itself aside from its main reason to enhance the ASEAN Free Trade Area, especially the AEC 2015, it is used by the government to attract more local businesses to start doing international trade by simplifying the procedures through this INSW portal and also to increase the level of local competitiveness within our country. As quoted from the official page of INSW, it is said that Indonesia’s high cost of national logistics causes the price of Indonesian products to increase, which then leads to difficulty in competing with other products in the international trade environment. The two reasons that cause the high cost of national logistics are the 1) speed of administrative process including the licenses issued by the ministry and other agencies, and 2) the process of the physical movements of goods by the customs (http://www.insw.go.id/). Therefore, by applying this INSW portal into the nation’s system, the government hopes that these problems could be resolved.
Each year the World Bank runs a survey to determine the rankings of Ease of Doing Business (EoDB) in 189 countries. This EoDB is calculated through 10 indicators. In 2016, Indonesia is ranked 106th and in 2017, the ranks increased by 15 numbers to number 91. Even so, Indonesia is still considered lower than the other ASEAN countries (Jurnal Maritim, 2017). To improve the ranking, Indonesia needs to fix the problems. One of the indicators where Indonesia is ranked above 100 is the ‘Trading Across Border’ indicator. This means that Indonesia’s international trading is still not as effective as other countries, and this is mainly caused by a long dwelling time. A long dwelling time can also cause a big loss because it takes up more time and more money, which lessen the efficiency and effectiveness of the trading process. As an act to lessen the dwelling time, government appealed to everyone related in the criterion “Trading Across Borders” to optimize the use of INSW portal: to all governmental and non-governmental agencies and also traders to coordinate well through the portal for a faster and simpler process.
INSW is a trade facilitation provided by the government to ease exporter and importer in submitting documents needed through a single window where institutes like Ministry of Trade, other governmental agencies, banks, logistics, and customs are connected all-together for easier and faster process. Through the INSW portal, users can also track the whereabouts of their documents and products shipped. But as we can see above, there are things that haven’t met the expected potentials of the INSW portal itself even though it did help with the process, but it still needs improvement for better efficiency and effectiveness. To see what needs to be improved for the INSW site to reach its full potential, it needs to be checked on how the site has been working. In this research, researchers use the User Satisfaction aspect to measure each dimension that the site offers, and which are the dimensions that has more value than others that needs to be improvised first. The dimensions used in this research to measure the users’ satisfaction had already been validated by five experts; these dimensions are Efficiency, Trust, Reliability, Facility Automation, Citizen Support, and Compensations (Ismail, 2014).
Based on the issues described in the background, the following problems can be identified:
The objectives of this research are to find out how each dimension affects the satisfaction level of INSW users, also to know how satisfied the users with the INSW web portal are and indicates which dimensions of the INSW site that needs to be improved.
The analysis technique used in this research is the quantitative method. Based on the source of data, this research uses two types of data which is the primary data and the secondary data. The primary data obtained by distributing questionnaires to the respondents, while the secondary data are taken from previous studies and research as a theoretical support for this research. This research used descriptive research method, because the result of this research shows the value of each Criterion in influencing the user satisfaction index. Variables used in this research are dependent and independent variables, where the independent variables (X) are the dimension of e-service quality and the dependent variable (Y) is the User Satisfaction. Individuals in the unit of analysis refer to the individuals that work as an importer, exporter, or even a government agency officer that uses the INSW portal. This research is to test whether the INSW users are satisfied with the system in fulfilling its tasks through the perspective of the user. Also, to indicate which dimensions of the INSW web site that still needs to be improved. This research uses data from 32 respondents that was collected via questionnaire where the samples must be a user of the INSW web portal and working in an international trade company to make sure they are the regular user of the portal, which then was analyzed through the MUlticriteria Satisfaction Analysis (MUSA) Method using Excel Solver Software.
For the data to be processed using MUSA Method, it first needs to pass the validity and reliability tests. From thirty-two sample with the confidence level 95% the result for Rtable = 0.30 is obtained, it means all the data used in this research is valid. After being considered valid, a test should also be measured through a reliability test, therefore the answers can be considered true and trustworthy. The result for reliability Cronbach’s Alpa 0.935 it greater than R table (0.3), so data acquired from the questionnaires are reliable. After the data used in this research is valid and reliable; therefore it can be taken to the next step, which is the MUSA Method.
This test is to minimize the total of errors. Using Excel Solver, the optimum values are obtained:
Table 1
Optimum Value
W11 |
W12 |
W21 |
W22 |
W31 |
W32 |
W41 |
W42 |
W51 |
W52 |
W61 |
W62 |
Z1 |
Z2 |
E+ |
E- |
0 |
0 |
92.59 |
0 |
0 |
0 |
0 |
0 |
0 |
0 |
0 |
7.41 |
100 |
0 |
0 |
0 |
Source: Researcher (2018)
The optimum value, weight of each sub criterion can be achieved using the Criterion Weighted Value (CWV) formula:
CWV = (Wij + Wnm / 100) %
These global satisfaction data will be used for analysis using MUSA Method do determine the weight, Average Satisfaction Indices (ASI), Average Demanding Indices (ADI) and Average Improvement Indices (AII) that will be used to create the Action and Improvement Diagram. But before getting into the Optimality Test, the dataset needs to be in monotonic form. From this optimum value, we can see that the second and sixth criterions have the highest weight, which means that these criterions are considered as the most relatively important criterion that affects the user satisfaction
The Stability Test in this research will be done six times, because there are six criterions that need to be analyzed. For this stability test, researcher can decide to which extent the sum of error could be and it is decided to use ε=10, meaning the sum of error should only be equal to or less than ten. The stability test is also done through Excel Solver using LP (4.3) as a reference to the objectives and constraints, in which results in the following:
Table 2
Stability Test:
Maximization of all criteria
Max Value |
Criterion1 |
Criterion2 |
Criterion3 |
Criterion4 |
Criterion5 |
Criterion6 |
Average |
W11 |
99 |
0 |
0 |
0 |
0 |
0 |
16.5 |
W12 |
1 |
0 |
0 |
0 |
0 |
0 |
0.17 |
W21 |
0 |
94 |
0 |
0 |
0 |
0 |
15.67 |
W22 |
0 |
6 |
0 |
0 |
0 |
0 |
1 |
W31 |
0 |
0 |
99 |
0 |
0 |
0 |
16.5 |
W32 |
0 |
0 |
1 |
0 |
0 |
0 |
0.17 |
W41 |
0 |
0 |
0 |
88.24 |
0 |
0 |
14.71 |
W42 |
0 |
0 |
0 |
11.76 |
0 |
0 |
1.96 |
W51 |
0 |
0 |
0 |
0 |
94.44 |
0 |
15.74 |
W52 |
0 |
0 |
0 |
0 |
5.56 |
0 |
0.93 |
W61 |
0 |
0 |
0 |
0 |
0 |
50 |
8.33 |
W62 |
0 |
0 |
0 |
0 |
0 |
50 |
8.33 |
Z1 |
87.29 |
100 |
93.24 |
100 |
100 |
20.59 |
83.52 |
Z2 |
12.71 |
0 |
6.76 |
0 |
0 |
79.41 |
16.48 |
Source: Researcher (2018)
The values obtained from the Stability Test will then be used in the calculation of Function Value that will show the customer’s degree of demanding which can be seen in Figure 1.
Table 3
MUSA Method Calculations
Criteria |
Function Value |
Weight |
Average Satisfaction Indices |
Average Demanding Indices |
Average Improvement Indices |
Efficiency |
0% ; 98.90% ; 100% |
0 |
0.84 |
-0.98 |
0 |
Trust |
0% ; 94.00% ; 100% |
92.59 % |
0.95 |
-0.88 |
0.15 |
Reliability |
0% ; 98.90% ; 100% |
0 |
0.87 |
-0.98 |
0 |
Facility Automation |
0% ; 88.24% ; 100% |
0 |
0.91 |
-0.76 |
0 |
Citizen Support |
0% ; 94.42% ; 100% |
0 |
0.91 |
-0.89 |
0 |
Compensation |
0% ; 50.00% ; 100% |
7.41 % |
0.59 |
0.00 |
0.012 |
GLOBAL |
0% ; 83.52% ; 100% |
- |
0.82 |
-0.67 |
- |
Source: Researcher (2018)
Table 3 above shows the result of the calculation using MUSA Method, based on the logic that client’s global satisfaction of an individual customer depends on a set of n Criterion or variables representing service characteristic dimensions. For the weight, it shows the relative importance of the specific dimensions. It is important to know that these weights are value tradeoffs among the criteria. In this research Trust can be considered as the most important, which is why it is 92.59% and the second one is the Compensation, where the weight value is 7.41%.
Average Satisfaction Indices (ASI) indicates the performance of the assessed criterions. The best performing criterion is the Trust criterion with 0.95 and the lowest one is the Compensation with 0.59, but overall the criterions are doing well since at the end the Global Satisfaction is 0.82 which can be considered well (Grigoroudis & Siskos, 2010)
Average Demanding Indices (ADI), as shown in the name, indicates the level of demanding customers. All ADIs shows that all values are negative number, which means that the customers have minimum demanding level (Grigoroudis & Siskos, 2010), except for the Compensation criterion which shows that the customers are neutral, just like how we saw from the Function Value of the sixth criterion.
Average Improvement Indices (AII) shows the improvement margins of a criterion. It also indicates the effectiveness in the improvisation diagram, which means that it can show the degree of how the criterion successfully improves user satisfaction (Grigoroudis & Siskos, 2010). Trust and Compensation are valued 0.15 and 0.012, respectively, while the others are valued zero.
Based on the values in Table 3, the Function Value diagram can be drawn as follows:
Figure 1
Function Value
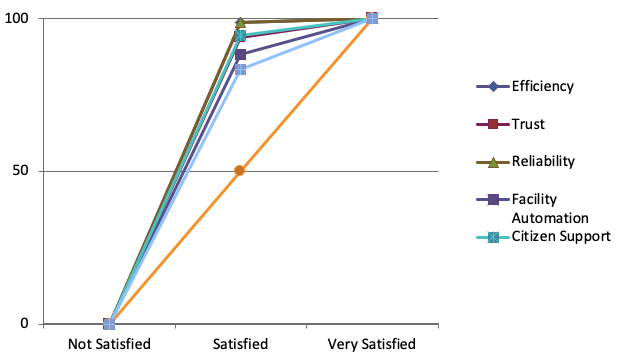
Source: Researcher (2018)
Figure 1 shows the customer’s degree of demanding, and as we can see above the customers or in this case the INSW users are mostly non-demanding, except for the Criterion Compensation where the users are neutral.
Figure 2
Improvement Diagram
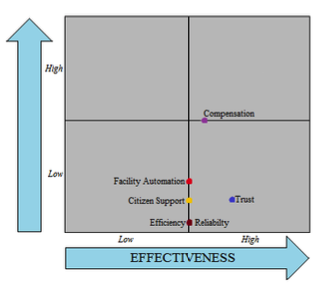
Source: Grigoroudis, E., & Siskos (2010)
This improvement diagram can indicate which dimensions should be improved. Based on Figure 2 above, all six criteria are in the “1st Priority” quadrant, meaning that this criterion still needs to be improved (Grigoroudis & Siskos, 2010) because they were given the smallest efforts, but they are highly effective. Except for the Trust criterion, all the other criteria are in-line between two quadrants. For compensation it is in line between the second and fourth quadrant, meaning that the level of demanding customers are actually in between (not high, not low) and it has slightly higher Effectiveness (Grigoroudis & Siskos, 2010) and the other four criteria which are Efficiency, Reliability, Citizen Support, and Facility Automation are in line between the third and fourth quadrant, which means that they are actually Low Demanding and Low Effectiveness (Grigoroudis & Siskos, 2010). So basically, the most important criterion to improve is the Trust criterion compared to the other criteria since it is the only one purely in the fourth quadrant or the “1st Priority” quadrantGrigoroudis & Siskos, 2010)
Figure 3
Action Diagram
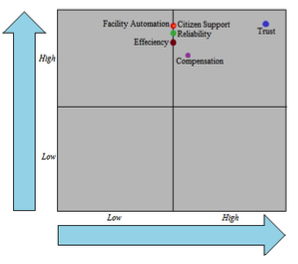
Source: Siskos, Y., & Grigoroudis (2010)
Based on Figure 3, all the criteria are gathered in the “Leverage Opportunity” quadrant where it means that the criteria involved have high performance and high importance level (Grigoroudis & Siskos, 2010). It usually means that these are the criteria that can be used as an advantage against competition and is usually the reason why customer’s purchase the product, but since we are talking about government services, these can also be taken as: these criteria can be used in pulling and inviting more business actors to use this website to push international engagement that could elevate our national economical state.
As a result of the data survey and analysis regarding user satisfaction of Indonesia National Single Window (INSW) web portal by using Multicriteria Satisfaction Analysis (MUSA) method, it can be concluded that:
In the first criterion that is Efficiency, the percentage of satisfaction index is 84% that indicates the INSW user is satisfied with how the INSW system is providing the newest and latest information related to the export and import documentation.
For the second criterion that is Trust, has the highest satisfaction index with 95% which means INSW user feel very satisfied with the security of the INSW web portal, and it also indicates that this criterion is considered important for the user to raise the satisfaction level of INSW user.
The third criterion is Reliability that has 87% of satisfaction index, which means the INSW web portal is considered reliable for the user to use in term of speed to upload data but there are still some errors while accessing the website.
The fourth criterion is Facility-Automation that has the second highest satisfaction index with 91% which means that the user of INSW web portal already feel satisfied with how the portal simplified the procedures in term of cost and time. It can be said that the INSW web portal help lessen the time taken for procedures in documentation and also the cost incurred.
The fifth criterion that is Citizen Support has the same percentage as the fourth criterion Facility-Automation that is 91% which means this criterion is also considered satisfied by the INSW user that they feel convenient to find a person in charge to file some questions regarding the INSW web portal.
The sixth criterion is Compensation that has the lowest percentage of satisfaction index with 59% compared to other criteria, that indicates the user feel not satisfied enough with the compensation that the user gain if a system failure occurs.
So, we can conclude that the user of INSW web portal is somehow satisfied with how the system is fulfilling its tasks. There are some Criteria that the users found perfect in doing its tasks and they feel very satisfied with how the system has performed, but also there are some Criteria that the users feel the system is still lack of something and need to be improved to be able to perform well and in accordance with the users’ expectation.
The result of global satisfaction in the Average Satisfaction Indices (ASI) is 82%, which means the overall of INSW web portal is already performing and fulfilling its tasks. The users also feel satisfied enough in using the INSW web portal even though the web portal can still use some more improvement for it to perform better, that later can help reach a higher level of satisfaction.
Based on the Improvement diagram, Trust and Compensation have the highest level of effectiveness compared to the other criteria. The improvement diagram is a result based on the user’s judgments, and it shows that the INSW users feel like Trust is considered the most important criterion for them to use the website, followed by Compensation, which means that it is necessary for INSW web portal to focus on improving the criterion Trust While for all the remaining criteria, it does not mean that they do not need to to raise the users’ satisfaction level. be improved, but by looking at the priority level, Trust is the only criterion that lays inside the first priority quadrant that makes it important to be improved first compared to the other criteria.
From the result of analysis and discussion above, hence the suggestion given by the writer to the INSW web portal system is as follow:
Criterion Efficiency needs to be improved in order to raise the level of user satisfaction. The researchers suggest for INSW to improve the system and make the navigation bar more simple and user-friendly to make it easier for INSW user to navigate through the website. Also, it is better if INSW web portal give the user more detailed information related to the progress of documentation.
Criterion Reliability needs to be improved in order to raise the level of user satisfaction. The researchers suggest having a regular checkups or updates for the system to be more improved and minimize the error that might occur anytime. It is considered important for user to use the website without lagging or error especially when the error occurs when the documents are being uploaded.
Criterion Facility-Automation needs to be improved in order to raise the level of user satisfaction. Based on what the result shown, the difference between the time taken and the cost incurred is so significant, that is why the researchers suggest focusing more on the time taken for documentation to be processed.
Criterion Citizen Support needs to be improved in order to raise the level of user satisfaction. The researchers suggest to make sure that the person in charge of customer/user service are always ready to answer the users’ questions with a fast respond and also the contact number in the website is easy to find so the user will not confused to use the website.
(ii) For further research, the researchers suggest to use more samples, as more samples means there are a lot more preference/opinions and judgments that would make the research to be more accurate and not biased. Also, it would be better if the samples are spread to the other regions of Indonesia or just focus on one Indonesia region, meaning that in the questionnaires spread there would be more accurate respondent profile with the geographical aspect added to it, since this research was only conducted with a small group of sample due to minimal networking of researcher with the people working in this industry. Researchers also suggest to use a wider satisfaction scaling to get an even more precise satisfaction level since due to lack of resources, researcher were only able to use a three-level Likert scale for this research. And last, since this type of research’s most time-taking aspect is in collecting of the respondents, so it would be best to spread the questionnaire as soon as posible.
Asean Single Window. (n.d.). Retrieved from Asean Single Window Portal website: http://asw.asean.org/
Badan Standardisasi Nasional. (n.d.). Retrieved from http://bsn.go.id/
Grigoroudis, E., & Siskos, Y. (2010). Customer Satisfaction Evaluation: Methods for Measuring and Implementating Service Quality. New York: Springer.
Indonesia National Single Window. (n.d.). Retrieved from Webstite Indonesia National Single Window website: https://www.insw.go.id/
Ismail, A. (2014). Quality Services Licensing Online Trading Systems INATRADE in.
Jurnal Maritim. (2017). Retrieved from https://jurnalmaritim.com/
Nurhaidah, M. I. (2015). Dampak Pengaruh Globalisasi Bagi Kehidupan Bangsa Indonesia. Jurnal Pesona Dasar, 3(3), 1–14.
Siskos, Y., & Grigoroudis, E. (2010). Measuring Customer Satisfaction for Various Service Using Multicriteria Analysis.
Surugiu, M. R., & Surugiu, C. (2015). International Trade, Globalization and Economic Interdependence between European Countries: Implications for Businesses and Marketing Framework. Procedia Economics and Finance, 32, 131–138.
Tsen, J. (2011). Ten Years of Single Window Implementation: Lesson learned for the Future. Global Trade Facilitation Conference 2011.
1. Management Department, BINUS Business School Undergraduate Program, Bina Nusantara University, Jakarta, Indonesia 11480 lsanny@binus.edu
2. International Business Management Program, Management Department, BINUS Business School Undergraduate Program, Bina Nusantara University, Jakarta, Indonesia 11480
3. Language Center, International Relations Department, Faculty of Humanities, Bina Nusantara University, Jakarta, Indonesia 11480