![]() ISSN 0798 1015
ISSN 0798 1015

![]() ISSN 0798 1015
ISSN 0798 1015
Vol. 40(Issue 43) Year 2019. Page 25
ELYAKOVA, Isabella D. 1; ELYAKOV, Alexandr L. 2; PAKHOMOV, Alexandr A. 3; OKHLOPKOV, Mikhail P. 4 & FEDOROVA, Ekaterina Y. 5
Received: 06/09/2019 • Approved: 17/12/2019 • Published 20/12/2019
ABSTRACT: As a result of the research work “Assessment, the main trends in the natural and socio-economic status, human potential of the Eastern Economic Zone of the Republic of Sakha (Yakutia)”, this article presents a comparative assessment of thermal energy production and consumption efficiency in the Western economic zone (WEZ) of the Republic of Sakha (Yakutia). Dynamics analysis of heat consumption over the past 5 years revealed that the indices of heat consumption in the WEZ are decreasing. This is due to the systemic absence problems of rational fuel and energy balance. The results of the study justify the rational directions of heat supply in the Western regions of Yakutia. |
RESUMEN: Como resultado del trabajo de investigación "Evaluación, las principales tendencias en el estado natural y socioeconómico, el potencial humano de la Zona Económica Oriental de la República de Sakha (Yakutia)", este artículo presenta una evaluación comparativa de la producción de energía térmica y eficiencia de consumo en la zona económica occidental (ZEO) de la República de Sakha (Yakutia). El análisis dinámico del consumo de calor en los últimos 5 años reveló que los índices de consumo de calor en las ZEO están disminuyendo. Esto se debe a los problemas de ausencia sistémica del equilibrio racional de combustible y energía. Los resultados del estudio justifican las direcciones racionales del suministro de calor en las regiones occidentales de Yakutia. |

In order to develop the Energy strategy of the Republic of Sakha (Yakutia) for the period up to 2050, it is necessary to form the conditions for the development of the fuel and energy sector of the Republic of Sakha (Yakutia), taking into account the development of non-traditional and renewable energy for the WEZ, which can have a significant impact on the economic, social and cultural processes in the Republic.
The analysis of production and consumption of fuel and energy resources, taking into account the development of renewable energy to compile a promising fuel and energy balance of the Republic of Sakha (Yakutia) has not been carried out yet.
In our study, the following analytical materials were used: Energy Strategy of the Republic of Sakha (Yakutia) for the period up to 2030 (Petrov, 2005), Scheme for the integrated development of productive forces, transport and energy of the Republic of Sakha (Yakutia) up to 2020 (The Scheme for Integrated Development, 2006 ), Fuel and energy balance of the Republic of Sakha (Yakutia) Part. 1 (Petrov , 2005), Scheme and program for the development of the electric power industry of the Republic of Sakha (Yakutia) for 2017-2021 (The Scheme and Program for the Development), General Layout of Power Facilities (General Plan for Energy Facilities, 2017), Annual Reports of PJSC Yakutskenergo for 2011-2016, Annual Reports of Sakhaenergo PJSC for 2011-2016, Official materials of the Ministry of Housing and Utilities of the Republic of Sakha (Yakutia), Official materials of the Ministry of Industry and Geology of the Republic of Sakha (Yakutia), Official materials of the State Committee for Price Policy of the Republic of Sakha (Yakutia), The Scheme and Program for the Development of the Energy Industry of the Republic of Sakha (Yakutia) for 2017-2021, The Russian Statistical Yearbook Rosstat data etc.
The object of the study is utilities and consumers of thermal energy in the WEZ.
The aim of the study is: to make an analysis of the heat supply problems in the context of WEZ areas; to give scientific credence of heat supply effective directions in the Western regions of Yakutia.
The problem of conditions for effective long-term energy supply is not new for studying the world economy. For example, the problem of the efficiency of electric heating and the development of renewable energy sources of energy were central to previous studies by Elyakova, Koryagin, Petrov et al. (Elyakova and Koryagina, 2015; Elyakova et al., 2016; Petrov et al., 2010).
The study used the following research methods: General scientific methods (systematic and historical method, method of analysis and synthesis); specific research methods (research method, problem-chronological method); theoretical methods with subsequent analysis and generalization of results (statistical, Supervisory and compare, balance and empirical methods).
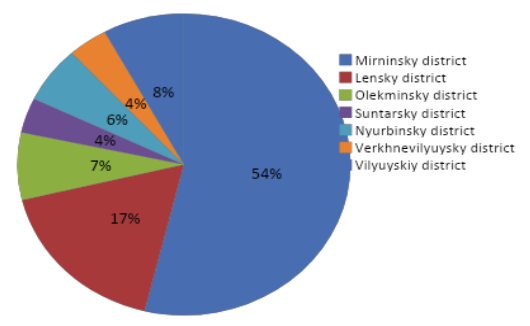
There are seven Western Republic districts in the Western economic zone of the Republic of Sakha (Yakutia), where the industrial hubs of Mirninsky and Lensky districts, groups of Viluysky agricultural areas and Olekminsky district are combined, they are: the Mirninsky, Lensky, Suntarsky, Nyurbinsky, Verkhnevilyuysky, Vilyuyskiy and Olekminsky districts.
Heat supply to consumers of the Western economic zone is carried out by 502 boiler houses which are powered by coal, natural gas, gas condensate, electricity, oil and wood. Diesel fuel is used as a backup fuel for gas boilers. The main share in the structure of heat production by boiler houses are: SUE “HCS of RS (Y)” (State Unitary Enterprise "Housing and Communal Services of The Republic of Sakha (Yakutia)", SK "ALROSA" (PJSC), JSC "Teploenergoservis", LLC «HCS of Vitim”, LLC “Teplostroykompleks". 3156 thousand Gcal of thermal energy were produced and 2460 thousand Gcal of thermal energy were consumed in 2017.
The thermal energy production in the WEZ amounted to 3156 thousand Gcal in 2017.
Heat supply of consumers is provided from 502 boiler houses. Boilers are powered by coal, natural gas, gas condensate, electricity, oil and wood. Diesel fuel is used as a backup fuel for gas boilers. There are also installed backup power supplies (DPPs).
The main share in the structure of heat production by boiler houses are: SUE “HCS of RS (Y)” (State Unitary Enterprise "Housing and Communal Services of The Republic of Sakha (Yakutia)", SC "ALROSA" (PJSC), JSC "Teploenergoservis", LLC «HCS of Vitim”, LLC “Teplostroykompleks". The structure of thermal energy production in 2017 is presented in table 1 and figure 1.
Table 1
Structure of thermal energy production in WEZ for 2017
Source of thermal energy |
Production of thermal energy, thousand Gcal |
Number of boilers |
Type of fuel |
Total in the Western Economic Zone |
3156 |
502 |
|
Mirninsky district |
1698 |
28 |
|
SC "ALROSA" (PJSC) |
1506 |
17 |
coal, oil fuel, natural gas, electricity, diesel fuel |
JSC "Teploenergoservis" |
166 |
8 |
natural gas, electricity |
Other sources of thermal energy |
27 |
3 |
oil fuel, electricity |
Lensky district |
549 |
37 |
|
LLC “Lenskoe” Lensky enterprise of thermal and electric networks |
276 |
8 |
coal, oil fuel, diesel fuel, natural gas |
JSC "Teploenergoservis" |
133 |
8 |
natural gas |
LLC «HCS of Vitim” |
53 |
6 |
oil fuel, diesel fuel |
LLC “Teplostroykompleks" |
47 |
2 |
oil fuel, diesel fuel |
Other sources of thermal energy |
40 |
13 |
coal, oil fuel, diesel fuel, natural gas wood |
Olekminsky district |
228 |
61 |
|
SUE “HCS of RS (Y)” |
152 |
22 |
coal, oil fuel, diesel fuel, wood |
Other sources of thermal energy |
76 |
39 |
coal, oil fuel, electricity, wood |
Suntarsky district |
119 |
58 |
|
SUE “HCS of RS (Y)” |
96 |
41 |
coal, oil fuel |
Other sources of thermal energy |
23 |
17 |
coal, oil fuel, natural gas liquids |
Nyurbinsky district |
191 |
183 |
|
SUE “HCS of RS (Y)” |
173 |
172 |
coal, oil fuel, diesel fuel |
Other sources of thermal energy |
18 |
11 |
coal, oil fuel, natural gas liquids |
Verkhnevilyuysky district |
122 |
62 |
|
SUE “HCS of RS (Y)” |
110 |
58 |
natural gas, natural gas liquids, coal, diesel fuel |
Other sources of thermal energy |
12 |
4 |
natural gas, coal, oil fuel, wood |
Vilyuyskiy district |
249 |
73 |
|
SUE “HCS of RS (Y)” |
171 |
53 |
natural gas, natural gas liquids, diesel fuel |
Other sources of thermal energy |
78 |
20 |
natural gas, diesel fuel |
Source: Compiled by the authors based on data of the State Committee for Price Policy
of the Republic of Sakha (Yakutia) (Official materials of the State Committee for Price Policy o
f the Republic of Sakha (Yakutia), 2018)
-----
Figure 1
Structure of thermal energy production by WEZ areas for 2017.
(Official materials of the State Committee for Price
Policy of the Republic of Sakha (Yakutia), 2018)
Beginning in 2007, according to the departmental target Program "Transfer the boiler houses, that are heated from of SUE “HCS of RS (Y)”, of social, residential and industrial facilities in Suntarsky and Nyurbinsky uluses (districts) of Sakha (Yakutia) to the electric heating for the period 2007-2012" and subsequent resolutions of the government of RS (Y) heat to residential Fund of the number of settlements in all seven districts of the Western economic zone of the Republic of Sakha (Yakutia) transferred to the electric heating. The population pays the tariff for electric heating on the tariffs for heating subsidized from the Republican budget [10].
The balance of production and consumption of thermal energy in the Western energy zone is made according to the tariff decisions of the State Committee for Price Policy of the Republic of Sakha (Yakutia) (table 2, figure 2).
Table 2
The production and consumption balance of thermal energy, thousand Gcal
Index |
years |
2017/ 2012 |
2017/ 2016 |
share |
|||||
2012 |
2013 |
2014 |
2015 |
2016 |
2017 |
% |
|||
Total in the Western energy zone |
|||||||||
Thermal energy production, total |
3328 |
3345 |
3312 |
3269 |
3211 |
3156 |
95 |
98 |
100 |
Net supply |
2710 |
2663 |
2636 |
2605 |
2550 |
2376 |
88 |
93 |
75 |
In-house needs of boilers |
75 |
86 |
84 |
81 |
78 |
76 |
101 |
97 |
2 |
Network losses |
543 |
595 |
591 |
583 |
583 |
704 |
130 |
121 |
22 |
Mirninsky district |
|||||||||
Thermal energy production, total |
1865 |
1874 |
1832 |
1777 |
1749 |
1698 |
91 |
97 |
100 |
Boilers, including: |
1546 |
1526 |
1486 |
1447 |
1406 |
1337 |
86 |
95 |
79 |
- SC "ALROSA" (PJSC) |
1393 |
1373 |
1350 |
1310 |
1277 |
1212 |
87 |
95 |
71 |
- JSC "Teploenergoservis" |
136 |
136 |
120 |
120 |
113 |
110 |
81 |
97 |
6 |
Other sources of thermal energy |
17 |
16 |
16 |
17 |
15 |
15 |
89 |
100 |
1 |
In-house needs of boilers |
37 |
46 |
45 |
44 |
44 |
43 |
115 |
97 |
3 |
Network losses |
283 |
302 |
301 |
287 |
299 |
319 |
113 |
107 |
19 |
Net supply |
1546 |
1526 |
1486 |
1447 |
1406 |
1337 |
86 |
95 |
79 |
Lensky district |
|||||||||
Thermal energy production, total |
570 |
561 |
554 |
560 |
552 |
549 |
96 |
99 |
100 |
Boilers, including: |
476 |
457 |
460 |
450 |
448 |
440 |
92 |
98 |
80 |
- LLC “Lenskoe” Lensky enterprise of thermal and electric networks |
236 |
221 |
224 |
220 |
230 |
225 |
95 |
98 |
41 |
- JSC "Teploenergoservis" |
108 |
108 |
107 |
104 |
107 |
102 |
95 |
96 |
19 |
- LLC «HCS of Vitim” |
29 |
29 |
45 |
45 |
41 |
41 |
142 |
100 |
7 |
- LLC “Teplostroykompleks". |
39 |
39 |
42 |
42 |
39 |
40 |
103 |
101 |
7 |
Other sources of thermal energy |
64 |
61 |
42 |
38 |
32 |
32 |
50 |
101 |
6 |
In-house needs of boilers |
16 |
16 |
15 |
15 |
12 |
12 |
74 |
99 |
2 |
Network losses |
79 |
88 |
79 |
96 |
93 |
98 |
124 |
106 |
18 |
Net supply |
476 |
457 |
460 |
450 |
448 |
440 |
92 |
98 |
80 |
Olekminsky district |
|||||||||
Thermal energy production, total |
201 |
201 |
203 |
222 |
219 |
228 |
113 |
104 |
100 |
Boilers, including: |
161 |
162 |
162 |
176 |
177 |
178 |
111 |
101 |
78 |
- SUE “HCS of RS (Y)” |
108 |
109 |
109 |
124 |
121 |
118 |
109 |
98 |
52 |
Other sources of thermal energy |
53 |
53 |
53 |
53 |
56 |
60 |
113 |
107 |
26 |
In-house needs of boilers |
5 |
6 |
6 |
7 |
7 |
7 |
121 |
91 |
3 |
Network losses |
35 |
34 |
36 |
39 |
35 |
43 |
125 |
126 |
19 |
Net supply |
161 |
162 |
162 |
176 |
177 |
178 |
111 |
101 |
78 |
Suntarsky district |
|||||||||
Thermal energy production, total |
120 |
129 |
135 |
137 |
127 |
119 |
99 |
94 |
100 |
Boilers, including: |
95 |
96 |
102 |
103 |
101 |
94 |
99 |
93 |
79 |
- SUE “HCS of RS (Y)” |
76 |
78 |
77 |
78 |
77 |
75 |
99 |
98 |
64 |
Other sources of thermal energy |
19 |
18 |
25 |
25 |
24 |
19 |
97 |
77 |
16 |
In-house needs of boilers |
4 |
5 |
5 |
5 |
4 |
4 |
89 |
92 |
3 |
Network losses |
20 |
28 |
29 |
29 |
21 |
21 |
101 |
98 |
17 |
Net supply |
95 |
96 |
102 |
103 |
101 |
94 |
99 |
93 |
79 |
|
2012 |
2013 |
2014 |
2015 |
2016 |
2017 |
|
|
% |
Nyurbinsky district |
|||||||||
Thermal energy production, total |
203 |
206 |
209 |
192 |
195 |
191 |
94 |
98 |
100 |
Boilers, including: |
154 |
152 |
155 |
155 |
150 |
145 |
95 |
97 |
76 |
- SUE “HCS of RS (Y)” |
135 |
134 |
139 |
140 |
135 |
130 |
96 |
96 |
68 |
Other sources of thermal energy |
18 |
18 |
16 |
15 |
15 |
15 |
83 |
103 |
8 |
In-house needs of boilers |
8 |
8 |
8 |
6 |
6 |
6 |
75 |
98 |
3 |
Network losses |
41 |
46 |
46 |
32 |
39 |
124 |
299 |
316 |
65 |
Net supply |
154 |
152 |
155 |
155 |
150 |
145 |
95 |
97 |
76 |
Verkhnevilyuysky district |
|||||||||
Thermal energy production, total |
121 |
122 |
123 |
126 |
123 |
122 |
101 |
99 |
100 |
Boilers, including: |
99 |
94 |
95 |
97 |
95 |
94 |
95 |
99 |
77 |
- SUE “HCS of RS (Y)” |
86 |
82 |
84 |
88 |
86 |
84 |
98 |
98 |
69 |
Other sources of thermal energy |
13 |
12 |
11 |
10 |
9 |
9 |
71 |
100 |
7 |
In-house needs of boilers |
2 |
2 |
2 |
2 |
2 |
2 |
101 |
99 |
2 |
Network losses |
20 |
26 |
26 |
26 |
26 |
26 |
133 |
101 |
22 |
Net supply |
248 |
251 |
256 |
255 |
247 |
249 |
101 |
101 |
204 |
Vilyuyskiy district |
|||||||||
Thermal energy production, total |
248 |
251 |
256 |
255 |
247 |
249 |
101 |
101 |
100 |
Boilers, including: |
180 |
176 |
178 |
177 |
173 |
173 |
96 |
100 |
69 |
- SUE “HCS of RS (Y)” |
101 |
105 |
110 |
111 |
109 |
111 |
110 |
102 |
45 |
Other sources of thermal energy |
79 |
71 |
68 |
66 |
64 |
62 |
78 |
96 |
25 |
In-house needs of boilers |
3 |
3 |
3 |
3 |
3 |
3 |
109 |
105 |
1 |
Network losses |
65 |
71 |
75 |
75 |
70 |
73 |
112 |
103 |
29 |
Net supply |
180 |
176 |
178 |
177 |
173 |
173 |
96 |
100 |
69 |
Source: Compiled by the authors based on data of the State Committee for Price Policy
of the Republic of Sakha (Yakutia) (Official materials of the State Committee for Price
Policy of the Republic of Sakha (Yakutia), 2018)
Figure 2
Balance of thermal energy production for 2012-2017.
(Official materials of the State Committee for Price
Policy of the Republic of Sakha (Yakutia), 2018)
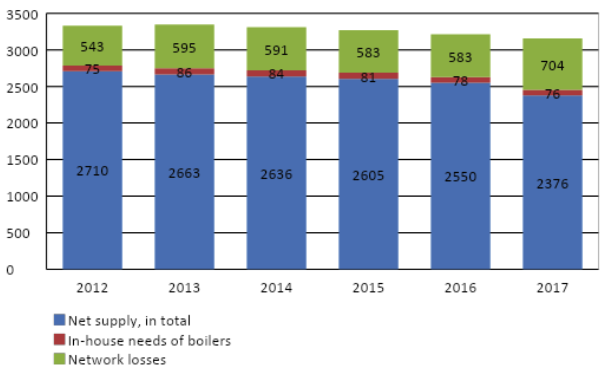
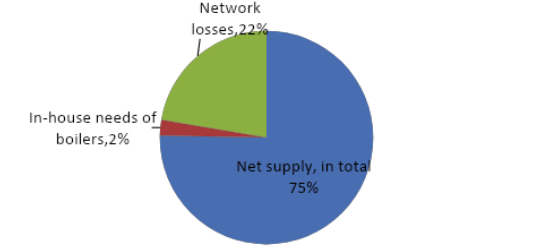
In the whole Western energy zone the production of thermal energy has decreased by 5% for the period from 2012 to 2017, and the supply was 75% in 2017 of the total production of thermal energy, losses in networks was 22%, and own needs of boiler - 3% (figure 3).
Figure 3
Structure of thermal energy production in the WEZ for 2017.
(Official materials of the State Committee for Price
Policy of the Republic of Sakha (Yakutia), 2018)
A comparative assessment of the use of different types of fuel for 2016 was made in the areas of the WEZ (table 3). The share of fuel costs at average tariff for the WEZ is 45%, for each district - from 24% to 59%. The highest proportion of fuel costs in Olekminsky district (59%) due to the high cost of oil and the cost of its delivery, and the lowest share in Verkhnevilyuysky and Vilyuisky regions due to the low cost of natural gas.
Table 3
Comparative assessment of fuel types use in the areas of WEZ for 2016
Mirninsky, Lensky, Suntarsky, Nyurbinsky,
Verkhnevilyuysky, Vilyuyskiy and Olekminsky districts.
Index |
Unit |
Total in the WEZ |
Mirninsky district |
Lensky district |
Olekminsky district |
Suntarsky district |
Nyurbinsky district |
Verkhnevilyuysky district |
Vilyuyskiy district |
Consumption of raw-materials (fuel) on types: |
|||||||||
Coal |
Thousand tons |
89 |
1,9 |
2,2 |
20 |
29 |
28 |
7,9 |
|
Oil fuel |
Thousand tons |
52 |
4,3 |
12 |
17 |
5,1 |
13 |
0,2 |
|
Diesel fuel |
Thousand tons |
1,2 |
0,1 |
0,9 |
0,003 |
|
0,04 |
0,004 |
0,2 |
Natural gas liquids |
Thousand tons |
6,1 |
|
|
|
0,1 |
0,8 |
1,1 |
4,2 |
Natural gas |
thousand cub. m |
274 |
171 |
59 |
|
|
|
12 |
32 |
Wood |
thousand cub. m |
26 |
|
6,3 |
20 |
|
|
0,3 |
|
Electricity |
Million kWh |
505 |
501 |
|
0,7 |
|
3,4 |
|
|
electric energy consumption on technology |
Million kWh |
123 |
66 |
20 |
8,2 |
5,8 |
9,4 |
4,4 |
9,1 |
Fuel costs in terms of transportation, including: |
Million rub. |
4833 |
2546 |
740 |
510 |
242 |
456 |
124 |
216 |
Fuel costs |
Million rub. |
4376 |
2528 |
715 |
393 |
151 |
302 |
93 |
195 |
Coal |
Million rub. |
282 |
4 |
10 |
84 |
66 |
88 |
29 |
|
Oil fuel |
Million rub. |
856 |
68 |
227 |
290 |
82 |
187 |
2 |
|
Diesel fuel |
Million rub. |
56 |
5 |
40 |
0,1 |
|
1 |
0,2 |
9 |
Natural gas liquids |
Million rub. |
95 |
|
|
|
2 |
13 |
16 |
63 |
Natural gas |
Million rub. |
1476 |
876 |
432 |
|
|
|
45 |
123 |
Wood |
Million rub. |
22 |
|
6 |
16 |
|
|
0,3 |
|
Electricity |
Million rub. |
1591 |
1575 |
|
3 |
|
13 |
|
|
Costs on fuel transportation |
Million rub. |
457 |
18 |
25 |
117 |
91 |
154 |
31 |
21 |
electric energy consumption on technology needs |
Million rub. |
393 |
204 |
65 |
28 |
20 |
31 |
14 |
30 |
Volume of revenue |
Million rub. |
10772 |
4868 |
1992 |
867 |
686 |
979 |
509 |
871 |
Net supply |
thousand Gcal |
2550 |
1406 |
448 |
177 |
101 |
150 |
95 |
173 |
Average tariff on thermal energy |
Thousand rubles / Gcal |
4,2 |
3,5 |
4,4 |
4,9 |
6,8 |
6,5 |
5,4 |
5,0 |
share of fuel costs at average tariff |
% |
45 |
52 |
37 |
59 |
35 |
47 |
24 |
25 |
Source: Compiled by the authors based on data of the State Committee for Price Policy of
the Republic of Sakha (Yakutia). (Official materials of the State Committee for Price Policy
o
f the Republic of Sakha (Yakutia), 2018)
In the field of price policy since July 1, 2016, the State Committee for Price and Policy of the Republic of Sakha (Yakutia) approves tariffs for thermal energy separately for each settlement. But for such large suppliers of thermal energy as SUE "Housing and Communal services of the Republic of Sakha (Yakutia)" and JSC "Teploenergoservis", economically reasonable rates are approved in the weighted average amount as a whole for the municipal district. (Table 4).
Table 4
Comparison of tariffs for thermal energy
for districts in the WEZ for 2016-2017
Settlement |
2012 |
2017 |
2017/2012 rate of growth |
||||||
Volume |
Revenue |
Tariff |
Volume |
Revenue |
Tariff |
Volume |
Revenue |
Tariff |
|
thousand Gcal |
million rubles. |
Rubles / Gcal |
thousand Gcal |
million rubles. |
Rubles / Gcal |
% |
% |
% |
|
Total in the WEZ |
2710 |
8871 |
3274 |
2460 |
11197 |
4551 |
91 |
126 |
139 |
Mirninsky district |
1546 |
5217 |
3375 |
1337 |
4947 |
3701 |
86 |
95 |
110 |
Lensky district |
476 |
1424 |
2993 |
440 |
2082 |
4735 |
92 |
146 |
158 |
Olekminsky district |
161 |
418 |
2601 |
178 |
955 |
5364 |
111 |
228 |
206 |
Suntarsky district |
95 |
370 |
3896 |
94 |
673 |
7166 |
99 |
182 |
184 |
Nyurbinsky district |
154 |
613 |
3991 |
145 |
1026 |
7062 |
95 |
167 |
177 |
Verkhnevilyuysky district |
99 |
319 |
3229 |
94 |
552 |
5905 |
95 |
173 |
183 |
Vilyuyskiy district |
180 |
509 |
2831 |
173 |
962 |
5561 |
96 |
189 |
196 |
Compiled by the authors based on data of the State Committee for Price Policy of the Republic of Sakha (Yakutia). (Official materials of the State Committee for Price Policy of the Republic of Sakha (Yakutia), 2018).
The growth of tariffs rate is due to the fact that heat consumption is reduced, and the prices affecting the volume of revenue are growing every year. The highest average tariff for thermal energy (7166 rubles/Gcal) is in the Suntarsky district due to the low growth of the useful output of thermal energy and the high rate of revenue growth. The lowest average rate in the Mirninsky district (3701 RUB/Gcal) due to the high consumption and low rate of revenue growth. In Olekminsky district, the growth rate of revenue is twice the growth rate of useful heat output.
Thermal energy consumption in the Western energy zone amounted to 2460 thousand Gcal in 2017, which is 4% lower than the previous year. Table 3.8.20 presents the dynamics of changes in heat consumption in the regions of WEZ for the period 2012-2017 (table 5).
Table 5
Dynamics of thermal energy consumption
by districts of WEZ, thousand Gcal
Index |
years |
2017/ 2012 |
2017/ 2016 |
share 2017 |
|||||
2012 |
2013 |
2014 |
2015 |
2016 |
2017 |
% |
% |
% |
|
Total in the districts of WEZ |
2710 |
2663 |
2637 |
2606 |
2550 |
2460 |
91 |
96 |
100 |
Mirninsky district |
1546 |
1526 |
1486 |
1447 |
1406 |
1337 |
86 |
95 |
54,3 |
Lensky district |
476 |
457 |
460 |
450 |
448 |
440 |
92 |
98 |
17,9 |
Olekminsky district |
161 |
162 |
162 |
176 |
177 |
178 |
111 |
101 |
7,2 |
Suntarsky district |
95 |
96 |
102 |
103 |
101 |
94 |
99 |
93 |
3,8 |
Nyurbinsky district |
154 |
152 |
155 |
155 |
150 |
145 |
95 |
97 |
5,9 |
Verkhnevilyuysky district |
99 |
94 |
95 |
97 |
95 |
94 |
95 |
99 |
3,8 |
Vilyuyskiy district |
180 |
176 |
178 |
177 |
173 |
173 |
96 |
100 |
7,0 |
Compiled by the authors based on data of the State Committee for Price Policy of the Republic
of Sakha (Yakutia). (Official materials of the State Committee for Price Policy
of the Republic of Sakha (Yakutia), 2018)
The analysis of dynamics of heat consumption for the last 5 years shows that indicators of heat consumption in General on ZEZ decrease.
In the Myrninsky district there is a significant decrease in heat consumption, in other areas the indices are reduced by no more than 10%. In Olekminsky district we can observe the increase. As the proportion of consumers of Mirninsky district is 54,3%, the change in their consumption significantly affect the dynamics of heat consumption in the whole WEZ, which decreased from 2012 by 9%.
Basically, the reduction in heat consumption is due to changes in the number of consumers and the actual shutdowns of heat supply facilities. Annual planned reduction of heat consumption due to the installation of metering devices also plays a role.
The dynamics of heat consumption for the main groups of consumers for the period 2012-2017 is presented in table 6. Reduction of heat consumption is observed in local, Federal budgets, other consumers and domestic consumption. On the contrary, the Republican budget and the population are growing.
High consumption of thermal energy in the Myrninsky and Lensky districts is due to the presence of large industrial consumers. In other areas, the main consumers are the population.
Table 6
Dynamics of heat consumption by main
groups of consumers in WEZ, thousand Gcal
Index |
years |
Complete growth |
Average growth rate, % |
Average growth rate from 2017 |
||||||||||||
2012 |
2013 |
2014 |
2015 |
2016 |
2017 |
2017/ 2012 |
% |
|||||||||
Total in western energy zone |
||||||||||||||||
Total net supply, including: |
2710 |
2663 |
2637 |
2606 |
2550 |
2460 |
-249 |
-10 |
100 |
|||||||
Population |
774 |
892 |
1299 |
1307 |
1296 |
1303 |
529 |
41 |
53 |
|||||||
Financing from the budget, including: |
479 |
469 |
476 |
467 |
449 |
430 |
-49 |
-11 |
17 |
|||||||
Local budget Institutions |
373 |
310 |
305 |
296 |
287 |
274 |
-99 |
-36 |
11 |
|||||||
Republican budget Institutions |
67 |
117 |
129 |
130 |
122 |
122 |
54 |
45 |
5 |
|||||||
Federal budget Institutions |
40 |
42 |
42 |
42 |
40 |
35 |
-5 |
-14 |
1 |
|||||||
Other consumers |
1190 |
914 |
509 |
682 |
666 |
620 |
-570 |
-92 |
25 |
|||||||
Internal consumption of organization |
266 |
389 |
354 |
150 |
138 |
108 |
-159 |
-147 |
4 |
|||||||
Mirninsky district |
||||||||||||||||
Total net supply, including: |
1546 |
1526 |
1486 |
1447 |
1406 |
1337 |
-209 |
-16 |
100 |
|||||||
Population |
176 |
299 |
689 |
685 |
670 |
671 |
495 |
74 |
50 |
|||||||
Financing from the budget, including: |
118 |
117 |
114 |
105 |
98 |
92 |
-25 |
-27 |
7 |
|||||||
Local budget Institutions |
76 |
55 |
49 |
40 |
39 |
37 |
-39 |
-103 |
3 |
|||||||
Republican budget Institutions |
27 |
48 |
50 |
50 |
46 |
43 |
16 |
37 |
3 |
|||||||
Federal budget Institutions |
14 |
15 |
15 |
14 |
13 |
12 |
-3 |
-21 |
1 |
|||||||
Other consumers |
1052 |
780 |
383 |
560 |
550 |
509 |
-543 |
-107 |
38 |
|||||||
Internal consumption of organization |
200 |
330 |
300 |
98 |
88 |
64 |
-136 |
-212 |
5 |
|||||||
Lensky district |
||||||||||||||||
Total net supply, including: |
476 |
457 |
460 |
450 |
448 |
440 |
-36 |
-8 |
100 |
|||||||
Population |
313 |
301 |
304 |
300 |
303 |
301 |
-12 |
-4 |
68 |
|||||||
Financing from the budget, including: |
53 |
48 |
52 |
54 |
55 |
53 |
-1 |
-1 |
12 |
|||||||
Local budget Institutions |
36 |
32 |
30 |
31 |
33 |
31 |
-4 |
-14 |
7 |
|||||||
Republican budget Institutions |
9 |
8 |
13 |
13 |
13 |
12 |
3 |
27 |
3 |
|||||||
Federal budget Institutions |
9 |
9 |
9 |
9 |
9 |
9 |
0 |
3 |
2 |
|||||||
Other consumers |
82 |
80 |
76 |
73 |
68 |
66 |
-17 |
-25 |
15 |
|||||||
Internal consumption of organization |
27 |
28 |
27 |
23 |
21 |
21 |
-7 |
-32 |
5 |
|||||||
Olekminsky district |
||||||||||||||||
Total net supply, including: |
161 |
162 |
162 |
176 |
177 |
178 |
17 |
10 |
100 |
|||||||
Population |
80 |
83 |
86 |
96 |
99 |
105 |
25 |
24 |
59 |
|||||||
Financing from the budget, including: |
54 |
54 |
54 |
53 |
49 |
50 |
-4 |
-8 |
28 |
|||||||
Local budget Institutions |
44 |
39 |
37 |
36 |
35 |
35 |
-9 |
-25 |
20 |
|||||||
Republican budget Institutions |
6 |
10 |
13 |
12 |
10 |
10 |
4 |
40 |
6 |
|||||||
Federal budget Institutions |
4 |
4 |
4 |
4 |
4 |
4 |
1 |
14 |
3 |
|||||||
Other consumers |
17 |
18 |
18 |
18 |
20 |
19 |
2 |
10 |
11 |
|||||||
Internal consumption of organization |
10 |
8 |
4 |
9 |
9 |
4 |
-6 |
-123 |
3 |
|||||||
Suntarsky district |
||||||||||||||||
Total net supply, including: |
95 |
96 |
102 |
103 |
101 |
94 |
-1 |
-1 |
100 |
|||||||
Population |
28 |
30 |
33 |
35 |
35 |
34 |
6 |
17 |
36 |
|||||||
Financing from the budget, including: |
59 |
59 |
60 |
60 |
59 |
55 |
-4 |
-7 |
59 |
|||||||
Local budget Institutions |
51 |
44 |
45 |
45 |
44 |
43 |
-8 |
-18 |
46 |
|||||||
Republican budget Institutions |
3 |
10 |
10 |
10 |
9 |
11 |
8 |
72 |
12 |
|||||||
Federal budget Institutions |
5 |
5 |
5 |
5 |
5 |
1 |
-4 |
-295 |
1 |
|||||||
Other consumers |
3 |
3 |
4 |
6 |
6 |
3 |
0 |
-2 |
3 |
|||||||
Internal consumption of organization |
5 |
5 |
5 |
2 |
2 |
2 |
-3 |
-216 |
2 |
|||||||
Nyurbinsky district |
||||||||||||||||
Total net supply, including: |
154 |
152 |
155 |
155 |
150 |
145 |
-8 |
-6 |
100 |
|||||||
Population |
66 |
69 |
71 |
72 |
70 |
72 |
6 |
8 |
49 |
|||||||
Financing from the budget, including: |
67 |
64 |
65 |
65 |
63 |
57 |
-10 |
-17 |
39 |
|||||||
Local budget Institutions |
59 |
48 |
49 |
48 |
46 |
40 |
-19 |
-47 |
28 |
|||||||
Republican budget Institutions |
6 |
13 |
14 |
14 |
14 |
14 |
9 |
60 |
10 |
|||||||
Federal budget Institutions |
2 |
3 |
3 |
3 |
3 |
3 |
0 |
14 |
2 |
|||||||
Other consumers |
13 |
15 |
14 |
14 |
13 |
13 |
0 |
-1 |
9 |
|||||||
Internal consumption of organization |
8 |
5 |
4 |
4 |
4 |
4 |
-4 |
-103 |
3 |
|||||||
Verkhnevilyuysky district |
||||||||||||||||
Total net supply, including: |
99 |
94 |
95 |
97 |
95 |
94 |
-5 |
-6 |
100 |
|||||||
Population |
27 |
27 |
28 |
29 |
28 |
28 |
2 |
5 |
30 |
|||||||
Financing from the budget, including: |
58 |
59 |
60 |
62 |
60 |
59 |
1 |
1 |
63 |
|||||||
Local budget Institutions |
50 |
42 |
44 |
44 |
42 |
40 |
-10 |
-24 |
43 |
|||||||
Republican budget Institutions |
6 |
13 |
13 |
14 |
14 |
15 |
10 |
64 |
16 |
|||||||
Federal budget Institutions |
3 |
3 |
3 |
4 |
3 |
3 |
1 |
18 |
3 |
|||||||
Other consumers |
9 |
4 |
4 |
3 |
4 |
4 |
-5 |
-151 |
4 |
|||||||
Internal consumption of organization |
5 |
3 |
3 |
3 |
3 |
3 |
-2 |
-85 |
3 |
|||||||
Vilyuyskiy district |
||||||||||||||||
Total net supply, including: |
180 |
176 |
178 |
177 |
173 |
173 |
-7 |
-4 |
100 |
|||||||
Population |
85 |
84 |
87 |
90 |
90 |
92 |
8 |
8 |
53 |
|||||||
Financing from the budget, including: |
70 |
67 |
70 |
69 |
65 |
64 |
-6 |
-10 |
37 |
|||||||
Local budget Institutions |
57 |
50 |
51 |
51 |
47 |
46 |
-11 |
-24 |
27 |
|||||||
Republican budget Institutions |
10 |
15 |
16 |
16 |
15 |
15 |
4 |
30 |
9 |
|||||||
Federal budget Institutions |
2 |
3 |
3 |
2 |
2 |
2 |
0 |
0 |
1 |
|||||||
Other consumers |
14 |
14 |
10 |
7 |
7 |
7 |
-7 |
-104 |
4 |
|||||||
Internal consumption of organization |
11 |
11 |
11 |
11 |
10 |
10 |
-1 |
-9 |
6 |
|||||||
(Official materials of the State Committee for Price Policy of the Republic of Sakha (Yakutia), 2018).
In Mirninsky district there was a transfer of housing stock of SC "ALROSA" to municipalities, in connection with their heat consumption has passed from the group of other consumers to the population. Figure 4 shows the structure of thermal energy consumption in general for the WEZ for 2012 and 2017.
The largest share in the structure of heat consumption in 2017 is occupied by the population, it amounted to 53%, the share of local budget institutions-11%, the Republican and Federal budgets-5% and 2%, respectively, the share of other types of consumers – 25%. In 2012, the share of the population was 29%, institutions of the local budget-14%, national and Federal budgets-2% and 1%, respectively, other types of consumers – 44%. The share of internal consumption of the enterprise decreased from 10% in 2012 to 4% in 2017.
The problems of heat supply are revealed and a rational direction of heat supply of the Western districts of Yakutia is suggested on the basis of this research.
The main system problems of reliable heat supply in the FEZ are:
- high degree of the thermal networks wear that can lead to actual losses of thermal energy and untimely decision of modernization and renewal of legal organizational form.
- high share of transportation costs and seasonal nature of fuel transportation for boilers due to short navigation times;
- suboptimal structure of the fuel balance, leading to significant costs for the operation of boilers on organic fuel.
- exhaustibility of organic fuel, high cost of thermal energy and hydrocarbon fuel, high costs of gas and oil transportation and coal transportation;
- combustion of fossil fuels is the main source of electricity and heat, and their intensive use leads to air pollution due to acid precipitation;
- the increase in carbon dioxide in the atmosphere forms a "greenhouse effect" that affects global warming on the planet, primarily in the Arctic ocean through melting ice and rising ocean levels;
- absence of energy budget in the WEZ, including the districts, in the context of settlements. Preparation of energy budget in the whole Republic of Sakha (Yakutia) only in physical terms produced and used fuel and energy resources;
- insufficient financing and underfunding of investment projects for the development of utilities and energy-saving technologies,
- the absence of a single coordinating and controlling body of the Executive power in the Republic of Sakha (Yakutia) for the preparation of energy balance, including the areas of the WEZ.
In connection accounting the above problems, it is necessary to consider the rational direction of heat supply in the Western districts of Yakutia:
- development of "Programme of transfer the consumers in the Western energy districts of Sakha (Yakutia) to electric heating for the period up to 2030", including the mechanisms and efficiency of transferring to electric heating in each settlement of West energy districts, well-grounded calculations and interconnected with the local budgets for the provision of funds, as well as lead to saving the expenditure side of budgets;
- in the short term, an increase in the share of electric heating. To produce thermal energy at powerful electric boilers of SDPP, due to its efficiency in comparison with boiler houses, working on coal, gas, oil, etc., which will save exhausted organic fuel such as coal, crude oil, natural gas, gas condensate;
- maximum transfer the private residential sector for electrical heating, which uses firewood;
- the use of solar energy as a source of both heat and electricity. The use of solar heat is the easiest and cheapest way to solve individual energy problems. Solar heat capture is realized through the use of collectors. These are very simple devices for capturing, accumulating and retaining heat.
Annual reports of PJSC "Yakutskenergo" for 2011 -2016
Chen, W., Liang, S.Q. & Guo, Y.X. (2013). Investigation on the thermal performance and optimization of a heat pump water heater assisted by shower waste water. Energy Build. 64, 172–181
Elyakova, I.D. (2015). Organizational and Economic Mechanisms for Ensuring the Electric Power Safety of the Republic of Sakha (Yakutia). Yakutsk: publishing house of NEFU, 2015. – 318 p
Elyakova I.D., Koryagina J.N. (2015). Efficiency of electric heating in the Western districts of Yakutia /Min. of education and science of the Russian Federation; NEFU; The Yakut Scientific Centre of the Siberian Branch of the Russian Academy of Sciences; [under the scientific editing by doctor of Economics, Professor A. A. Pakhomov.]. - Yakutsk: NEFU Publisher, – 176 p.
Elyakova, I.D., Pakhomov, A.A., Poiseyev, I.I., Yefremov, E.I., Darbasov, V.R., Noyeva, E.Y., Khristoforov, A.A., Elyakov, A.L. (2016). Prospects for development of renewable energy sources to preserve the ecosystem of arctic zone of Russia. Indian Journal of Science and Technology, 9(46),1-9
Energy strategy of the Republic of Sakha (Yakutia) for the period up to 2030. (2010) / ed. by N. A. Petrov, B. G. Saneev, G. F. Alekseev, etc.; government of the Rep. of Sakha (Yakutia.) - Yakutsk; Irkutsk: media holding "Yakutia", etc.; – 328 p.
Official materials of the Ministry of Housing and Utilities of the Republic of Sakha (Yakutia), 2018.
Official materials of the Ministry of Industry and Geology of the Republic of Sakha (Yakutia), 2018.
Official materials of the State Committee for Price Policy of the Republic of Sakha (Yakutia), 2018.
Petrov, N.A. (2005). The fuel and energy balance of the Republic of Sakha (Yakutia). Part. 1. V.P. Larionov’s Institute of Physical-Technical Problems of the North SB RAS. Yakutsk: Sakhapoligrafizdat.
Rink R.E. (1994). Optimal operation of solar heat-storage with off-peak energy price incentive, Optim. Control Appl. Met. 15 251–266.
Spitler J.D. (2005). Ground-source heat pump system research – past, present, and future, HVAC & R Res. 11 165–167.
The General Layout of Power Facilities Up to 2035. (2017), (Approved by the Order of the Government of the Russian Federation No. 1209.
The Scheme and Program for the Development of the Energy Industry of the Republic of Sakha (Yakutia) for 2017-2021 (Approved by the Decree of the Head of the Republic of Sakha (Yakutia) No. 1908 of May 9, 2017).
The Scheme for Integrated Development of Productive Forces (2016), Transport and Energy of the Republic of Sakha (Yakutia) up to 2020. Moscow: Yakutsk., 2006.
The Russian Statistical Yearbook Rosstat. (2016). Moscow. p.725. Available from: http://www.gks.ru/bgd/regl/b16_13.
1. Institute of Finances and Economics, M.K. Ammosov North-Eastern Federal University, Yakutsk, Russian Federation, elyak@list.ru
2. Institute of Finances and Economics, M.K. Ammosov North-Eastern Federal University, Yakutsk, Russian Federation, elyakov96@mail.r
3. Department of Regional Economic and Social Research, Federal Research Centre “The Yakut Scientific Centre of the Siberian Branch of the Russian Academy of Sciences, Yakutsk, Russian Federation, a.a.pakhomov@prez.ysn.ru
4. Department of Regional Economic and Social Research, Federal Research Centre “The Yakut Scientific Centre of the Siberian Branch of the Russian Academy of Sciences, Yakutsk, Russian Federation mikhail.okhlopkov2017@yandex.ru
5. Department of Regional Economic and Social Research, Federal Research Centre “The Yakut Scientific Centre of the Siberian Branch of the Russian Academy of Sciences, Yakutsk, Russian Federation, fedorova_ey@rambler.ru
[Index]
revistaESPACIOS.com

This work is under a Creative Commons Attribution-
NonCommercial 4.0 International License