![]() ISSN 0798 1015
ISSN 0798 1015

![]() ISSN 0798 1015
ISSN 0798 1015
Vol. 41 (Issue 03) Year 2020. Page 20
SHAVINA, Evgeniya V. 1; MOISEEV, Nikita A. 2; DOTSENKO, Elena Y. 3 & SIVKOVA, Anna E. 4
Received: 24/09/2019 • Approved: 11/01/2020 • Published 06/02/2020
ABSTRACT: Given the inconsistent location of productive forces across regions, spatial development strategies gain relevance in Russia. Assessing the innovative potential of regions is crucial to economic modernization. The study measures the innovation level of regions using a method offered by the authors. The innovation strength ranking is based on data as of 2017. To measure the innovation heterogeneity potential, a cluster analysis is conducted using the principal components method. Findings show that most regions overspend on R&D, with low ROI rates. Authors suggest redistributing productive forces (reducing/boosting R&D spending) to improve regional efficiency and interaction, to ensure sustainable balanced development. |
RESUMEN: Dada la ubicación inconsistente de las fuerzas productivas entre regiones, las estrategias de desarrollo espacial adquieren relevancia en Rusia. La evaluación del potencial innovador de las regiones es crucial para la modernización económica. El estudio mide el nivel de innovación de las regiones utilizando un método ofrecido por los autores. El ranking de fuerza de innovación se basa en datos de 2017. Para medir el potencial de heterogeneidad de la innovación, se lleva a cabo un análisis de conglomerados utilizando el método de los componentes principales. Los resultados muestran que la mayoría de las regiones gastan más de lo debido en I+D, con bajos índices de rendimiento de la inversión. Los autores sugieren redistribuir las fuerzas productivas (reducir/impulsar el gasto en I+D) para mejorar la eficiencia y la interacción regional, a fin de garantizar un desarrollo sostenible y equilibrado. |

Every year the importance of innovative development of economy increases. The government approaches this issue quite thoroughly and carefully seeks the ways to establish the most effective innovation space in the country. This is due to the fact that in modern conditions the state of the national economy is increasingly determined by the economic potential of the regions, their innovativeness and ability to modernize.
The achievement of this objective is contributed by the solution of the following tasks:
The integral assessment of innovative development degree of the regions of the state is a widely discussed topic in the scientific literature. Many works are devoted to the development of indices of innovative development of a region, its calculation and analysis of received trends, see works (Roman, 2010; Abbasi et al., 2011; Chen & Guan, 2012; Foddi & Usai, 2013; Liu et al., 2014; Han et al., 2016; Broekel et al., 2018). The most widespread methods of formation of innovative development integrated indicator are DEA (Kotsemir, 2013; Valdez Lafarga and Balderrama, 2015; Yang, etc., 2016; Guan & Zuo, 2017) and weighed average of rated indicators (Sharma & Thomas, 2008; Fritsch & Slavtchev, 2011; Baburin & Zemtsov, 2014; Kou, etc., 2016). In this study the authors propose their own innovation index of еру regions, based on weighted average of normalized indicators and a complex group of indicators.
The aim of the study is to assess the innovative potential of the regions in Russia and to develop proposals for redistribution of productive forces, in particular the expenditures for scientific research and development among the regions of Russia for the balanced innovative development of the country as a whole.
The study was based on popular scientific methods of analysis, synthesis, abstraction, as well as statistical grouping and graphical methods. Special methods of statistical analysis, research of generalizing characteristics of aggregates, regression and dispersion analysis, econometric modeling, methods of mathematical statistics were also used in the work, which ensures reliability and reasoning of the obtained results. The database on innovative indicators of the Russian regions was used.
In order to assess the innovativeness degree of the subjects of the Russian Federation, the authors compiled an integral normalized indicator of their innovative potential. The following key figures were selected as a part of it:
The share of innovative goods, works, services in total number of shipped goods of own production, performed works and services by own efforts, %.
The number of developed advanced production technologies per 1 billion rubles of internal research and development costs, units.
The number of developed advanced production technologies per researcher engaged in research and development, units.
The number of advanced manufacturing technologies used per researcher engaged in research and development, units.
The innovative activity of organizations (the share of organizations that implement technological, organizational, marketing innovations in the reporting year, in the total number of surveyed organizations), %
For the purpose of preliminary visual analysis of the initial data, "box" diagrams of regions distribution according to the selected innovation indicators are given (see Figure 1).
Figure 1
"Box" diagrams of initial data for calculation of integral
strength indicator of innovative potential of the region
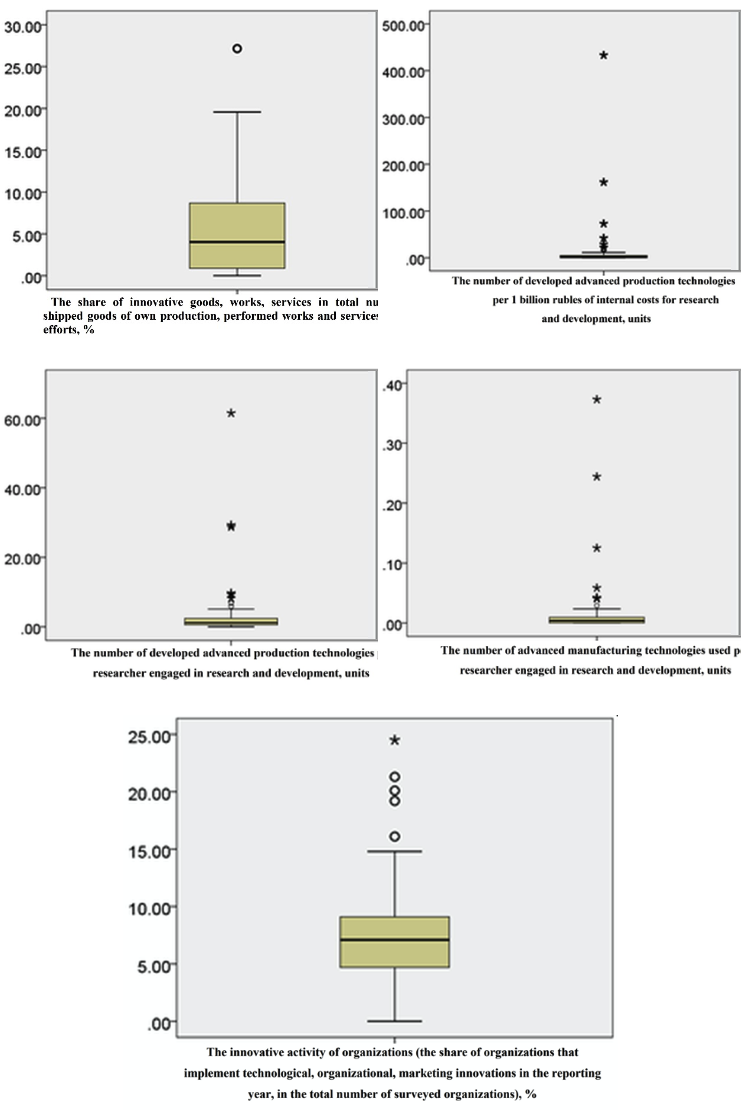
As shown in Figure 1, all presented frequency distributions have positive asymmetry. This asymmetry is particularly marked for indicators of the number of advanced innovative technologies developed and used per researcher and 1 billion rubles of research and development costs.
Thus, for each indicator of innovativeness degree, a small number of clear leaders can be observed, far exceeding the rest regions.
On the basis of the obtained integral innovativeness indicator, a rating of the regions based on the innovative potential strength was formed according to the results of 2017 (see Table 1).
Table 1
Rating of the subjects of the Russian Federation
by the innovative potential strength
The place in rating |
The subject of the Russian Federation |
Integral figure value |
1 |
Yamalo-Nenets Autonomous Area |
53.885 |
2 |
Republic of Kalmykia |
35.260 |
3 |
Republic of Mordovia |
33.787 |
4 |
Republic of Tatarstan |
32.958 |
5 |
Chuvash Republic |
30.632 |
6 |
Lipetsk region |
27.329 |
7 |
Bryansk region |
24.674 |
8 |
Moscow |
23.354 |
9 |
Nizhny Novgorod Region |
23.056 |
10 |
Tyumen region (without Autonomous Area) |
22.568 |
11 |
Penza region |
22.323 |
12 |
Udmurt Republic |
21.457 |
13 |
Kostroma region |
21.001 |
14 |
Belgorod region |
20.821 |
15 |
Moscow region |
18.953 |
16 |
St. Petersburg |
18.821 |
17 |
Perm Krai |
18.634 |
18 |
Khabarovsk Krai |
18.601 |
19 |
Rostov region |
18.023 |
20 |
Yaroslavl region |
17.942 |
21 |
Tula region |
17.578 |
22 |
Samara region |
17.143 |
23 |
Republic of Mari El |
16.336 |
24 |
Chukotka Autonomous Area |
15.902 |
25 |
Nenets Autonomous Area |
15.668 |
26 |
Ryazan region |
15.321 |
27 |
Sverdlovsk region |
14.843 |
28 |
Voronezh region |
14.436 |
29 |
Vladimir region |
14.124 |
30 |
Altai Krai |
14.003 |
31 |
Krasnodar Krai |
13.854 |
32 |
Kirov region |
13.754 |
33 |
Novosibirsk region |
13.632 |
34 |
Tomsk region |
13.394 |
35 |
Tambov region |
13.246 |
36 |
Ulyanovsk region |
13.234 |
37 |
Republic of Bashkortostan |
13.168 |
38 |
Astrakhan Region |
12.951 |
39 |
Vologda Region |
12.678 |
40 |
Sevastopol |
12.356 |
41 |
Novgorod Region |
12.302 |
42 |
Kamchatka Krai |
11.569 |
43 |
Republic of Adygea |
11.424 |
44 |
Pskov region |
11.341 |
45 |
Kursk region |
11.282 |
46 |
Stavropol Krai |
11.205 |
47 |
Tver region |
11.163 |
48 |
Magadan region |
10.683 |
49 |
Zabaykalsky Krai |
10.553 |
50 |
Kaluga region |
9.878 |
51 |
Chelyabinsk region |
9.845 |
52 |
Smolensk region |
9.803 |
53 |
Krasnoyarsk Krai |
9.624 |
54 |
Orenburg region |
9.278 |
55 |
Sakha Republic (Yakutia) |
9.184 |
56 |
Leningrad Region |
9.122 |
57 |
Omsk region |
8.981 |
58 |
Ivanovo region |
8.376 |
59 |
Oryol region |
8.243 |
60 |
Saratov region |
7.889 |
61 |
Republic of Buryatia |
7.721 |
62 |
Republic of Karelia |
7.446 |
63 |
Murmansk region |
7.312 |
64 |
Kurgan region |
6.945 |
65 |
Volgograd region |
6.584 |
66 |
Arkhangelsk region (without Autonomous Area) |
6.312 |
67 |
Amur region |
6.287 |
68 |
Khanty-Mansi Autonomous Area - Ugra |
5.919 |
69 |
Komi Republic |
5.753 |
70 |
Kemerovo region |
5.728 |
71 |
Republic of Altai |
5.721 |
72 |
Irkutsk region |
5.673 |
73 |
Jewish Autonomous Region |
5.668 |
74 |
Kaliningrad region |
4.691 |
75 |
Sakhalin region |
4.343 |
76 |
Primorsky Krai |
4.085 |
77 |
Republic of North Ossetia - Alania |
3.963 |
78 |
Kabardino-Balkar Republic |
3.323 |
79 |
Republic of Crimea |
3.168 |
80 |
Republic of Dagestan |
2.987 |
81 |
Republic of Khakassia |
2.366 |
82 |
Republic of Tyva |
2.223 |
83 |
Chechen Republic |
1.359 |
84 |
Karachay-Cherkess Republic |
0.861 |
85 |
Republic of Ingushetia |
0.677 |
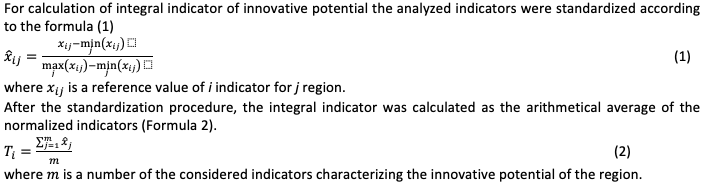
To visualize the information shown in Table 1, let us give a frequency histogram of the regions by the innovative potential strength (see Figure 2). The presented distribution is expected to have marked positive asymmetry. There is an unconditional leader represented by the Yamalo-Nenets Autonomous Area, with a large distance ahead of the nearest pursuers. Among the advanced regions in terms of the innovative potential strength there are also such regions as the Republic of Kalmykia, the Republic of Mordovia, the Republic of Tatarstan, the Chuvash Republic, the Lipets region, the Bryansk region, Moscow, the Nizhny Novgorod region, the Tyumen region (without Autonomous Area), the Penza region, the Udmurt Republic, the Kostroma region, Moscow. Among the outsiders in innovation we can consider such regions as the Republic of Ingushetia, the Republic of Karachai-Cherssy, the Chechen Republic, the Republic of Tyva, the Republic of Khakassia, the Republic of Dagestan, the Republic of Crimea, the Kabardino-Balkan Republic, the Republic of North Ossetia-Alania, Primorsky Krai, the Sakhalin region, Jewish Autonomous Region, the Irkutsk Region, the Republic of Altai and the Kemerovo Region.
Figure 2
The frequency distribution of the subjects of the Russian
Federation by the innovative potential strength
In order to analyze the internal factors of innovative development of the regions, a database of statistical indicators related to the innovative development for the period 2010-2017 was compiled. The data were taken from the website of the Federal Service of State Statistics of the Russian Federation. According to the data collected, the following set of key indicators of the innovative development degree was formed for each region (see Table 2).
Table 2
The list of innovativeness indicators of the region
A variable code |
Interpretation of an indicator |
VAR1 |
The share of innovative goods, works, services in the total number of shipped goods of own production, performed works and services by own efforts, % |
VAR2 |
The number of developed advanced production technologies per 1 billion rubles of internal costs for scientific research and development, units. |
VAR3 |
The number of advanced production technologies used per researcher engaged in research and development, units. |
VAR4 |
The number of advanced production technologies developed per researcher engaged in research and development, units. |
VAR5 |
The share of internal research and development costs in the total number of own production goods shipped, performed works and services by own efforts, % |
VAR6 |
The share of organizations implementing technological innovations in the reporting year, in total number of surveyed organizations, % |
VAR7 |
The share of technological innovation costs in the total volume of goods shipped, performed works, services, % |
VAR8 |
The share of organizations that implemented marketing innovations in the reporting year in the total number of surveyed organizations, % |
VAR9 |
The share of organizations that implemented organizational innovations in the reporting year, in total number of surveyed organizations, % |
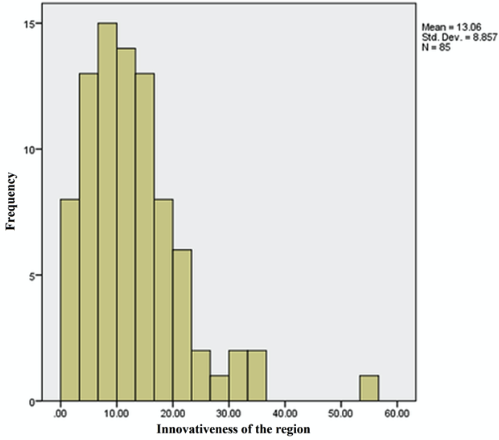
In order to identify the potential heterogeneity of the innovative state of considered subjects, we will carry out a cluster analysis of the regions of the Russian Federation using the method of the main components. Figure 3 shows the eigenvalues of the correlation matrix of analyzed indicators. As it can be seen from this figure, the eigenvalues for the first two main components are significantly greater than one, while the remaining components have eigenvalue below one. Hence it can be concluded that the first two main components explain a significant share of dispersion of the values of considered variables from their averages.
Figure 3
The dynamics of eigenvalues
by main component number
Thus, by showing the values for the first two principal components on a two-dimensional plane (see Figure 4) a cluster analysis can be performed graphically. As it can be seen from Figure 4, the apparent "outbreak" is the Yamalo-Nenets Autonomous Area, which is also confirmed by the above rating of the innovative potential strength of the regions. In addition, the Republic of Kalmykia, the Nenets Autonomous Area, the Chuvash Republic and the Republic of Tatarstan behave quite different from the main mass of regions, and the last two subjects can theoretically be combined into one cluster. The remaining regions, which make up the absolute majority, can be classified as similar in their innovativeness characteristics and combined into one massive cluster (Shavina et al., 2019).
Figure 4
Cluster analysis of the regions of the Russian
Federation by the method of main components
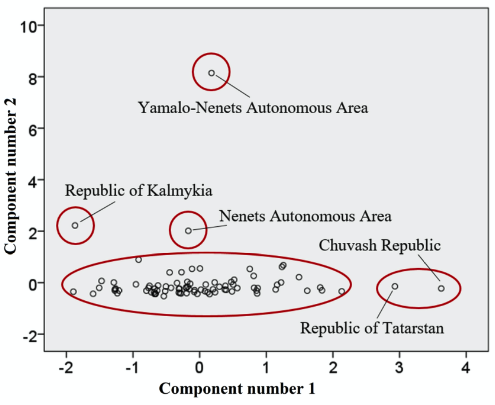
It follows from the graphical cluster analysis that the main part of the subjects of the Russian Federation is quite homogeneous in terms of the values of selected indicators of innovative development except some regions. As a result, we can conclude that further analysis of the given spatial data on innovative development of the regions and related conclusions can be considered correct and suitable for making recommendations on redistribution of productive forces in order to increase the efficiency of functioning and interaction of the regions of the Russian Federation and ensure sustainable and balanced innovative development.
Let us look at the relationship between the ratio of internal research and development costs and the number of advanced production technologies developed per researcher. Figure 6 shows the scattering diagram for these two variables.
Figure 5
The dependence of the ratio of research and development
costs and the effectiveness of researchers for 2017
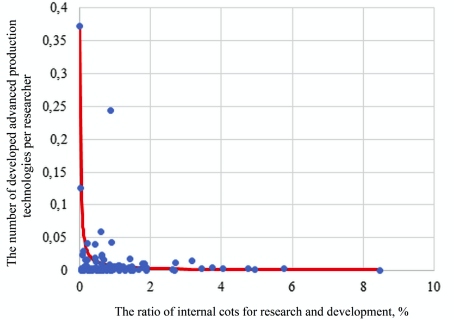
From Figure 5, it can be seen that the dependence of the variables can be approximated quite well by a hyperbolic-type function. Thus, it can be concluded that the greater the ratio of research and development costs in the region, the lower the average efficiency of working researchers.
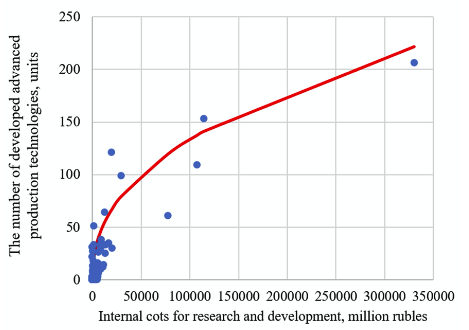
Indeed, if we depict a dissipation diagram for the indicator of internal research and development costs and the indicator of the number of advanced production technologies developed (Figure 6), one can see a characteristic production function with a monotonically decreasing marginal utility of costs.
Figure 6
The dependence of research and development costs
and the number of developed technologies for 2017
Next, we turn to the relationship between the internal costs of research and development and the number of researchers (Figure 7). As it can be seen, these indicators are linked by an almost strict linear relationship, which means that for each additional researcher there is a certain constant amount of money in spatial terms. In this case, judging by the obtained coefficients of pair linear regression the costs of scientific research increased with each additional researcher by about 2.7 million rubles per year.
Figure 7
The dependence of research and development
costs and the number of researchers for 2017
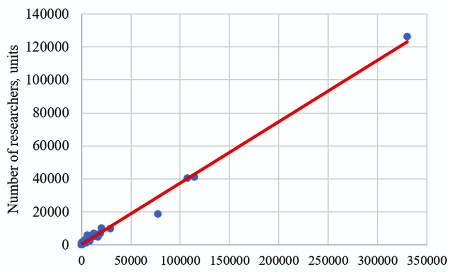
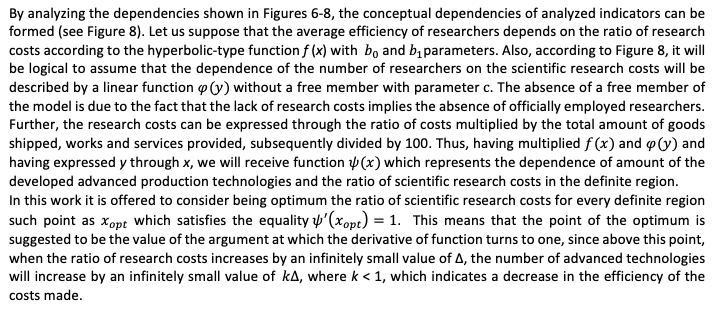
Figure 8
The dependence of the share of innovative goods and services and the
share of organizations implementing technological innovations in 2017
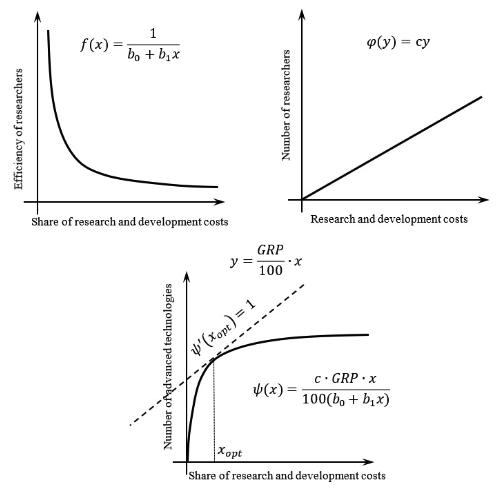
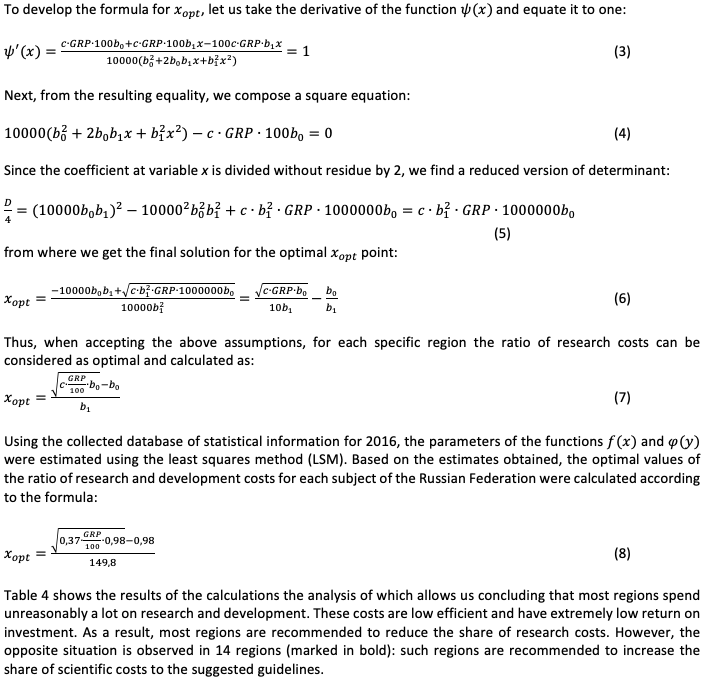
Table 4
The recommendations on changing the level of scientific research
and development costs by the regions of the Russian Federation
the subject of the Russian Federation |
current share of research and development costs, % |
recommended share of research and development costs, % |
Belgorod region |
0.24 |
0.36 |
Bryansk region |
0.45 |
0.17 |
Vladimir region |
1.29 |
0.26 |
Voronezh region |
1.39 |
0.27 |
Ivanovo region |
0.58 |
0.16 |
Kaluga region |
1.84 |
0.29 |
Kostroma region |
0.11 |
0.15 |
Kursk region |
1.53 |
0.21 |
Lipetsk region |
0.05 |
0.31 |
Moscow region |
4.77 |
0.62 |
Oryol region |
0.37 |
0.17 |
Ryazan region |
0.71 |
0.22 |
Smolensk region |
0.64 |
0.18 |
Tambov region |
0.88 |
0.18 |
Tver region |
1.66 |
0.24 |
Tula region |
0.94 |
0.32 |
Yaroslavl region |
2.72 |
0.25 |
Moscow |
4.94 |
1.04 |
Republic of Karelia |
0.64 |
0.15 |
Komi Republic |
0.45 |
0.29 |
Nenets Autonomous Area |
0.03 |
0.18 |
Arkhangelsk region |
0.67 |
0.18 |
Vologda region |
0.06 |
0.31 |
Kaliningrad region |
0.32 |
0.21 |
Leningrad Region |
0.72 |
0.39 |
Murmansk region |
0.88 |
0.21 |
Novgorod region |
0.91 |
0.18 |
Pskov region |
0.44 |
0.11 |
St. Petersburg |
3.65 |
0.72 |
Republic of Adygea |
0.51 |
0.09 |
Republic of Kalmykia |
0.88 |
0.04 |
Republic of Crimea |
1.44 |
0.14 |
Krasnodar Krai |
0.64 |
0.39 |
Astrakhan region |
0.22 |
0.18 |
Volgograd region |
0.49 |
0.36 |
Rostov region |
1.49 |
0.38 |
Sevastopol |
8.45 |
0.05 |
Republic of Dagestan |
1.89 |
0.09 |
Republic of Ingushetia |
2.65 |
0.02 |
Kabardino-Balkar Republic |
1.52 |
0.09 |
Karachay-Cherkess Republic |
1.12 |
0.09 |
Republic of North Ossetia - Alania |
1.45 |
0.08 |
Chechen republic |
0.68 |
0.09 |
Stavropol Krai |
0.47 |
0.27 |
Republic of Bashkortostan |
0.63 |
0.49 |
Republic of Mari El |
0.13 |
0.16 |
Republic of Mordovia |
0.48 |
0.14 |
Republic of Tatarstan |
0.65 |
0.58 |
Udmurt Republic |
0.24 |
0.32 |
Chuvash Republic |
0.86 |
0.17 |
Perm Krai |
1.15 |
0.47 |
Kirov region |
0.64 |
0.21 |
Nizhny Novgorod Region |
5.73 |
0.42 |
Orenburg region |
0.15 |
0.35 |
Penza region |
1.86 |
0.18 |
Samara region |
0.95 |
0.44 |
Saratov region |
0.96 |
0.28 |
Ulyanovsk region |
3.17 |
0.24 |
Kurgan region |
0.27 |
0.15 |
Sverdlovsk region |
1.79 |
0.56 |
Khanty-Mansi Autonomous Area - Ugra |
0.07 |
0.72 |
Yamalo-Nenets Autonomous Area |
0.02 |
0.46 |
Tyumen region |
1.13 |
0.43 |
Chelyabinsk region |
1.47 |
0.49 |
Republic of Altai |
1.48 |
0.06 |
Republic of Buryatia |
1.03 |
0.16 |
Republic of Tyva |
1.29 |
0.07 |
Republic of Khakassia |
0.07 |
0.18 |
Altai Krai |
0.58 |
0.22 |
Zabaykalsky Krai |
0.28 |
0.16 |
Krasnoyarsk Krai |
1.13 |
0.55 |
Irkutsk region |
0.48 |
0.39 |
Kemerovo region |
0.14 |
0.48 |
Novosibirsk region |
4.01 |
0.29 |
Omsk region |
0.78 |
0.36 |
Tomsk region |
3.44 |
0.27 |
Sakha Republic (Yakutia) |
0.39 |
0.33 |
Kamchatka Krai |
1.82 |
0.12 |
Primorsky Krai |
2.64 |
0.17 |
Khabarovsk Krai |
0.84 |
0.24 |
Amur region |
0.28 |
0.19 |
Magadan region |
0.78 |
0.13 |
Sakhalin region |
0.18 |
0.35 |
Jewish Autonomous Region |
0.92 |
0.05 |
Chukotka Autonomous Area |
0.05 |
0.13 |
The study devoted to the analysis and modeling of dependence of innovative activity on investment in research and development includes such works as (Fritsch, 2003; Xu & Cheng, 2013; Kaihua, and Mingting, 2014; Leshukov et al., 2015; Tarnawska & Mavroeidis, 2015). However, the works mentioned above do not pay sufficient attention to the development of econometric models that would develop the optimal distribution of investment flows among the regions to ensure the most balanced and dynamic innovative development. This section of the work is devoted to the development of such model.
Thus, based on the analysis carried out, it is recommended to redistribute productive forces, in particular from the regions with excessive research and development costs to the regions with insufficient costs. It is also recommended to redistribute the R & D budget in favor of 14 regions identified by the authors. It is necessary to develop a system of motivation for researchers to encourage them to change the region of work, to use a wide arsenal of such forms of spatial organization of innovative activities as clusters, territories of advanced development, special economic zones, support zones and others to ensure the balance of innovative development of Russia.
This study was financed by a grant from the Plekhanov Russian University of Economics.
Abbasi, F., Hajihoseini, H., & Haukka, S. (2011). Use of virtual index for measuring efficiency of innovation systems: A cross-country study. International Journal of Technology Management & Sustainable Develop-ment, 9(3), 195-212.
Baburin, V., & Zemtsov, S. (2014). Efficiency Assessment of Russian Regional Innovation Systems. Modernisation and innovation development of economic systems, pp. 18-37.
Broekel, T., Rogge, N., & Brenner, T. (2018). The innovation efficiency of German regions–a shared-input DEA approach. Review of Regional Research, 38(1), 77-109.
Chen, K., & Guan, J. (2012). Measuring the efficiency of China's regional innovation systems: application of network data envelopment analysis (DEA). Regional Studies, 46(3), 355-377.
Foddi, M., & Usai, S. (2013). Technological catching up among European regions. Lessons from Data Envelopment Analysis. SEARCH WORKING PAPER, WP4/02.
Fritsch, M. (2003). How and why does the efficiency of regional innovation systems differ? In Innovation clusters and interregional competition (pp. 79-96). Springer, Berlin, Heidelberg.
Fritsch, M., & Slavtchev, V. (2011). Determinants of the efficiency of regional innovation systems. Re-gional Studies, 45(7), 905-918.
Guan, J., & Zuo, K. (2014). A cross-country comparison of innovation efficiency. Scientometrics, 100(2), 541-575.
Han, U., Asmild, M., & Kunc, M. (2016). Regional R&D efficiency in Korea from static and dynamic perspectives. Regional Studies, 50(7), 1170-1184.
Kaihua, C., & Mingting, K. (2014). Staged efficiency and its determinants of regional innovation systems: a two-step analytical procedure. The Annals of Regional Science, 52(2), 627-657.
Kotsemir, M. N. (2013). Measuring national innovation systems efficiency–a review of DEA approach. Higher School of Economics Research Papers, WP BRP 16/STI/2013.
Kou, M., Chen, K., Wang, S., & Shao, Y. (2016). Measuring efficiencies of multi-period and multi-division systems associated with DEA: An application to OECD countries’ national innovation systems. Expert Systems with Applications, 46, 494-510.
Leshukov, O., Platonova, D., & Semyonov, D. (2015). Does Competition Matter? The Efficiency of Re-gional Higher Education Systems and Competition: The Case of Russia. Higher School of Economics Research Pa-pers, WP BRP 29/EDU/2015.
Liu, M.C., Wang, J.C., & Wu, M.T. (2014). Typology and Knowledge Productivity of Regional Innovation System: Evidence from China. Journal of Business and Economics, 5(1), 49-60.
Roman, M. (2010). Regional efficiency of knowledge economy in the new EU countries: The Romanian and Bulgarian case. Munich Personal RePEc Archive, MRPA 23083.
Sharma, S., & Thomas, V., 2008. Inter-country R&D efficiency analysis: An application of data envelopment analysis. Scientometrics, 76(3), 483-501.
Shavina, E.V., Skryl, T.V., & Moiseev, N.A. (2019). Internal factors of innovative development of the constituent entities of the Russian Federation. Plekhanovskiy Scientific Bulletin, 1 (15), 157-173.
Tarnawska, K., & Mavroeidis, V. (2015). Efficiency of the knowledge triangle policy in the EU member states: DEA approach. Triple Helix, 2(1), 1-22.
Valdez Lafarga, C., & Balderrama, J. I. L. (2015). Efficiency of Mexico's regional innovation systems: an evaluation applying data envelopment analysis (DEA). African Journal of Science, Technology, Innovation and De-velopment, 7(1), 36-44.
Xu, L., & Cheng, M. (2013). A study on Chinese regional scientific innovation efficiency with a perspec-tive of synergy degree. Technology and Investment, 4(04), 229 - 235.
Yang, G., Ahlgren, P., Yang, L., Rousseau, R., & Ding, J. (2016). Using multi-level frontiers in DEA mod-els to grade countries/territories. Journal of Informetrics, 10(1), 238-253.
1. Academic Department of political economy and history of economic science, Plekhanov Russian University of Economics, Moscow, Russian Federation, evgeniyashavina@yahoo.com
2. Academic Department of mathematical methods in economics, Plekhanov Russian University of Economics, Moscow, Russian Federation
3. Academic Department of political economy and history of economic science, Plekhanov Russian University of Economics, Moscow, Russian Federation
4. Basic Department of financial control, analysis and audit of the Moscow Main Control Department, Plekhanov Russian University of Economics, Moscow, Russian Federation
[Index]
revistaespacios.com

This work is under a Creative Commons Attribution-
NonCommercial 4.0 International License