![]() ISSN 0798 1015
ISSN 0798 1015

![]() ISSN 0798 1015
ISSN 0798 1015
Vol. 41 (Issue 03) Year 2020. Page 21
FLORES FLORES , Adán J. 1; SOLIS VÁZQUEZ, Sheila Y. 2 & ALVAREZ-AROS, Erick L. 3
Received: 26/09/2019 • Approved: 11/01/2020 • Published 06/02/2020
ABSTRACT: The objective of this article is to examine the employment behavior in the manufacturing industry of Reynosa, Tamaulipas (Mexico). A descriptive research was carried out using the shift-share analysis in three study scenarios: 2004 to 2009, 2009 to 2014 and 2004 to 2014. The results suggest that the hiring of new jobs was driven to a greater extent by the national trend; in contrast, local competitiveness only stood out in the first study period. |
RESUMEN: El objetivo del presente artículo es examinar el comportamiento del empleo en la industria manufacturera de Reynosa, Tamaulipas (México). Se realizó una investigación de tipo descriptiva al emplear el análisis shift–share en tres escenarios de estudio: 2004 a 2009, 2009 a 2014 y 2004 a 2014. Los resultados sugieren que la contratación de nuevos puestos de trabajo fue impulsada en mayor medida por la tendencia nacional; en contraste, la competitividad local sólo destacó en el primer periodo de estudio. |

The northern border of Mexico is a source of exports since these activities were promoted in the mid-sixties, representing the most important export zone in Latin America and one of the largest regions in the world of its kind. However, its industrial and technological transformations respond to the needs and projects of transnational corporations and not to the economic and industrial requirements of the country, which represents a difference with respect to the economies of East Asia, in which a technology transfer industry is promoted and knowledge at the local level (Carrillo, 2007; George & Tollen, 1985; Hanson, 2002; López, 2004a; Villarreal & Hamilton, 2012; Weiler & Zerlentes, 2003).
Therefore, the economic growth of state entities in northern Mexico is the result of Foreign Direct Investment or FDI (Garriga, 2017; Mendoza & Villeda, 2006). This investment is mainly made with the United States of America (USA) due to its geographical proximity; therefore, it facilitates the administration of the business logistics required in the reception of raw materials and the commercialization of the finished products. However, this implies vulnerability to the economic circumstances of the northern country (Jordaan, 2008; Jordaan & Rodriguez-Oreggia, 2012, Villalobos & Ahumada, 2008).
On the other hand, despite the difficult global environment that occurs both nationally and internationally, the Mexican economy has a competitive advantage as a result of such investments (Chiatchoua, Castillo & Valderrama, 2018). The most favored foreign companies are those that need cheap labor and in large quantities to carry out their activities (Hess & Prasad, 2007).
However, not having an innovative industrial strategy that promotes competitiveness at the national level means that the geographic advantage is not enough to maintain and generate new investments (Alvarez-Aros, 2018; Díaz-Bautista, 2003; López, 2004b). In this way, from the evolutionary point of view, importance is given to the emergence of new sectors and, mainly, to the role of playing innovation as a driver of changes in international relations of resources (Dosi, Fagiolo & Roventini, 2010; Silva & Teixeira, 2011).
In this sense, Reynosa City is one of the forty-three municipalities that make up the state of Tamaulipas. An account with a territorial extension of 3,156.34 km2 equivalent to 3.7% of the geographic surface of the state Tamaulipas, also, forms part of the border strip with the USA. It borders the Tamaulipas municipalities of Rio Bravo in east, Méndez in south, and Gustavo Díaz Ordaz in west; in addition, with the state of Nuevo León in the west and with USA in the north (GET, 2018).
Based on the impact of the national economic environment on the regional scope, the objective was to observe the innovative behavior of the different regional spaces by the contextualization of the economic activity of Reynosa City, for the period from 2004 to 2014. This work also serves to analyze and understand a leading indicator of innovation, as is the total staff employed in intensive knowledge sectors (Dziallas & Blind, 2019).
In 1965 the Border Industrialization Program (BIP) was implemented in the maquila sector as a result of the increase in the installation of this type of USA manufacturing companies and with the primary objective of contributing to the generation of high-paying jobs that improve the quality of life of border citizens (George & Tollen, 1985; Weiler & Zerlentes, 2003).
In this sense, it must be remembered that a maquiladora plant is one that generally transforms the imported raw material without payment of tariffs and converts it into a finished product through the manufacturing processes of that plant, the latter is generally exported to the investor country of the multinational company wherein the specific case of Mexico most of the time it is the USA (Peña, 2005).
In addition to the above, the installation of multinational companies in neighboring countries allows us to take advantage of geographical proximity to reduce administrative and logistical costs with respect to other countries further afield, this represents an important competitive sale for any border program such as the BIP, in where a significant difference was framed with respect to the Asian maquiladoras firms of free-trade zones (FTZ), which could hardly compete against the advantages mentioned above (Jordaan, 2008; Villalobos & Ahumada, 2008; Sargent & Matthews, 2009).
For the above reason, and due to the commercial eclectic theory, the growing development of the northern border states of Mexico arose and, likewise, this growth was explained in terms of FDI as established by said theory; and that later in 1972, it caused the installation of more manufacturing companies not only in northern Mexico, but also in the center and
south of the country, which allowed the development of industrialized poles in different sectors of the nation (Hanson, 2002; Mendoza & Villeda, 2006).
In addition, the growth of the industrialization of the border strip in northern Mexico allowed providing American investors with personnel well-qualified labor, which contributed to these foreign companies to maintain significant savings in expenses in the processes of industrialization for payroll costs of human resources (Villalobos & Ahumada, 2008). Esteban et al. (2000) argue through the shift-share analysis that economic growth is influenced by the participation of rural development innovation programs. This research is composed of the present introduction, then follows the methodology, results and conclusions are exposed.
The location coefficient (QL) allows comparing the sectoral structure in two different spaces. Its result is positive and the closer it comes to unity (1), it represents a greater weight of the sector in the region than in the total economy (García & Carranco, 2008). For the purposes of this study, the information available from the economic censuses applied by the National Institute of Statistics and Geography (INEGI) was used and the coefficient was calculated using the data of the total employed personnel (TEP), where the proportion was compared regional and national in Equation (1).
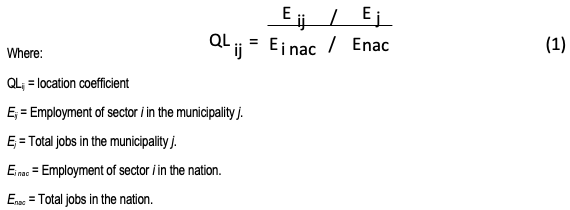
Source: Blair (1995), García & Carranco
(2008) & Rubalcaba et al. (2013).
When interpreting QL it is understood that when the result is greater than unity, there is a localization of the sector in the analyzed region. Therefore, if the result is greater than one, there is an increase in the concentration of the sector. In counterpart, if the result is less than one, there is a decrease in the location of the sector in the region studied. Finally, if the result is equal, the unit represents equality between the regional participation of the sector studied and national participation.
In addition to QL, the shift-share analysis was used, which was developed by Dunn (1960). This method explains the changes in the economic dimensions, concentrating mainly on the variable of employment. Its main purpose is to compare different territories according to their economic change (Vitali, 1990; Fernández, López & Pérez, 2005; Ramajo & Márquez, 2008).
From the above, it can be presumed that local economic changes are the result of the national economic structure (Sui, 1995) . In short, the application of this technique lies in its ability to determine changes in a region derived from the evolution of the national economy (Esteban, 2000). It has been used in multiple investigations due to its ease of application and easy access to the databases used (Stevens & Moore, 1980; Nijkamp, Rietveld & Snickars, 1987; Ramajo and Márquez, 2008; Valdez, 2018).
In order to examine the shift in employment (shift) in a region, it is broken down into three components (shares): the one referring to real change, the proportional and the differential (Dunn, 1960; Esteban, 2000; Valdez, 2018). Therefore, the variation in the TEP of a given regional industry is the result of the sum of these three components: National Share (NS), Industrial Mix (IM), y Regional Share (RS) in Equation (2). When a regional industry exceeds the growth rate of its national counterpart, it is said to be more competitive for the period analyzed, and also, contributes more to the country's economy (Gibson et al., 2003; Kalbacher, 1979).
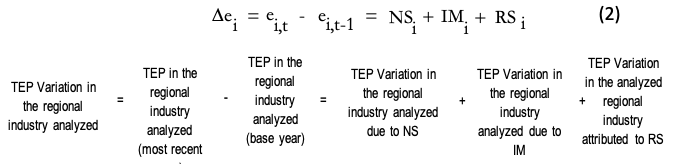
Source: Dunn (1960)
& Kalbacher (1979)
The National Standard (NS) is the portion of the variation in the TEP of the regional industry as a result of the development of the country's economy (Lasuen, 1971; Sakashita, 1973). First, the percentage of national growth or decrease in the TEP is determined and then multiplied by the TEP of the base year in the regional industry in Equation (3). With this, the number of jobs that would be created or lost in the regional industry is inferred, if the national standard will be reflected at the local level (Jackson & Haynes, 2009).
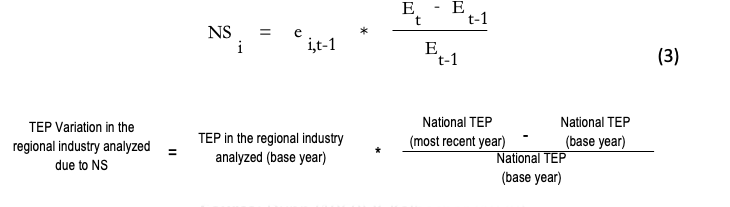
Source: Dunn (1960) & Kalbacher (1979)
The IM is the portion of the variatSource: Dunn (1960) &ion in the TEP of the regional industry as a result of the performance of the national industry (Esteban, 2000). First, the percentage of growth or decrease of the national TEP is subtracted from the percentage of growth or decrease of the TEP of the national industry and the result is multiplied by the TEP of the base year in the regional industry in Equation (4). Consequently, the jobs that would be gained or lost in the regional industry are obtained, if the trend of the IM will manifest itself at the local level. A growing industry must attract more workers than the national standard, that is to say, a positive IM (Hustedde, Shaffer, & Pulver, 1993).
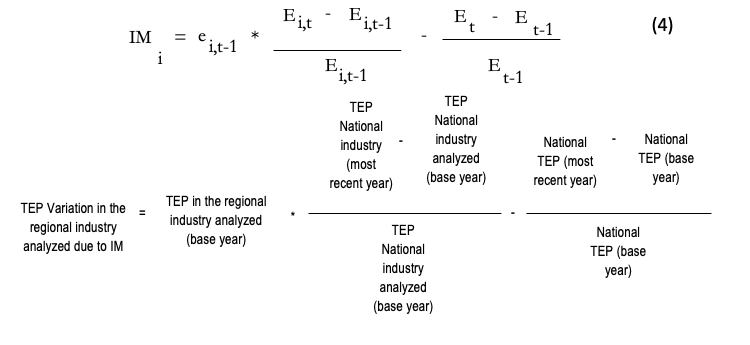
Source: Dunn (1960)
& Kalbacher (1979)
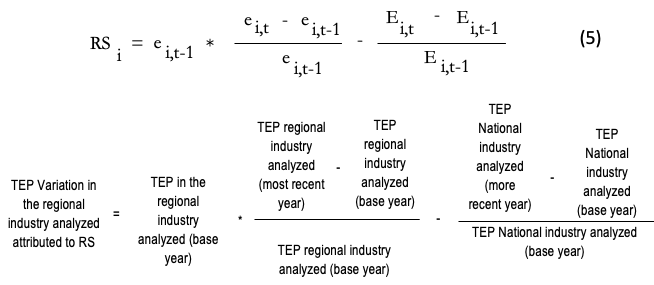
Local competitiveness or RS is part of the variation in the TEP of the regional industry attributed to the efficiency of the local economy to capture or lose jobs in that industry (Jackson & Haynes, 2009). The percentage of variation of the TEP of the national industry is subtracted from the percentage of variation of the TEP of the regional industry, later multiplied by the TEP of the base year in the regional industry in Equation (5). Consequently, a positive RS would mean that the locality is particularly competitive in attracting additional work positions to the regional industry analyzed (RS> IM), naturally, a negative RS would reflect just the opposite ( RS<IM ) (Esteban-Marquillas, 1972; Knudsen, 2000).
Source: Dunn (1960)
& Kalbacher (1979).
Finally, in order to facilitate the evaluation of the results, it is possible to situate the industrial sectors analyzed in the cartesian plane. The optimal scenario would be one in which the growth of the IM will exceed the contribution of the NS, but without exceeding the increase in the RS (RS> IM> NS) (Gibson et al. 2003). A good scenario to attract new jobs to a specific industry is when the trends are positive: national trend (NS + IM) and regional trend (RS) (Kalbacher, 1979; Hustedde, Shaffer & Pulver, 1993; Knudsen, 2000). The interpretations and results of the shift-share analysis are:
• ASSET (Quadrant 1): Occurs when the relative and rapid development of the industrial sectors analyzed occurs in an environment where the growth of the RS was greater than the national trend (NS + IM). Placing oneself in the positive Quadrant allows opting for more aggressive strategies that allow capitalizing on the economic progress generated.
• CHALLENGE (Quadrant 2): The relative and rapid development of the industrial sector analyzed occurred in an environment where the growth of the RS exceeded the negative behavior of the national trend (NS + IM), therefore, the increase in TEP is better explained as a consequence of regional or local competitiveness.
• LIMITATION (Quadrant 3): Being in the negative Quadrant reflects that the loss of jobs occurred in an environment where the decrease RS was accompanied by the decline of the national trend (NS + IM).
• PROSPECT (Quadrant 4): The relative and rapid development of the industrial sector analyzed occurred in an environment where the increase in the RS was lower than the growth of the national trend (NS + IM), therefore, the new jobs are due to more measured by the merits of national events, rather than regional or local events.
In summary, as has been outlined throughout this section, the study was carried out from the QL and was complemented with a shift-share analysis; both methods based on the official information of the economic censuses of 2004, 2009 and 2014 of INEGI. The methods used are descriptive techniques and the results generated depend on the selected period of time. Hence, three study scenarios (2004-2009, 2009-2014, and 2004-2014) were used to minimize the aforementioned restrictions based on the contrast of these scenarios. The present work continues with the analysis of the results of the Reynosa City manufacturing industry.
During the first study period (2004-2009) the QL results indicated that the manufacturing sectors highly located in Reynosa City, Tamaulipas (QL> 3.6455) were: 333 Manufacture of machinery and equipment (6.3651), 334-335 Electrical and electronic sector (9.8546), and 339 Other manufacturing industries (3.7786). The high-tech industry in Reynosa City, Tamaulipas was formalized in May of 2007 and was made up of ten companies: Nokia, Delphi, Jabil, HD Electronics, LG, Foxconn Reynosa, Engines Reynosa Emerson, Motorola of Reynosa, Alcom and TRW Electronics Ensembles (Jiménez, De la Garza, & Medina, 2013). However, it was observed that the manufacturing sectors with the lowest degree of localization (QL <0.4281) were: 311-312 Food, beverages and tobacco industries (0.2937), 313-316 Textiles, clothing and products of leather (0.4232), and 321 Wood Industries (0.3197).
On the other hand, observing the shift-share analysis highlighted that Reynosa City obtained competitiveness in the capture of positive new jobs (RS, 15,500) but without exceeding national growth (NS, 18,740), in other words, the manufacturing industry of the region studied did not manage to grow more than the country's standard (RS <NS). In addition, national performance minimized the negative effect of job losses caused by negative industrial diversification (IM, -7,332). Therefore, the increase in employed personnel (26,908) is understood as the result of an impact of the development of the national economy (NS) than on the efficiency of the region studied (RS).
Table 1 presents the summary of the results obtained on the Reynosa City manufacturing industry for the study period 2004-2009: calculation of QL, increase (decrease) in employed personnel, and developed shift-share analysis.
Table 1
Shift-share analysis of the Reynosa
manufacturing industry: 2004-2009
Sectors of the manufacturing industry |
Location coefficient (QL) |
Jobs in Reynosa, Tamaulipas |
Shift-share analysis |
||||||||
2004 |
2009 |
Average |
2004 |
2009 |
Increase (decrease) in the employed personnel |
NS |
IM |
RS |
Increase (decrease) in the employed personnel |
Quadrant |
|
A |
B |
B-A |
C |
D |
E |
C+D+E |
|||||
311-312 Food, beverage and tobacco industries |
.2852 |
.3023 |
.2937 |
1,728 |
2,394 |
666 |
412.5716 |
-70.0215 |
323.4499 |
666 |
ASSET |
313-316 Textiles, clothing and leather products |
.4429 |
.4035 |
.4232 |
3,417 |
3,166 |
-251 |
815.8316 |
-1,046.9946 |
-19.8370 |
-251 |
LIMITATION |
321 Wood industries |
.3183 |
.3211 |
.3197 |
196 |
260 |
64 |
46.7963 |
-6.5044 |
23.7081 |
64 |
ASSET |
322-323 Industries of paper, printing and related industries |
.6036 |
.8336 |
.7186 |
1,043 |
1,841 |
798 |
249.0232 |
-69.9974 |
618.9742 |
798 |
ASSET |
324-326 Derivatives from petroleum and coal, chemical, plastic and rubber industries |
1.8798 |
1.1533 |
1.5165 |
7,544 |
5,485 |
-2,059 |
1,801.1805 |
-1,148.8864 |
-2,711.2941 |
-2,059 |
PROSPECT |
327 Manufacture of products based on non-metallic minerals |
.4385 |
.4577 |
.4481 |
715 |
937 |
222 |
170.7110 |
-62.8774 |
114.1664 |
222 |
ASSET |
331-332 Metallic industries |
1.5883 |
1.7478 |
1.6681 |
4,843 |
7,480 |
2,637 |
1,156.2987 |
232.4917 |
1,248.2096 |
2,637 |
ASSET |
333 Manufacture of machinery and equipment |
7.5735 |
5.1567 |
6.3651 |
6,857 |
5,290 |
-1,567 |
1,637.1547 |
-1,371.5994 |
-1,832.5553 |
-1,567 |
PROSPECT |
334-335 Electric and electronic sector |
8.5065 |
11.2026 |
9.8546 |
30,766 |
54,096 |
23,330 |
7,345.5886 |
-453.6732 |
16,438.0846 |
23,330 |
ASSET |
336 Manufacture of transport equipment |
3.3814 |
2.8447 |
3.1131 |
15,092 |
14,609 |
-483 |
3,603.3161 |
-2,775.5368 |
-1,310.7793 |
-483 |
PROSPECT |
337 Manufacture of furniture and related products |
1.0324 |
1.1343 |
1.0834 |
1,319 |
1,732 |
413 |
314.9201 |
-188.6719 |
286.7518 |
413 |
ASSET |
339 Other manufacturing industries |
3.3079 |
4.2493 |
3.7786 |
4,969 |
8,107 |
3,138 |
1,186.3820 |
-369.7133 |
2,321.3312 |
3,138 |
ASSET |
2.1459 |
2.3796 |
1.0834 |
78,489 |
105,397 |
26,908 |
18,740 |
-7,332 |
15,500 |
26,908 |
ASSET |
|
Source: Own elaboration from Sui (1995),
Vera (2015) & INEGI (2004, 2009).
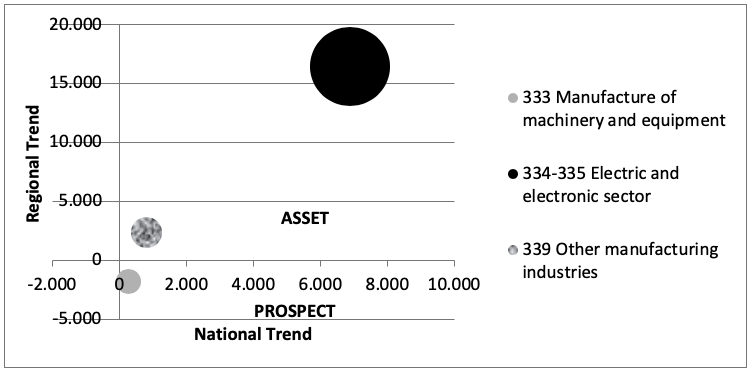
In relation to the location of the sectors of the Reynosa City manufacturing industry in the Cartesian plane, the 334-335 electrical and electronic sector is the best positioned in Quadrant 1 (ASSET) because its increase in employed personnel (23,330) was based on a local competitiveness (RS, 16,438.0846) more than to a national trend (NS, 7,345.5886) or industrial diversification (IM, -453.6732). Otherwise, it occurred in the sector of 313-316 Textiles, clothing and leather products, located in Quadrant 3 (LIMITATION), since its decrease in employed personnel (-251) was derived from a loss of local competitiveness (RS, -19.8370), coupled with a scarce use of the positive national trend (NS, 815.8316) and a negative industrial diversification (IM, -1,046,946). Hence, the ideal scenario for the sectors would be one where the growth of the national industry (IM) exceeds the national standard (NS) but without exceeding the growth of the regional industry (RS), that is, RS> IM> NS (Gibson et al., 2003).
Figure 1 shows the location of the Reynosa City manufacturing industry according to national (NS + IM) and regional (RS) trends according to their representativeness (QL> 3.6455) and the shift-share analysis (2004-2009). The 334-335 electrical and electronic sector in the ASSET section (Quadrant 1).
Figure 1
Shift-share analysis of Reynosa City
manufacturing industry: 2004-2009
Source: Own elaboration from Gibson et al. (2003),
INEGI (2004, 2009), Solis & García (2017).
During the second study period (2009-2014), the QL results indicated that the manufacturing sectors highly located in Reynosa City, Tamaulipas (QL> 4.4678) were again: 333 Manufacture of machinery and equipment (5.8161), 334-335 Electricity sector and electronic (10.6247), and 339 Other manufacturing industries (4.9145). One possible explanation for this high location indicator is the geographic proximity to the main commercial partner of Mexico and Tamaulipas, the USA (Villalobos & Ahumada, 2008; Sargent & Matthews, 2009). However, it was observed that the manufacturing sectors with the lowest degree of location (QL <0.4154) were: 311-312 Food, beverages and tobacco (0.3122), 313-316 Textiles, clothing and products leather (0.2824), and 327 Manufacture of products based on non-metallic minerals (0.4024), which suggests the existence of other location factors different from the border with that country.
Regarding the executed shift-share analysis, Reynosa City highlighted a contrasting result with respect to the first study period (2004-2009), due to the scarce regional competitiveness in attracting new jobs (RS, -14,018) and, jointly, to the insufficient capitalization of the favorable national trend (NS, 7,647, IM, 1,133). Therefore, the decrease in employed personnel for the period 2009-2014 (-5.238) was explained, in a better way, as the result of an impact of the development of the national economy (NS) than on the efficiency of the region studied (RS). Hence, when the national (NS + IM) and regional (RS) trends are positive, they reflect a good outlook for the increase in employed personnel in the specific industry analyzed (Kalbacher, 1979; Hustedde, Shaffer & Pulver, 1993; Knudsen, 2000).
Table 2 presents the summary of the results obtained on the manufacturing industry in Reynosa City for the study period 2009-2014: calculation of QL, increase (decrease) in employed personnel, and shift-share analysis developed.
Table 2
Shift-share analysis of the Reynosa
manufacturing industry: 2009-2014
Sectors of the manufacturing industry |
Location coefficient (QL) |
Jobs in Reynosa, Tamaulipas |
Shift-share analysis |
||||||||
2009 |
2014 |
Average |
2009 |
2014 |
Increase (decrease) in the employed personnel |
NS |
IM |
RS |
Increase (decrease) in the employed personnel |
Quadrant |
|
A |
B |
B-A |
C |
D |
E |
C+D+E |
|||||
311-312 Food, beverage and tobacco industries |
.3023 |
.3221 |
.3122 |
2,394 |
2,427 |
33 |
173.6904 |
-43.5773 |
-97.1131 |
33 |
PROSPECT |
313-316 Textiles, clothing and leather products |
.4035 |
.1613 |
.2824 |
3,166 |
1,103 |
-2,063 |
229.7008 |
-338.7881 |
-1,953.9127 |
-2,063 |
LIMITATION |
321 Wood industries |
.3211 |
.6144 |
.4677 |
260 |
405 |
145 |
18.8636 |
-44.3611 |
170.4975 |
145 |
CHALLENGE |
322-323 Industries of paper, printing and related industries |
.8336 |
1.2290 |
1.0313 |
1,841 |
2,492 |
651 |
133.5689 |
-101.6451 |
619.0762 |
651 |
ASSET |
324-326 Derivatives from petroleum and coal, chemical, plastic and rubber industries |
1.1533 |
1.0225 |
1.0879 |
5,485 |
5,202 |
-283 |
397.9498 |
617.9777 |
-1,298.9274 |
-283 |
PROSPECT |
327 Manufacture of products based on non-metallic minerals |
.4577 |
.3470 |
.4024 |
937 |
636 |
-301 |
67.9816 |
-75.5021 |
-293.4794 |
-301 |
LIMITATION |
331-332 Metallic industries |
1.7478 |
1.5888 |
1.6683 |
7,480 |
6,683 |
-797 |
542.6917 |
123.1294 |
-1,462.8212 |
-797 |
PROSPECT |
333 Manufacture of machinery and equipment |
5.1567 |
6.4755 |
5.8161 |
5,290 |
7,099 |
1,809 |
383.8020 |
590.0037 |
835.1943 |
1,809 |
ASSET |
334-335 Electric and electronic sector |
11.2026 |
10.0467 |
10.6247 |
54,096 |
42,731 |
-11,365 |
3,924.7931 |
-5,228.1854 |
-10,061.6076 |
-11,365 |
LIMITATION |
336 Manufacture of transport equipment |
2.8447 |
2.5180 |
2.6814 |
14,609 |
16,799 |
2,190 |
1,059.9176 |
5,359.1803 |
-4,229.0979 |
2,190 |
PROSPECT |
337 Manufacture of furniture and related products |
1.1343 |
2.7680 |
1.9511 |
1,732 |
3,789 |
2,057 |
125.6607 |
-137.3014 |
2,068.6407 |
2,057 |
CHALLENGE |
339 Other manufacturing industries |
4.2493 |
5.5797 |
4.9145 |
8,107 |
10,793 |
2,686 |
588.1821 |
412.1203 |
1,685.6976 |
2,686 |
ASSET |
|
2.3796 |
2.3019 |
2.3408 |
105,397 |
100,159 |
-5,238 |
7,647 |
1,133 |
-14,018 |
-5,238 |
PROSPECT |
Source: Own elaboration from Sui (1995),
Vera (2015) & INEGI (2009, 2014).
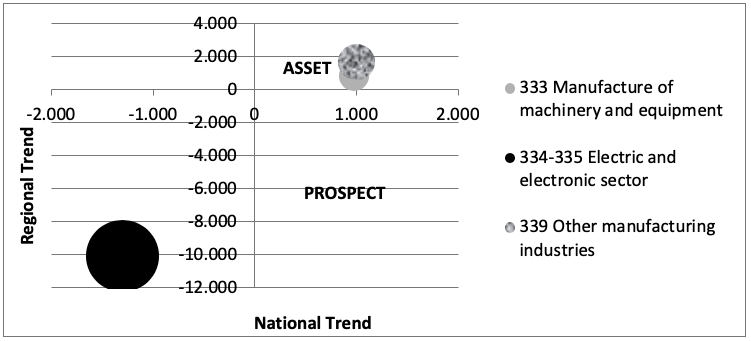
With regard to the location in the cartesian plane of the sectors of the Reynosa City manufacturing industry, the electric and electronic sector positioned in Quadrant 3 (LIMITATION) stands out as a result of its decrease in employed personnel (-11,365) caused by a negative industrial diversification (IM, -5,228,1854) but, above all, to a poor local competitiveness to generate new jobs in this sector (RS, -10,061.6076). However, the 322-323 Industries of paper, printing and related industries, 333 Manufacture of machinery and equipment, and 339 Other manufacturing industries, managed to overcome the contraction of national growth to achieve location in Quadrant 1 (ASSET).
Figure 2 illustrates the location of Reynosa City manufacturing industry according to national (NS + IM) and regional (RS) trends according to their representativeness (QL> 4.4678) and the shift-share analysis (2009-2014). On this occasion, the result of the 334-335 Electrical and electronic sector places it in the LIMITATION section (Quadrant 3).
Figure 2
Shift-share analysis of Reynosa City
manufacturing industry: 2009-2014
Source: Own elaboration from Gibson, et al. (2003),
INEGI (2009, 2014), Solis & García (2017).
Finally, in the third study period (2004-2014), QL results showed that manufacturing sectors highly located in Reynosa City, Tamaulipas (QL> 4.1449) were again: 333 Manufacture of machinery and equipment (7.0245), 334-335 Electric and electronic sector (9.2766), and 339 Other manufacturing industries (4.4438). However, it was observed that the manufacturing sectors with the lowest degree of location (QL <.4074) were: 311-312 Food, beverages and tobacco (.3036), 313-316 Textiles, clothing and products leather (.3021), and 327 Manufacture of products based on non-metallic minerals (.3928).
When the shift-share analysis was developed in the full period (2004-2014), the increase in employed personnel (21,670) in Reynosa City was due to the capitalization of the highly favorable national trend (NS, 25,794) despite having a scarce regional competitiveness in attracting new jobs (RS, 92), together with a negative industrial diversification (IM, -4,216). Consequently, the increase in jobs (21,670) was explained as the result of an impact of the development of the national economy (NS) than the efficiency of the region studied (RS). Table 3 presents the summary of the results obtained on the manufacturing industry in Reynosa City for the study period 2009-2014: calculation of QL, increase (decrease) in employed personnel, and developed shift-share analysis.
Table 3
Shift-share analysis of Reynosa manufacturing industry: 2004-2014
Sectors of the manufacturing industry |
Location coefficient (QL) |
Jobs in Reynosa, Tamaulipas |
Shift-share analysis |
||||||||
2004 |
2014 |
Average |
2004 |
2014 |
Increase (decrease) in the employed personnel |
NS |
IM |
RS |
Increase (decrease) in the employed personnel |
Quadrant |
|
A |
B |
B-A |
C |
D |
E |
C+D+E |
|||||
311-312 Food, beverage and tobacco industries |
.2852 |
.3221 |
.3036 |
1,728 |
2,427 |
699 |
567.8751 |
-112.7914 |
243.9162 |
699 |
ASSET |
313-316 Textiles, clothing and leather products |
.4429 |
.1613 |
.3021 |
3,417 |
1,103 |
-2,314 |
1,122.9336 |
-1,463.8673 |
-1,973.0663 |
-2,314 |
LIMITATION |
321 Wood industries |
.3183 |
.6144 |
.4664 |
196 |
405 |
209 |
64.4118 |
-47.2923 |
191.8806 |
209 |
ASSET |
322-323 Industries of paper, printing and related industries |
.6036 |
1.2290 |
.9163 |
1,043 |
2,492 |
1,449 |
342.7626 |
-142.5463 |
1,248.7837 |
1,449 |
ASSET |
324-326 Derivatives from petroleum and coal, chemical, plastic and rubber industries |
1.8798 |
1.0225 |
1.4511 |
7,544 |
5,202 |
-2,342 |
2,479.1955 |
-308.7902 |
-4,512.4053 |
-2,342 |
PROSPECT |
327 Manufacture of products based on non-metallic minerals |
.4385 |
.3470 |
.3928 |
715 |
636 |
-79 |
234.9715 |
-133.7421 |
-180.2294 |
-79 |
PROSPECT |
331-332 Metallic industries |
1.5883 |
1.5888 |
1.5886 |
4,843 |
6,683 |
1,840 |
1,591.5620 |
351.9420 |
-103.5040 |
1,840 |
PROSPECT |
333 Manufacture of machinery and equipment |
7.5735 |
6.4755 |
7.0245 |
6,857 |
7,099 |
242 |
2,253.4257 |
-676.7202 |
-1,334.7056 |
242 |
PROSPECT |
334-335 Electric and electronic sector |
8.5065 |
10.0467 |
9.2766 |
30,766 |
42,731 |
11,965 |
10,110.6747 |
-4,126.0914 |
5,980.4168 |
11,965 |
ASSET |
336 Manufacture of transport equipment |
3.3814 |
2.5180 |
2.9497 |
15,092 |
16,799 |
1,707 |
4,959.7056 |
2,863.1193 |
-6,115.8249 |
1,707 |
PROSPECT |
337 Manufacture of furniture and related products |
1.0324 |
2.7680 |
1.9002 |
1,319 |
3,789 |
2,470 |
433.4649 |
-316.9301 |
2,353.4653 |
2,470 |
ASSET |
339 Other manufacturing industries |
3.3079 |
5.5797 |
4.4438 |
4,969 |
10,793 |
5,824 |
1,632.9696 |
-102.4217 |
4,293.4521 |
5,824 |
ASSET |
|
2.1459 |
2.3019 |
2.2239 |
78,489 |
100,159 |
21,670 |
25,794 |
-4,216 |
92 |
21,670 |
ASSET |
Source: Own elaboration from Sui (1995), Vera (2015) & INEGI (2004, 2014).
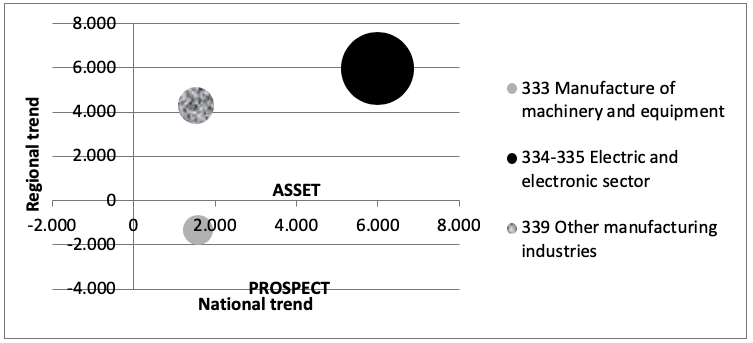
Regarding the location in the cartesian plane of the sectors of the Reynosa City manufacturing industry, stands out the 334-335 Electrical and electronic sector that managed to be located in Quadrant 1 (ASSET), since its increase in employed personnel (11,965) was derived to a greater extent to a positive national trend and local competitiveness (NS, 10,110.6747, RS, 5,980.4168), which compensated for the loss caused by industrial diversification (IM, -4,126.0914). Similarly, the sector 339 Other manufacturing industries, was located in Quadrant 1 (ASSET) with a positive national trend and city level (NS, 1,632.9696, RS, 4,293.4521) which helped to recover the decline of the national industry (IM, -102.4217). However, the Textiles, clothing and leather products sector ranked in Quadrant 3 (LIMITATION) as a result of its decrease in employed personnel (-2,314) caused by a negative industrial diversification (IM, -1,463.8673), low competitiveness local to generate new jobs in that sector (RS, -1,973.0663), and only helped by the national trend (NS, 1,122.9336).
Figure 3 illustrates the location of the Reynosa City manufacturing industry according to national (NS + IM) and regional (RS) trends according to their representativeness (QL> 4.1449) and the shift-share analysis (2004-2014). Again, the result of the 334-335 Electrical and electronic sector places it in the ASSET section (Quadrant 1).
Figure 3
Shift-share analysis of the Reynosa
City manufacturing industry: 2004-2014
Source: Own elaboration from Gibson et al. (2003), INEGI (2004, 2009), Solis & García (2017).
This paper analyzed the economic activity of Reynosa City, based on QL methods and shift-share analysis. The interpretation of the aforementioned methods suggests that the recruitment of new jobs was driven to a greater extent by the NS in the three periods of study (2004-2009, 2009-2014, 2004-2014), in contrast, the RS only stood out in the first period analyzed. In addition, the strong contraction of the IM in the first and third periods affected the growth of the labor force.
Therefore, the research carried out could constitute an initial reference for public policy managers in the creation of proactive policies in journeys to capitalize on the particular attributes of Reynosa City and, in this way, help entrepreneurs to manage sustainable competitive advantages and the results of this study may be useful for managers, researchers and policy makers to better understand the innovation process. Likewise, this theoretical contribution can be used by the academic community to examine in depth the manufacturing industry of Tamaulipas in subsequent empirical works.
It is expected that each region will attract different industries, since their location conditions are not homogenized, for example: available infrastructure, natural resources, usable geographic area, potential employees' skill level, crime rates, cost of ownership work (paid salaries), among others. Regarding the generation of innovations and the creation of new sectors, it is very weak because there is no adequate dissemination and promotion of programs that help to introduce improvements in processes, products and services of these industrial branches, which leads to that there is no adequate capacity in the most dynamic sectors to increase the total employed population in them.
Consequently, a future line of research to be followed is to broaden the scope of the study to identify the most significant localization conditions of the sectors that make up the backbone of the Reynosa City manufacturing industry (333 Manufacture of machinery and equipment, 334-335 Electrical sector and electronic, and 339 Other manufacturing industries). In other words, to evaluate the attraction capacity of the Tamaulipas border area based on its relative logistical simplicity with Mexico's main trading partner: USA.
Finally, it is necessary to point out that the methods used are descriptive techniques and the results generated depend on the selected period of time. For this reason, the present work sought to minimize the aforementioned restrictions by contrasting the information of three study scenarios: 2004-2009, 2009-2014, and 2004-2014.
Alvarez-Aros, E. L. (2018). Determining factors of innovation in the competitiveness of the automotive autopart industry in Mexico. Revista de Economía, XXXV(90), 125-153. Retrieved from http://www.revista.economia.uady.mx/2018/XXXV/90/4.pdf
Blair, J. P. (1995). Local economic development, analysis and practice. Londres: Sage Publications.
Carrillo, J. (2007). La industria maquiladora en México: ¿evolución o agotamiento? Comercio Exterior, 57(8), 668-681.
Chiatchoua, C., Castillo, O. N., & Valderrama, A. L. (2018). Inversión extranjera directa y crecimiento del empleo. Evidencia empírica de los sectores económicos en México (1990-2015). Revista de Economía Política y Sociedad, 14(1), 71-102.
Díaz-Bautista, A. (2003). El TLCAN y el crecimiento económico de la frontera norte de México. Comercio Exterior, 53(12), 1090-1097.
Dosi, G., Fagiolo, G., & Roventini, A. (2010). “Schumpeter Meeting Keynes: A Policy-Friendly Model of Endogenous Growth and Business Cycles. Journal of Economic Dynamics & Control, 34(9), 1748-1767.
Dunn, E. S. (1960). A statistical and analytical technique for regional analysis. Papers of the Regional Science Association, 6(1), 97-112.
Dziallas, M., & Blind, K. (2019). Innovation indicators throughout the innovation process: An extensive literatura analysis. Technovation, 80-81, 3-29. doi:http://dx.doi.org/10.1016/j.technovation.2018.05.005
Esteban, J. (2000). Regional convergence in Europe and the industry mix: a shift-share analysis. Regional Science and Urban Economics, 30(3), 353-364. doi:http://dx.doi.org/10.1016/S0166-0462(00)00035-1
Esteban-Marquillas, J. M. (1972). A reinterpretation of shift-share analysis. Regional and Urban Economics, 2(3), 249-255. doi:http://dx.doi.org/10.1016/0034-3331(72)90033-4
Fernández, M. M., López, A. J., & Pérez, R. (2005). Escenarios de empleo regional. Una propuesta basada en análisis shift-share. Estudios de Economía Aplicada, 23(3), 863-887.
García, M. B., & Carranco, Z. (2008). Concentración regional en Veracruz. Un enfoque de identificación de Aglomeraciones Productivas Locales. Revista Análisis Económico, 23(52), 291-310.
Garriga, A. C. (2017). Inversión extranjera directa en México: comparación entre la inversión procedente de los Estados Unidos y del resto del mundo. Foro Internacional, 57(2), 317-355. doi:http://dx.doi.org/10.24201/fi.v57i2.2429
George, E. Y., & Tollen, R. D. (1985). The economic impact of the Mexican Boarder Industrialization Program. Texas: Center for Inter-Amercan anb Border Studies.
GET. (2018). Municipios. Gobierno del Estado de Tamaulipas. Retrieved March 05, 2019, from https://www.tamaulipas.gob.mx/estado/municipios/reynosa/
Gibson, D. V., Rhi-Perez, P., Cotrofeld, M., De los Reyes, O., & Gipson, M. (2003). Cameron County/Matamoros at the Crossroads: Assets and Challenges for Accelerated Regional and Binational Development. The University of Texas at Brownsvile. Texas: Texas Southmost Collage Report.
Hanson, G. H. (2002). The role of maquiladoras in Mexico’s export boom. Conference Prospects for Industrial Parks in the Palestinian Territorie. Rice University. Retrieved from https://migration.ucdavis.edu/rs/more.php?id=8_0_2_0
Hess, S., & Prasad, S. (2007). Relative treatment of workers in Mexico vs China: Implications for location decisions. International Journal of Commerce & Management, 17(3), 183-193.
Hustedde, R. J., Shaffer, R., & Pulver, G. (1993). Community Economic Analysis: A How To Manual. Iowa State University.
INEGI. (2004). Retrieved March 1, 2019, from Instituto Nacional de Estadística y Geografía: http://www3.inegi.org.mx/sistemas/saic/?evento=2004
INEGI. (2009). Retrieved March 1, 2019, from Instituto Nacional de Estadística y Geografía.: http://www3.inegi.org.mx/sistemas/saic/?evento=2009
INEGI. (2014). Retrieved March 1, 2019, from Instituto Nacional de Estadística y Geografía: http://www.beta.inegi.org.mx/proyectos/ce/2014/
Jackson, R. W., & Haynes, K. E. (2009). Shift-Share Analysis. International Encyclopedia of Human Geography, 125-131. doi:http://dx.doi.org/10.1016/B978-008044910-4.00515-0
Jiménez, K. P., De la Garza, M. I., & Medina, J. M. (2013). Análisis de los retos actuales de los clusters manufactureros en el norte de Tamaulipas. In J. A. Pérez, G. I. Ceballos, & A. R. Cogco, Los retos de la política industrial ante la reconfiguración espacial en México: Una perspectiva desde las externidades pecuniarias y tecnológicas (pp. 46-64). Miguel Ángel Porrúa.
Jordaan, J. A. (2008). State Characteristics and the Locational Choice of Foreign Direct Investment: Evidence from Regional FDI in Mexico 1989–2006. Growth and Change, 39(3), 389-413. doi:http://dx.doi.org/10.1111/j.1468-2257.2008.00431.x
Jordaan, J. A., & Rodriguez-Oreggia, E. (2012). Regional growth in Mexico under trade liberalisation: how important are agglomeration and FDI? The Annals of Regional Science, 48(1), 179-202. doi:http://dx.doi.org/10.1007/s00168-010-0406-4
Kalbacher, J. Z. (1979). Shift-Share Analysis: A Modified Approach. Agricultural Economics Research, 31(1), 12-25.
Knudsen, D. C. (2000). Shift-share analysis: further examination of models for the description of economic change. Socio-Economic Planning Sciences, 34(3), 177-198. doi:http://dx.doi.org/10.1016/0034-3331(72)90033-4
Lasuen, J. R. (1971). Venezuela: An Industrial Shift-Share Analysis 1941-1961. Regional and Urban Economics, 1(2), 153-219. doi:http://dx.doi.org/10.1016/0034-3331(71)90003-0
López, J. H. (2004a). Globalización y desarrollo Local. Una perspectiva Valenciana. Valencia: Universidad de Valencia.
López, V. (2004b). La industrialización de la frontera norte de México y los modelos exportadores asiáticos. Comercio Exterior, 54(8), 674-680.
Mendoza, J. E., & Villeda, M. (2006). Liberalización económica y crecimiento regional en México. Comercio Exterior, 56(7), 581-591.
Nijkamp, P., Rietveld, P., & Snickars, F. (1987). Regional and Multiregional Economic Models: a Survey. In P. Nijkamp, Handbook of Regional and Urban Economics (Vol. 1, pp. 257-294). North-Holland: Regional Economics. doi:https://doi.org/10.1016/S1574-0080(00)80010-3
Peña, S. (2005). Recent developments in urban marginality along Mexico´s northern border. Habitat International, 29(2), 285-301. doi:http://dx.doi.org/10.1016/j.habitatint.2003.10.002
Ramajo, J., & Márquez, M. (2008). Componentes espaciales en el modelo Shift-Share. Una aplicación al caso de las regiones peninsulares españolas. Estadística Española, 50(168), 247-272.
Rubalcaba, L., Gallego, J., Gallo, M. T., & Garrido, R. (2013). Business services location and market factors in major European cities. Cities, 31, 258-266. doi:http://dx.doi.org/10.1016/j.cities.2012.06.022
Sakashita, N. (1973). An axiomatic approach to shift-and-share analysis. Regional and Urban Economics, 3(3), 263-272. doi:http://dx.doi.org/10.1016/0034-3331(73)90012-2
Sargent, J., & Matthews, L. (2009). China versus Mexico in the Global EPZ Industry: Maquiladoras, FDI Quality, and Plant Mortality. World Development, 37(6), 1069-1082. doi:http://dx.doi.org/10.1016/j.worlddev.2008.10.002
Silva, E. G., & Teixeira, A. (2011). Does Structure Influence Growth? A Panel Data Econometric Assessment of ‘Relatively Less Developed’ Countries, 1979-2003. Industrial and Corporate Change, 20(2), 457-510.
Solis, S. Y., & García, F. F. (2017). Comportamiento del empleo en la industria manufacturera: Cuenca de Burgos, Tamaulipas. Un análisis shift-share. Revista de Ciencias Sociales, XXIII(3), 89-101.
Stevens, B. H., & Moore, C. L. (1980). A Critical Review of the Literature on Shift-Share as a Forecasting Technique. Journal of Regional Science, 20(4), 342-356.
Sui, D. Z. (1995). Spatial Economic Impacts of New Town Development in Hong Kong: A GIS-based Shift-share Analysis. Socio-Economic Planning Sciences, 29(3), 227-243. doi:http://dx.doi.org/10.1016/0038-0121(95)00011-A
Valdez, R. (2018). Impacto de la proximidad geográfica en los cambios del empleo manufacturero en México: Análisis shift-share espacial. Frontera Norte, 30(59), 155-184.
Vera, R. (2015). Comportamiento sectorial del empleo en el condado de Cameron, Texas, 2007-2011. Frontera Norte, 27(53), 147-176.
Villalobos, R., & Ahumada, O. (2008). International plant location decisions under labor scarcity. IIE Annual Conference.Proceedings, (pp. 1778-1783.).
Villarreal, A., & Hamilton, E. R. (2012). Rush to the border? Market liberalization and urban- and rural-origin internal migration in Mexico. Social Science Research, 41(5), 1275-1291.
Vitali, G. (1990). Determinants of international trade of machine tools during the eighties: a shift-share analysis. Technovation, 10(8), 507-519. doi:http://dx.doi.org/10.1016/0166-4972(90)90047-N
Weiler, S., & Zerlentes, B. (2003). Maquila sunrise or sunset? Evolutions of regional production advantages. The Social Science Journal, 40(2), 283-297.
1. Profesor investigador. Facultad de Comercio y Administración Victoria. Universidad Autónoma de Tamaulipas. México. ajflores@docentes.uat.edu.mx
2. Profesor investigador. Unidad Académica de Trabajo Social y Ciencias para el Desarrollo Humano. Universidad Autónoma de Tamaulipas. México. ssolis@docentes.uat.edu.mx
3. .*Corresponding author. Profesor investigador. Posgrados en Planeación Estratégica y Dirección de Tecnología. Universidad Popular Autónoma del Estado de Puebla. México. erickleobardo.alvarez@upaep.mx , enginoel@gmail.com
[Index]
revistaespacios.com

This work is under a Creative Commons Attribution-
NonCommercial 4.0 International License