![]() ISSN 0798 1015
ISSN 0798 1015

![]() ISSN 0798 1015
ISSN 0798 1015
 Vol. 41 (Number 04) Year 2020. Page 16
DINA, Nasa Z. 1 & MARJIANTO, Rachman S. 2
Received: 04/10/2019 • Approved: 30/01/2020 • Published: 13/02/2020
ABSTRACT: The main purpose of this paper is to explore the students’ navigation patterns in taking a quiz in learning management systems and also grouping the similar students based on the grades and the quiz completion time. We used a process-oriented approach to identify specific types of interaction sequences on the students’ quiz-taking strategies in e-learning. Then, we used K-Means clustering algorithm to identify the number of group of students who have similar pattern in doing quiz in learning management system. The result of this study can be used as an illustration that process mining can be used to identify the students’ preference behavior in e-learning quizzes that may help teachers evaluate learning process. |
RESUMEN: El objetivo principal de este documento es explorar los patrones de navegación de los estudiantes al realizar una prueba en los sistemas de gestión del aprendizaje y también agrupar a los estudiantes similares en función de las calificaciones y el tiempo de finalización de la prueba. Utilizamos un enfoque orientado al proceso para identificar tipos específicos de secuencias de interacción en las estrategias de toma de cuestionarios de los estudiantes en e-learning. Luego, utilizamos el algoritmo de agrupación de K-Means para identificar el número de grupos de estudiantes que tienen un patrón similar al hacer cuestionarios en el sistema de gestión del aprendizaje. El resultado de este estudio se puede utilizar como una ilustración de que la minería de procesos se puede utilizar para identificar el comportamiento de preferencia de los estudiantes en las pruebas de aprendizaje electrónico que pueden ayudar a los maestros a evaluar el proceso de aprendizaje. |

An information and communication technology (ICT) is an integral part of modern life, including in academic environment such as in higher education (HE) institutions (Juhanak, Zounek, & Rohlikova, 2019). One example of the use of technology in HE is learning management systems (e-learning) and virtual learning environments (VLE). Students and teachers perform class activities and assessment online. It is reported that over 80% of HE institutions in the UK were using e-learning and 90% of HE institutions in USA invested in le-learning (Juhanak, Zounek, & Rohlikova, 2019). With the growth of e-learning in HE, more extensive research on leafrning management system needs to be carried out. Ozarslan and Ozan (2016) conducted research about self-assessment quiz taking behavior analysis in an online course and they considered the relation between the final exam score and the attendance in an online course. A lot of researchers used questionnaire to analyse the relation between those (Ozarslan & Ozan, 2016). Watering, Gijbels, Dochy and Rijt (2008) conducted a study that used the students’ perceptions and the assessment result based on the questionnaire they gave to the students. Watering, Gijbels, Dochy and Rijt (2008) also explored the side effect of new learning environment (NLE) usage to the assessment result. However, the results were negative. They did not find the relationship between the students’ perception of the assessment and the students’ score. Meanwhile, according to the students, they choose online assessment using NLE over traditional written assessment (Watering, Gijbels, Dochy, & Rijt, 2008). Mansur and Yusof (2018) used K-means clustering to monitor and assess the students’ performance and behavior. They learned six attributes from the teacher which affect the students’ performance. The good speech attribute has the strongest correlation with commitment and time management by the teacher. The same clustering method has been used by Kurniawan, Setyosari, Kamdi and Ulfa (2018). The study identified five clusters to model the student data.
This study aims to discover the students’ behavior when they were taking the online-quiz. The main purpose was to analyze the interaction between students and learning management systems (e-learning), especially students’ preference in deciding the order and the type of question to be answered. Process mining method was used to analyze the students’ interactions, allowing mapping and modeling the process of completed quizzes by students. A study introduced six approaches: eye-tracking, automated online dialog analysis, survey data, log data and visual learning analytics while in this article we used log data to be processed using process mining (Nistor & Hernández-García, 2018). The research questions were: (1) How does a process mining method detect specific patterns in students’ behavior while they do quizzes?; (2) What types of student quiz-taking behavior can be identified using process mining?; (3) How many clusters are generated from the K-Means Clustering Algorithm? The results are expected to map the research paradigm on the student quiz-taking behavior detection and modeling as well as to have practical impacts among practitioners.
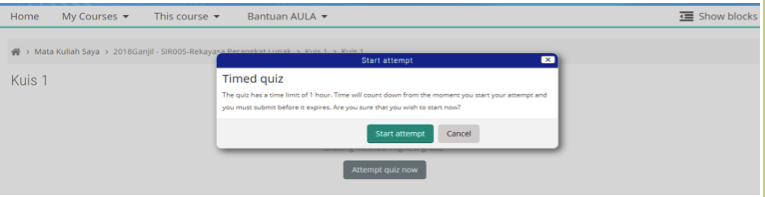
We analyzed data from a quiz assigned in software engineering courses at the Faculty of Vocational Studies, Universitas Airlangga, Indonesia. The quiz was selected based on the following criteria: taken by the highest number of students; and was compulsory in the Information Systems Study Program. The summary is presented in Table 1 below. The quiz was for a summative evaluation, attempted only once. The questions were presented in order, and the students must achieve a pre-determined threshold. The quiz was conducted at a computer laboratory as final exams. The time limit was 60 minutes, with the exemption: if students finished earlier then they could submit early. All students enrolled in subject course were present and took the quiz because it was compulsory.
Table 1
An overview of the quiz
|
Description |
Subject Course |
Software Engineering |
Credits |
2 credits |
Semester |
2 |
No. of students |
84 |
No. of questions |
9 |
Time limit |
120 minutes |
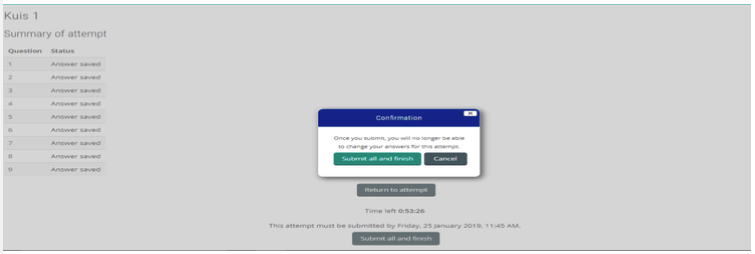
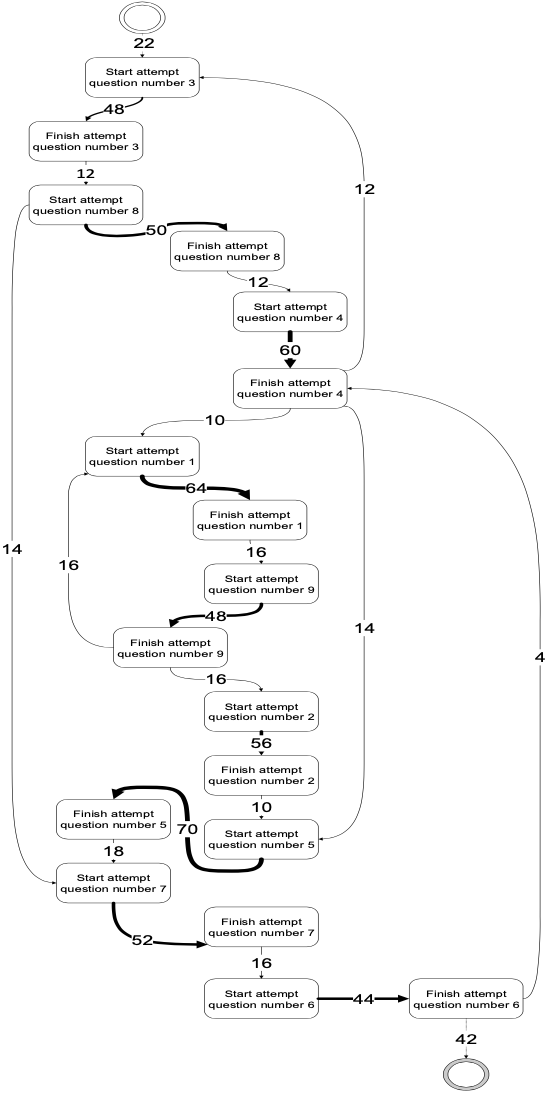
The data were collected using a standard e-learning logging system, thus extracted from the system's database. The datasets contained the following variables: Quiz ID, Student ID, Activity Name and Timestamp. The quiz activity names are presented in Table 2. The activities started with instruction and information about the quiz (qv). The information _number (saq) was recorded as students typed the first word in the column and ended when they clicked next-page button. If the students decided to go back to the previous number, the record time continued until they stopped making any change and it was called finish_attempt_question_number (faq). Each number had its own saq and faq, recorded in the database. After all nine questions were finished, then the students clicked submit-all-and-finish button as the quiz_attempt_submitted (qasub) process. The quiz was then submitted to the lecturer and it could not be changed. Figure 4 illustrates the qasub process.
There were seven question types. They were (1) Question comparing different concepts; (2) Question requiring an overall view of relationships between all topics learnt; (3) Knowledge question related to reading assignment; (4) Question that requires scientific investigation; (5) Question that requires problem solving; (6) Question that requires critical thinking; (7) Question that requires providing examples. These questions were in the format of open ended questions to gauge the students’ real responses.
The pre-processing procedure included creating four variables containing student name activities and then creating same-type groups of activities. The names of activities were collected from the data in the e-learning's log events. This information is presented in Table 2. The data analysis involved grouping the same sequences of activities. The main goal here was to discover traces in the log events dataset and then to look for similarities between various log events and to group log events with similar patterns. The pattern of the students’ behavior focused on type of questions that were answered first. In the second step, we created and analyzed the process maps using the Disco Miner tools. Juhanak, Zounek and Rohlikova (2019) also used Disco Miner tools to identify the pattern of the students’ interaction when they took quizzes in Learning Management System (Juhanak, Zounek, &Rohlikova, 2019). Process map is used because it could identify less frequent trace variants and could provide clear user-friendly outputs.
Table 2
An overview of pre-processed
quiz activity names in quiz
Quiz activity names |
Abbrev. |
Meaning |
quiz_viewed |
qv |
Student was presented with the front page containing instructions and information about the quiz. |
quiz _attempt_started |
qas |
Student launched an attempt in quiz. |
quiz_attempt_viewed |
qav |
Student was presented with a question page. |
start_attempt_question_number |
saq |
Student started to write the answer on the column provided |
finish_attempt_question_number |
faq |
Student finished to write the answer on the column provided |
quiz_attempt_submitted |
qasub |
Student submitted the quiz attempt to be assessed. |
-----
Table 3
Type of questions
Question number |
Type of question |
1 |
Question comparing different concepts |
2 |
Question that requires an overall view of the relationships between all topics learnt |
3 |
Knowledge question related to reading assignment |
4 |
Question that requires scientific investigation |
5 |
Knowledge question related to reading assignment |
6 |
Question that requires problem solving |
7 |
Question that requires critical thinking |
8 |
Question that requires examples |
9 |
Knowledge question related to reading assignment |
-----
Figure 1
Student was presented with the front page containing
instructions and information about the quiz (qv)

-----
Figure 2
Student launched an
attempt in quiz (qas)
-----
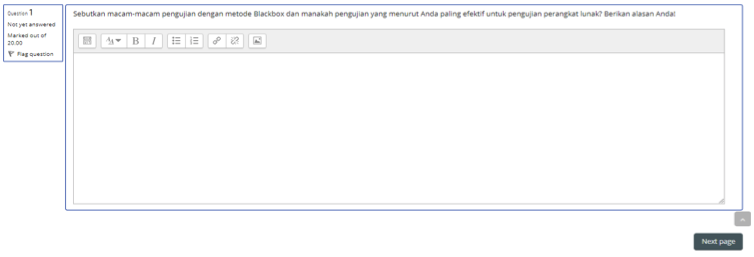
Figure 3
Student was presented with
a question page (qav)
-----
Figure 4
Student submitted the
quiz attempt (qasub)
-----
Figure 5
Quiz taking behavior map
-----
Figure 6
Question Number’s trace variants

-----
Clustering is a process of grouping objects into classes of similar objects (Jain, Murty, & Flynn, 1999). In e-learning, clustering has been used for: finding clusters of students with similar learning characteristics and to promote group-based collaborative learning as well as to provide incremental learner diagnosis. Tang and McCalla (2005) and Romero and Ventura (2007) did full process for mining e-learning data in Moodle system. This study is also to apply clustering algorithm as specific application on learning management systems’ data. In this case study, clustering has been used for: grouping students based on student’s quiz completion time and grades.
In this paper, we used RapidMiner platform because they give benefits for academician: they offer academic license freely and they can use any dataset format as an input (Hofmann & Klinkenberg, 2013). Therefore, there will not be any data format problems. RapidMiner platform is a programming-free data analysis process which allows the user to design data analysis processes and it provides classification, clustering, and association analysis (Ristoski, Bizer, & Paulheim, 2015). The RapidMiner system has several clustering algorithms available. The K-Means is one of the simplest and most popular clustering algorithms (Wan-Lei, Cheng-Hao, & Chong-Wah, 2018). The K-Means has been used in this paper to cluster students based on attributes in the number of k-partitions.
The process mining in this article is using Disco for academic by fluxicon. The result is shown in Figure 5. It presents all trace variants of the quiz taking behavior in the form of process map, which covers the entire process starting from when students choose the order of the question. Each activity and path is supplemented with case frequencies and absolute case frequencies of the given activity or path. The input needed for process mining in this case was only CaseID, Activity and Timestamp. The CaseID was the studentID and the timestamp is when the activity starts and ends.
We have drawn a simple form of process maps from Figure 5 into Figure 6. In Figure 6, the sequence order started at the question number 3 and finished at the question number 5. Each question number consists of different question type as described in Table 3. Most students started and ended with “knowledge question related to reading assignment” question type. Both questions needtheoretical answer from the literature.
Papamitsiou and Economides (2016) and Romero and Ventura (2007) agreed that using process mining to analyze students behavior can reveal and map the learning processes. It could evaluate new learning tools such as e-learning and its impact on the students. Benito, Therón, García-Peñalvo and Lucas (2015) also studied about the behavior patterns which were measured by exploratory analysis but they use it to define whether there is any relationship between the times spent in the virtual world with behavior patterns. Juhanak, Zounek and Rohlikova (2019) researched student’s quiz taking behavior in learning management system to identify whether the students cheated or not. They also used process mining to identify the students’ behavior and successfully classified their students (Juhanak, Zounek, & Rohlikova, 2019). Lerche and Kiel (2018) and Viberg, Hatakka, Balter, and Mavroudi (2018) used log data in learning management systems to predict student’s achievement. He (2013) added in-depth correlation analysis between the number of online questions students asked and students‘final grades. It was followed by Gómez-Aguilar, Hernández-García, García-Peñalvo and Therón (2015) and Hernández-García, Acquila-Natale, Chaparro-Peláez and Conde (2018) who used the log data-based analytics to predict the teamwork group assessment. Meanwhile, Romero and Ventura (2007) have conducted full process data mining in e-learning data such as statistics, visualization, classification, clustering and association rule mining. All of those researchers explored the log data to determine the relationship with the student’s achievement. However, there are no any researchers that use the student’s preference in question type taking behavior patterns.
The novelty in this article is that we use process mining to find the students’ preferences. The results show that the process mining can be used to identify the quiz-taking behavior (the types of question, the order, and the time to complete each question). However, this approach only detects limited variables. The analysis of the learning analytics showed that it is important to know learning analytics to understand the students’ learning experience (Viberg, Hatakka, Balter, & Mavroudi, 2018; Vaganova, Aleshugina, Kutepov, Smirnova, & Chelnokovа ,2019). The analysis of the learning analytics is used to consider whether the teacher should evaluate learning process. Further research will benefit from combining process mining approach with other techniques such as clustering and classification to obtain more detailed information about students’ preference behavior during quiz taking.
The time taken to complete each question was presented in Figure 7. The x-axis of Figure 2 shows question numbers based on Table 4 and y-axis shows times in minutes. Students spent most times on question number 3 (knowledge related to reading assignment) and less time on question number 6 (problem solving). It is out of the expectation that the students did “problem solving question“the least while “knowledge reading assignment“was the longest.
Figure 7
Average time to answer questions
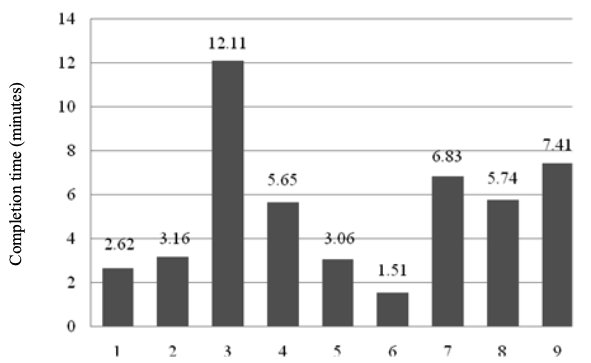
On the other hand, Table 4 shows the number of students who finished answering each question. There were only 54 out of 84 students who finished answering question number 6 (problem solving question). It was followed by question number 3 (overall view of the relationships between topics). There were 76 students who solved the question. The rest of the questions were answered by 80 – 84 students. This may suggest that the question number 6 and 3 were the most difficult questions. This is in line with data in Figure 7 where question number 3 takes the longest time to complete and question number 6 takes the shortest time. Students tried hard to answer the question number 3; thus, the average time was the longest although there were only 76 students. Meanwhile, the question number 6 was the shortest because there were only 54 out of 84 students who answered the question. The remaining students left the questions unanswered. It is concluded that we cannot draw conclusion on which question that is more difficult based on the average time the students spent since we need more in-depth analysis, such as the number of students who managed to answer each question.
Table 4
The number of student who have
managed to answer each question
Question number |
Type of question |
Number of Student |
1 |
Question comparing different concepts |
82 |
2 |
Knowledge question related to reading assignment |
84 |
3 |
Question that requires an overall view of the relationships between all topics learnt |
76 |
4 |
Question that requires scientific investigation |
84 |
5 |
Knowledge question related to reading assignment |
84 |
6 |
Question that requires problem solving |
54 |
7 |
Question that requires critical thinking |
80 |
8 |
Question that requires providing examples |
80 |
9 |
Knowledge question related to reading of assignment |
80 |
Research Question 3: How many clusters are generated from the K-Means Clustering Algorithm?
Before applying K-Means Clustering Algorithm on learning management data, we ran correlation analysis using statistical tool to check the correlation between grades and quiz completion time. As a result of the correlation analysis on Table 5, we found that there is a negative correlation (r=-0.182) between grades and quiz completion time. In other words, for a negative correlation, the variables which were quiz completion time and grade worked opposite each other. The data trend shows that the longer quiz completion time taken, the worse the grades could be, and vice versa. The correlation coefficient used is Pearson's correlation coefficient because the data are interval data.
Table 5
Correlation between the grade
and quiz completion time
|
Quiz completion time |
Grades |
Quiz completion time |
1 |
-0.182692803 |
Grades |
-0.182692803 |
1 |
After correlation analysis has been done, and then K-Means Clustering Algorithm is applied using RapidMiner platform. The number of clusters is determined by Davies Bouldin Index. The clustering algorithm that produces a collection of clusters with the smallest Davies Bouldin Index is considered the best algorithm based on this criterion (Davies & Bouldin, 1979). Clustering performance analysis has been done to identify which number of cluster is the most suitable between k=2; k=3 and k=4. The Davies Bouldin Index for k=2; k=3 and k=4 is illustrated on Table 6. From Table 6, it is shown that k=3 has the smallest Davies Bouldin Index; thus, k=3 is used to be the number of clusters in K-Means Clustering Algorithm.
Table 6
Clustering Performance Analysis
|
The number of centroid |
||
k=2 |
k=3 |
k=4 |
|
Davies Bouldin Index |
-0.316 |
-0.239 |
-0.454 |
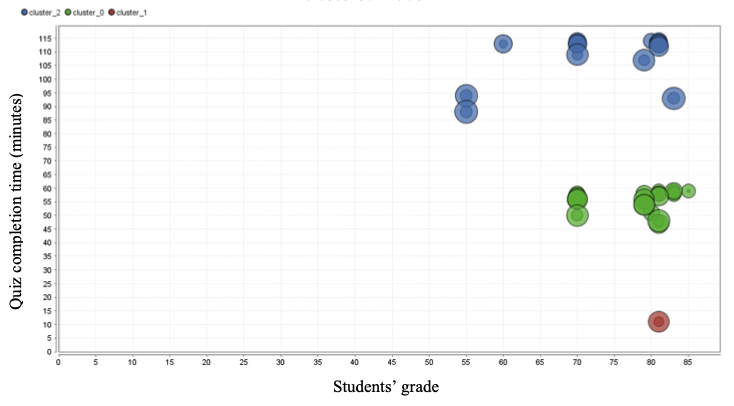
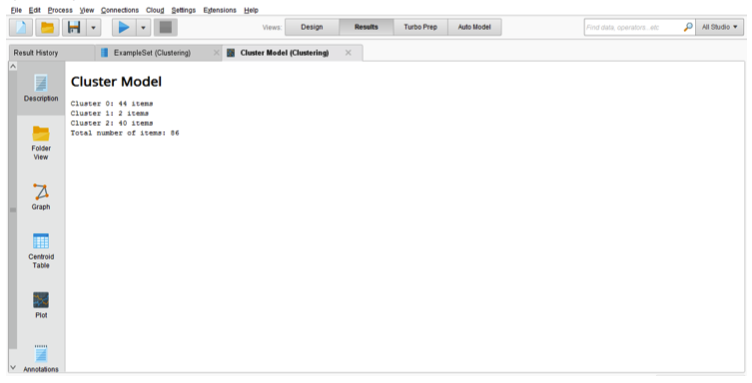
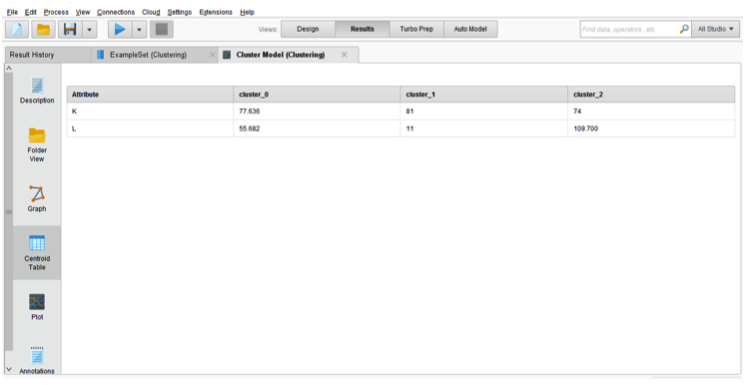
Figure 8 shows that there are three clusters of students. The first “green” cluster has 44 students and the third “blue” cluster has 40 students while the second “red” cluster has only 2 students. The attributes used in the clustering are quiz completion time and grades. Figure 9 describes the number of each cluster. The centroid of the clusters is given in Figure 10. From Figure 8 to Figure 10, those are the result from RapidMiner platform after K-Means Clustering Algorithm has been applied. The Cluster 1 is characterized by students with the average grade is 77.63 out of 100 and the average completion time is 55.68 out of 120 minutes. The Cluster 2 is characterized by students with the average grade is 74 out of 100 and the average completion time is 109.7 out of 120 minutes. But, the Cluster 3 is too different from cluster 1 and cluster 2. The Cluster 3 is characterized by the average grades 81 out of 100, and the average completion time is only 11 out of 120 minutes. From the data given in Cluster 3, it can be detected that the students who are only 2 students on that cluster are the outlier of all the data in the clusters.
The instructor can use this information in order to group the students into three types of students: (1) Above-average students (Cluster 1); (2) Average students (Cluster 2); (3) Outlier students (Cluster 3). Starting from this information, the instructor can identify their students based on the cluster and also identify the outlier students who are suspected of cheating based on the abnormal information on quiz completion time and their grades.
Figure 8
Clustered model
----
Figure 9
The number of clusters
-----
Figure 10
The centroids’ table
Notwithstanding its limitations, the result of this study can be used as an illustration that process mining can be used to identify the students’ preference behavior in e-learning quizzes that may help teachers evaluate learning process. K-Means Clustering Algorithm managed to identify the type of students based on their grades and their quiz completion time. The process visualization using the tools has its advantage to be easily understood by the instructor. Using process mining approach data mining approach such as Clustering in this study would be the first step to develop analytical tool to get better understanding of the students’ quiz-taking behavior.
Benito, J. C., Therón, R., García-Peñalvo, F. J., & Lucas, E. P. (2015). Discovering usage behaviors and engagement in an educational virtual world. Computers in Human Behavior, 47, 18-25.
Davies, D. L., & Bouldin, D. W. (1979). A cluster separation measure. IEEE Transactions on Pattern Analysis and Machine Intelligence, PAMI-1(2), 224–227.
Gómez-Aguilar, D. A., Hernández-García, A., García-Peñalvo, F. J., & Therón, R. (2015). Tap into visual analysis of customization of grouping of activities. Computers in Human Behavior, 47, 60-67.
He, W. (2013). Examining students‘ online interaction in a live video streaming environment using data mining and text mining. Computers in Human Behavior, 29, 90-102.
Hernández-García, A., Acquila-Natale, E., Chaparro-Peláez, J., & Conde, M. A. (2018). Predicting teamwork group assessment using log data-based learning. Computers in Human Behavior, 89, 373-384.
Hofmann, M., & Klinkenberg, R. (2013). RapidMiner: Data mining use cases and business analytics applications. USA: CRC Press.
Jain, A. K., Murty, M. N., & Flynn, P. J. (1999). Data clustering: a review. ACM Computing Surveys, 31(3), 264-323.
Juhanak, L., Zounek, J., & Rohlikova, L. (2019). Using process mining to analyze students’ quiz-taking behavior patterns in a learning management system. Computers in Human Behavior, 92, 496-506.
Kurniawan, C., Setyosari, P., Kamdi, W., & Ulfa, S. (2018). Electrical engineering student learning preferences modelled using k-means clustering. Global Journal Engineering Education, 20(2), 140-145.
Lerche, T., & Kiel, E. (2018). Predicting student achievement in learning management systems by log data analysis. Computers in Human Behavior, 89, 367-372.
Mansur, A. B., & Yusof, N. (2018). The latent of student learning analytic with k-means clustering for student behaviour classification. Journal of Information Systems Engineering and Business Intelligence, 4(2), 156-161.
Nistor, N., & Hernández-García, A. (2018). What types of data are used in learning analytics? an overview of six cases. Computers in Human Behavior, 89, 335-338.
Ozarslan, Y., & Ozan, O. (2016). Self-assessment quiz taking behavior analysis in an online course. European Journal of Open, Distance and e-Learning, 19(2), 16-31.
Papamitsiou, Z., & Economides, A. A. (2016). Process mining of interactions during computer-based testing for detecting and modelling guessing behavior. Proceeding Learning and Collaboration Technologies: Third International Conference (págs. 437-449). Toronto: Springer.
Ristoski, P., Bizer, C., & Paulheim, H. (2015). Mining the web of linked data with rapidminer. Journal of Web Semantics, 35(3), 142-151.
Romero, C., & Ventura, S. (2007). Educational data mining: a survey from 1995 to 2005. Expert Systems with Applications, 33(1), 135-146.
Tang, T., & McCalla, G. (2005). Smart recommendation for an evolving e-learning system. International Journal on e-learning, 4(1), 105-129., 4(1), 105-129.
Vaganova O. I., Aleshugina E. A., Kutepov M. M., Smirnova Z. V., & Chelnokovа E. А. (2019). Modern educational technologies to arrange students’ independent work at the university. Revista Espacios. 40(12), 21. Retrieved from: https://www.revistaespacios.com/a19v40n12/a19v40n12p21.pdf
Viberg, O., Hatakka, M., Balter, O., & Mavroudi, A. (2018). The current landscape of learning analytics in higher education. Computers in Human Behavior, 89, 98-110.
Wan-Lei, Z., Cheng-Hao, D., & Chong-Wah, N. (2018). K-Means: a revisit. Neurocomputing, 291, 195-206.
Watering, G., Gijbels, D., Dochy, F., & Rijt, J. (2008). Students’ assessment preferences, perceptions of assessment and their relationships to study results. High Education, 56, 645-658.
1. Faculty of Vocational Studies, Universitas Airlangga, Surabaya, Indonesia. Contact e-mail: nasazatadina@vokasi.unair.ac.id
2. Faculty of Vocational Studies, Universitas Airlangga, Surabaya, Indonesia. Contact e-mail: rachmansinatriya@vokasi.unair.ac.id
[Index]
revistaespacios.com

This work is under a Creative Commons Attribution-
NonCommercial 4.0 International License