![]() ISSN 0798 1015
ISSN 0798 1015

![]() ISSN 0798 1015
ISSN 0798 1015
Vol. 41 (Issue 05) Year 2020. Page 5
MORA, Otto A. 1; FIGUEROA, Miguel A. 2; VELOSA, Claudia N. 3 & ALFONSO, Daniel F. 4
Received: 29/08/2019 • Approved: 30/01/2020 • Published 20/02/2020
ABSTRACT: This paper identified the influence of the road quality in terms of the International Roughness Index – IRI on fuel consumption and gas emissions generated by typical vehicles in the city of Barranquilla, Colombia. The calculation of fuel consumption and emissions with the IRI was performed for three different scenarios varying the pavement macrotexture value. The results show that there is a direct relationship between IRI value and full consumption and gas emission. |
RESUMEN: Este artículo determinó la influencia de la calidad de las vías, en términos del Índice Internacional de Rugosidad – IRI, en el consumo de combustible y las emisiones de gases a la atmósfera generadas por vehículos típicos en Barranquilla, Colombia. El cálculo del consumo de combustible y emisiones en relación con el IRI se realizó para tres escenarios diferentes variando la macrotextura del pavimento. Los resultados muestran que hay una relación directa entre el valor del IRI, el consumo de combustible y la emisión de gases. |

The current investigation intends to evaluate the impact of the pavement roughness on the fuel consumption of the vehicles that transit in Barranquilla, and to quantify the CO2-eq emissions to the atmosphere caused by the fuel consumption given the pavement conditions (irregularities) and other variables will be subsequently defined.
In cost analysis over the life cycle of a pavement, operational costs play an important role, since they occur throughout the entire design period of the road, which normally ranges from 15 to 20 years (Crespo, Parra, Gómez, López, & González-Prida, 2012). A fundamental variable in the operational costs is the fuel consumption of the vehicles, since the operation of their engines, depends on having enough motive power to overcome variables that are opposed to the bearing, such as the inclination of the terrain, rolling resistance, air resistance among others (Loijos, 2011).
Fuel consumption is influenced by variables such as vehicle technology, pavement conditions, road geometry, environmental conditions, among others (Zaabar & Chatti, 2014). Given fuel consumption is a representative value of the operational costs of vehicles, changes in one of the variables, for example, in the surface irregularity of the pavement, cause these costs to increase and, in the same way, the emissions of greenhouse gases to the atmosphere.
The issue of global warming and climate change is real and is affecting the planet. The transportation sector had 27% of greenhouse gas emissions by 2013 or nearly one-third of the total greenhouse gas emissions in the USA (EPA, 2015). Therefore, different alternatives that take care of the environment and promote sustainable socio-economic development should be sought.
The main purpose of this research is to determine the influence of surface irregularities of the pavement on fuel consumption and gas emissions to the atmosphere Barranquilla.
Roughness: The roughness of the pavement refers to all those alterations of the longitudinal road profile, which cause vibrations in the vehicles (Radović, Jokanović, Matić, & Šešlija, 2016). The internationally accepted parameter that measures roughness in the pavement is the International Roughness Index (IRI), proposed by the World Bank in 1986 to assess the users' perception of the surface condition of the pavement.
The International Roughness Index (IRI) is defined as the accumulation of vertical movement suffered by the suspension of a wheel (a quarter of a car) traveling at a reference speed of 80 km / h. Indeed, it is the comfort of the rolling index that constitutes the parameter of the perceived path by the user (Caro & Peña, 2012).
The IRI can be obtained with any equipment that measures the roughness of a pavement. There are types of equipment that can use static or dynamic character methodologies to obtain the pavement profile. The equipment, with static character methodologies, such as topography or dipstick, offers precision but demands a lot of time and high costs. On the other hand, dynamic ones, such as profiling and response types of equipment, offer higher performance but are less precise (Fernandez & Reyes, 2011).
The IRI is used as an estimated value of users comfort passing through the tracks, for this reason, it is very useful when pavement management analysis is done, it is already used as an indication of the serviceability of the roads (Goenaga, Fuentes, & Mora, 2017).
In the Westrack program, developed by the United States Highway Federation (FHWA), it was determined that for trucks, the fuel consumption is directly proportional to the roughness of the pavement where they travel (Mitchell, 1996). Similar conclusions are obtained by comparing the roughness of a post-rehabilitation pavement, with a smooth surface and before the rehabilitation, with a rough surface, where the trucks use 4.5% less fuel/km after the intervention in the tread layer (Beuving, De Jonghe, Goos, Lindahl, & Stawiarski, 2004).
Slip resistance: Slip resistance is defined as the force that resists relative movement between a vehicle tire and a pavement surface (Losa & Papagiannakis, 2014).
The strength of resistance is characterized by the coefficient of friction (dimensionless), μ, which is defined as the ratio of the tangential friction force (F) between the tire and the horizontal surface and the perpendicular force or vertical load (FW) (NCHRP, 2009).
The TRB (Transportation Research Board) in its national cooperative highway research program report number 286, states that an IRI reduction of 2m / km (10% reduction in slip resistance) can reduce fuel consumption expenses from 1 to 2 percent for typical vehicles (Keating & Fisher, 1986). This savings is equivalent to 6 to 12 gallons per year (Chatti, 2010).
Macrotexture: The Macrotexture of the pavement surface considers deviations from the pavement surface regarding a truly flat surface. These deviations occur at three different levels of scale, each defined by the wavelength (λ) and the peak-to-peak amplitude (A) of its components (Hall, Smith, & Littleton, 2009). The three texture levels established by the PIARC (1987) are as follows:
• Microtexture (λ <0.02 in, A = 0.04 to 20 thousandths of an inch)
• Macro-texture (λ = 0.02 to 2 in, A = 0.005 to 0.8 in)
• Mega texture (λ = 2 to 20 in, A = 0.005 to 2 in)
The macrotexture in the pavement can be measured through the parameter MPD (Mean profile depth), which is measured with the equipment called Circular Track Meter and can also be measured through the parameter MTD (Mean texture depth), through the sand patch test (EAPA & Eurobitume, 2004). A rugged macrotexture can increase fuel consumption by 7% compared to a very smooth macrotexture (Beuving et al., 2004).
The project began with research on the state of the art of current models that allow predicting the consumption of combustible vehicles depending on the surface characteristics of the pavement. Within this investigation, empirical simple models, which were few robust and integrated very few variables were found. Mechanistic models were also found. These models are very important because they integrate many variables and they are related to pavement surface conditions (Martínez & Pérez, 2015). These models are so-called VOC (Vehicle Operating Cost).
The VOC models have been developed for approximately 30 years by different entities such as the World Bank and Transport Departments of different countries, among the most used are the United States, Australia, and Great Britain. The purpose of these models is to know the costs associated with owning a vehicle, operating it and maintaining it, including the consumption of fuel generated and other maintenance specific to the vehicle's conditions. The most current VOC model found in the literature is the HDM-4 model developed by the World Bank, which is a mechanistic-empirical model and expresses fuel consumption (Zaabar & Chatti, 2014).
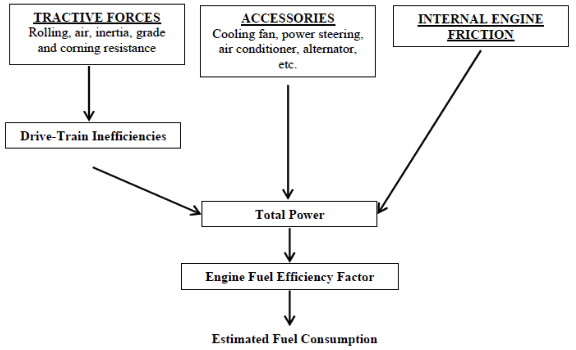
Finally, within the models reviewed in the literature, the HDM 4 model is the most complex and describes the largest number of variables, including the roughness of the pavement (through its associated indicator the IRI), the pavement state, curvature of the track, air resistance, engine power, among others (Jiao, 2015). These characteristics of the model make it especially useful to solve the objectives set out in this research. Other uses of this model could be to suggest conclusions in decision making in maintenance and prioritization of sections of roads in such a way that the user perceives a good service within the expected operating costs (Harral, Smith, Paterson, & Queiroz, 2011).
In the following image, we can see a flow of steps that are applied in the HDM-4 model.
Figure 1
Flow chart HDM-4 Model (Jiao, 2015)
The second stage of the research aims to quantify greenhouse gas emissions into the atmosphere, product of fuel consumption that is caused by the different states of the roads.
The Intergovernmental Panel on Climate Change (IPCC), developed the concept of Global Warming Potential (GWP, for its acronym in English), with this is intended to compare the ability to trap heat from a greenhouse gas concerning another gas. The reference gas used is CO2, and the emissions are measured, usually in millions of metric tons of CO2 equivalent (MMT CO2 eq.) (EPA, 2015).
The conversion of the kilotons of a certain gas to millions of metric tons of CO2 equivalent is done as follows:
![]()
Where:
MMTCO2: Millions of metric tons of CO2 equivalent
kt: kilotons of a certain gas
GWP: Global warming potential
The study of these emissions quantities that are related to the vehicles' fuel will allow evaluating different scenarios between maintenance costs of roads as well as the emissions and fuel consumption savings in terms of these road improvements.
For the development of the investigation, it was necessary to obtain profiles of rigid pavements of urban roads in Barranquilla city, therefore, we use a 'Walking Profile', called SurPRO, which allows obtaining the pavement profile and calculating the IRI value of the section under study. It was repeated in 84 sections Barranquilla city, obtaining the following results.
Table 1
IRI Values obtained from urban
roads in Barranquilla, Colombia
City |
Total |
Range IRI |
Average IRI |
(m/km) |
(m/km) |
||
Barranquilla |
84 |
3.24 – 18.25 |
6.52 |
Then, the HDM – 4 (Road User Cost) spreadsheet obtained from the World Bank was calibrated. Next, IRI from 3 to 18 m/km was added with an increase of 1 m/km and, the fuel consumption value in Liters/100 km was calculated for the following fleet of vehicles, these fleets are typical in Colombia cities (IDU, 2009):
Table 2
Typical vehicles fleet in
Colombia cities (IDU, 2009)
VEHICLE |
DESCRIPTION |
Motorcycle |
Two-wheeled vehicle driven by a motor. It carries up to two people. |
Passage car up 1.500 CC |
Light vehicle type sedan of no more than 1500 c.c. of the cylinder. |
Passenger car 1.500 to 2.500 CC |
Vehicle with a cylinder that varies between 1500 c.c to 2500 c.c. |
Passenger car more than 2.500 CC |
Vehicle with a cylinder capacity greater than 2500 cc |
Truck C2P |
Small 2-axle truck |
Truck C2G |
Large 2-axle truck |
Truck C3 |
3-axle truck |
Bus up 19 Pax |
Small bus used to transport up to 19 passengers |
Bus 20 to 49 Pax |
Bus used to transport between 19 to 49 passengers |
Bus more than 50 Pax |
Bus used to transport more than 50 passengers |
This process was repeated for the following macrotexture scenarios(HDM-4, 2010):
Table 3
Values of macrotexture
in rigid Pavement
Surface texture |
Depth Texture MTD (mm) |
Rigid Pavement |
|
Good |
0.7 |
Regular |
0.5 |
Slippery |
0.3 |
It was done to assess the impact of the macro-texture on vehicle fuel consumption. The HDM - 4 was calibrated for a tropical environment typical of a coastal city, more specifically for flat terrain with an average speed of 40 km / h, as in most urban environments. Alternative parameters such as the front area of vehicles, the characteristics of vehicle engines, among others, were left by default.
Once the fuel consumption was calculated, the emissions (g / km) for each vehicle were determined, these were in terms of:
• Carbon dioxide - CO2
• Carbon monoxide - CO
• Hydrocarbon - HC
• Nitrous oxide - NOx
• Particles - Par
• Sulfur dioxide - SO2
• Lead – Pb
With the carbon dioxide (CO2) and Nitrous Oxide (NOx), the global warming potential - GWP was calculated, considering a warming potential of 1 for CO2 and 298 for NOx. (Green House Protocol, 2015).
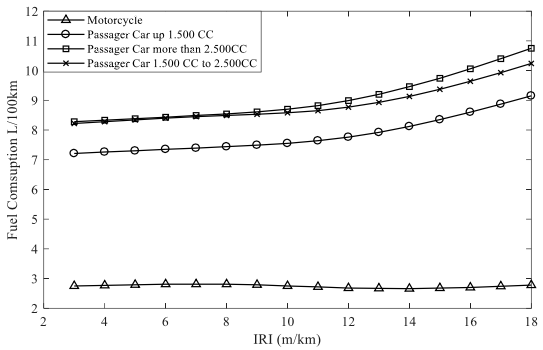
Below are the results of fuel consumption in L / 100 km for the different typical vehicles of Barranquilla city with a BAT macrotexture equal to 0.7, characteristic of pavement with good macrotexture.
Figure 2
Result of Fuel consumption for urban
roads in Barranquilla, Colombia. Part A.
-----
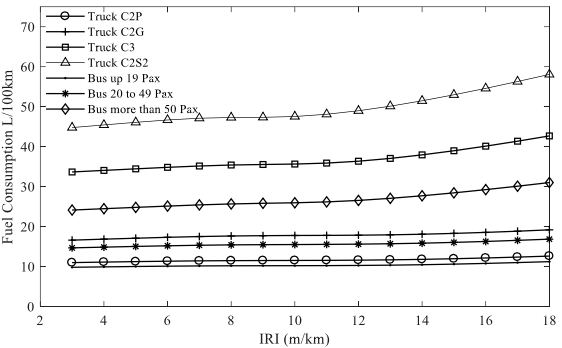
Figure 3
Result of Fuel consumption for urban
roads in Barranquilla, Colombia. Part B.
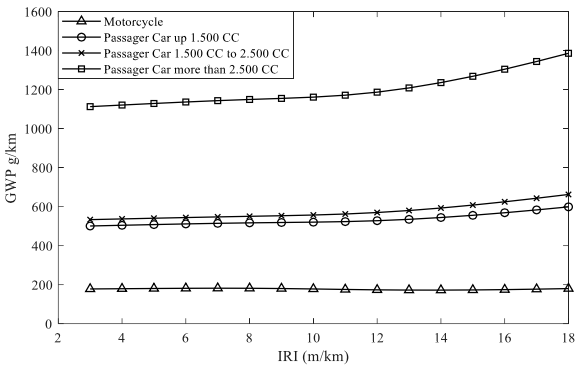
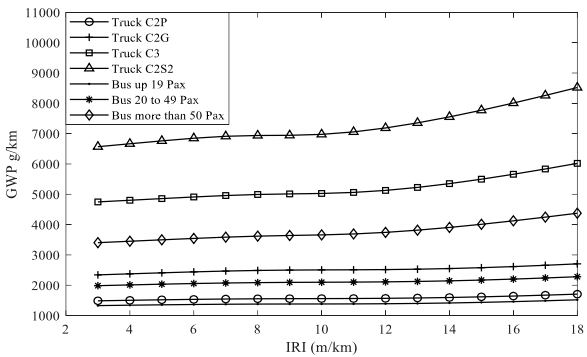
The following are the emissions in terms of Global Warming Potential - GWP in units of g / km for the different typical vehicles of Barranquilla city with a BAT macrotexture equal to 0.7, characteristic of pavement with good macrotexture.
Figure 4
Result of GWP for urban roads
in Barranquilla, Colombia. Part A
-----
Figure 5
Result of GWP for urban roads
in Barranquilla, Colombia. Part B
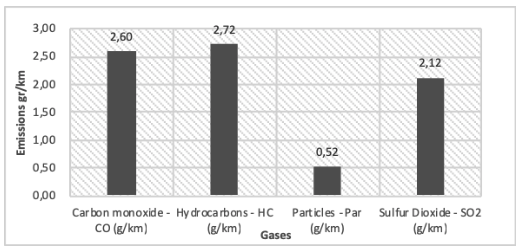
The gases that have the highest amount of emissions in all vehicles are carbon dioxide CO2 and nitrous oxide NOx, which were already considered in the previous results for the calculation of the GWP. However, other gases with lower emissions can be obtained; For example, the following shows the number of additional gases emitted by a large bus (bus more than 50 pax) on a road with an IRI roughness of 6 m / km.
Figure 6
Emissions other gases in Bus more
than 50 Pax for IRI of 6 m / km
Additionally, fuel consumption and emissions were calculated with the other macrotexture scenarios (MTD 0.5 and 0.3). As result, in terms of the macrotexture, it was found that as it decreases, in other words, as the surface of the pavement became smoother, fuel consumption and emissions declined, which means, fuel and emissions are reduced. However, this reduction was found in the order of less than 1%, which is minimal, allowing to conclude the insignificance of this variable in fuel consumption and emissions.
As the main conclusion of the article, the influence of road quality on the fuel consumption of the different typical vehicles of the city of Barranquilla is demonstrated, as evidenced in the results, as the value of the IRI increases, that is, as the route has more irregularities, the fuel consumption grows. In the case of the motorcycle, it remains a little constant, this may be since this vehicle is very easy to move and go faster in urban environments than the big vehicles.
Likewise, it was obtained that by increasing the value of the IRI, CO2 equivalent emissions increased for all types of vehicles.
In terms of the macrotexture, it was found that as it decreases, that is, the surface of the pavement became smoother, fuel consumption and emissions get smaller, which means, fuel and emissions are saved. However, this saving is of the order of less than 1%, which makes this variable insignificant in the analysis carried out.
The highest gas emissions (grams/km) of the vehicles correspond to carbon dioxide CO2 and nitrous oxide NOx, which are gases that increase global warming. Due to this, environmentally friendly alternatives should be sought, to reduce greenhouse gases to the atmosphere and thus not continue to affect the planet.
The results of this article in terms of fuel consumption and emissions may be used in future research and projects that are developed in the urban environment of Barranquilla
In turn, this analysis will allow evaluating different scenarios between maintenance costs of roads and the number of emissions and fuel consumption saved due to these road improvements.
Finally, for future investigations, it is recommended to apply this analysis for the case of flexible pavement and also to analyze what happens with the other gases emitted by the vehicles, although they do not have much effect on the global warming, they can affect human health, flora, fauna, water and air quality.
Beuving, E., De Jonghe, T., Goos, D., Lindahl, T., & Stawiarski, A. (2004). Fuel efficiency of road pavements. In Proceedings of the 3Rd Eurasphalt and Eurobitume Congress Held Vienna, May. Retrieved from http://ovidsp.ovid.com/ovidweb.cgi?T=JS&PAGE=reference&D=tspt&NEWS=N&AN=E121571
Caro, F., & Peña, G. A. (2012). Análisis y criterios para el cálculo del Índice de Rugosidad Internacional (IRI) en vías urbanas colombianas que orienten la elaboración de una especificación técnica. Intekhnia, 7(1), 57–72.
Chatti, K. (2010). Effect of Pavement Conditions on Rolling Resistance and Fuel Consumption. Pavement Life Cycle Assessment Workshop, 49. Retrieved from http://www.ucprc.ucdavis.edu/P-LCA/pdf/08_rollingresistance_web.pdf
Crespo, A., Parra, C., Gómez, J. F., López, M., & González-Prida, V. (2012). Life cycle cost analysis. Asset Management: The State of the Art in Europe from a Life Cycle Perspective, 9789400727(September), 81–99. https://doi.org/10.1007/978-94-007-2724-3_6
EAPA, & Eurobitume. (2004). Environmental Impacts and Fuel Efficiency of Road Pavements Fuel economy and environmental emissions of road pavements. (March). Retrieved from https://eapa.org/wp-content/uploads/2018/07/fuel_efficiency_executive.pdf
EPA. United Stated Environmental Protection Agency. (2015). Sources of Greenhouse Gas Emissions. Retrieved from Climate Change website: http://www.epa.gov/climatechange/ghgemissions/sources/transportation.html
Fernandez, W., & Reyes, F. (2011). Estimacion del IRI a partir del análisis estocastico de la superficie del pavimento. Congresso Ibero-Latinoamericano Do Asfalto, 9. Rio de Janeiro, Brasil: XVI CILA – Congreso Ibero-Latinoamericano del Asfalto.
Goenaga, B., Fuentes, L., & Mora, O. (2017). Evaluation of the methodologies used to generate random pavement profiles based on the power spectral density: An approach based on the international roughness index. Ingenieria e Investigacion, 37(1), 49–57. https://doi.org/10.15446/ing.investig.v37n1.57277
Green House Protocol. (2015). Global Warming Potential Values. Greenhouse Gas Protocol, 2014(1995), 2–5.
Hall, J., Smith, K., & Littleton, P. (2009). Texturing of concrete pavements (634th ed.). Transportation Research Board.
Harral, C., Smith, G., Paterson, W., & Queiroz, C. (2011). Maintaining road assets (p. 71). p. 71. Transport Research Support.
HDM-4. (2010). Highway Development and Management Model. Retrieved from http://www.hdmglobal.com/
Instituto De Desarrollo Urbano (IDU). (2009). Evaluación de costos de usuario de acuerdo a las intervenciones que realiza el instituto en Bogotá D.C. Bogota D.C.
Jiao, X. (2015). Effect of Pavement-Vehicle Interaction on Highway Fuel Consumption and Emission (Florida International University. Miami, Florida). https://doi.org/10.25148/etd.FIDC000142
Keating, P. B., & Fisher, J. W. (1986). Evaluation of fatigue tests and design criteria on welded details (National cooperative highway research program report).
Loijos, A. (2011). Life Cycle Assessment of Concrete Pavements: Impacts and Opportunities. Master of Science Thesis of The Engineering System Division. Massachusetts Institute of Technology, Cambridge.
Losa, M., & Papagiannakis, T. (2014). Sustainability, Eco-efficiency, and Conservation in Transportation Infrastructure Asset Management. CRC Press.
Martínez, M., & Pérez, I. (2015). Mechanistic-empirical pavement design guide: Features and distinctive elements. Revista de La Construccion, 14(1), 32–40. https://doi.org/10.4067/S0718-915X2015000100004
Mitchell, T. (1996). Westrack: The Road to Solutions. Public Roads, 60 No 1, 23–25.
NCHRP. (2009). Guide for Pavement Friction. In National Cooperative Highway Research Program. https://doi.org/10.17226/23038
Radović, N., Jokanović, I., Matić, B., & Šešlija, M. (2016). Mjerenje hrapavosti kolnika kao indikator stanja cestovne mreže - Studija slučaja Srbija. Tehnicki Vjesnik, 23(3), 881–884. https://doi.org/10.17559/TV-20150212204747
Zaabar, I., & Chatti, K. (2014). A field investigation of the effect of pavement type on fuel consumption. Sustainability, Eco-Efficiency and Conservation in Transportation Infrastructure Asset Management - Proceedings of the 3rd International Conference on Tranportation Infrastructure, ICTI 2014, 541–548. https://doi.org/10.1201/b16730-80
1. MSc Assistant Professor. Department of Civil and Environmental Engineering. Universidad de la Costa. Civil Engineering. omora@cuc.edu.co
2. MSc Assistant Professor. Department of Civil and Environmental Engineering. Universidad de la Costa. Civil Engineering. mfiguero12@cuc.edu.co
3. MSc. Civil Engineering. claudiavelosap@gmail.com
4. Civil Engineering. dfalfonso7@gmail.com
[Index]
revistaespacios.com

This work is under a Creative Commons Attribution-
NonCommercial 4.0 International License