![]() ISSN 0798 1015
ISSN 0798 1015

![]() ISSN 0798 1015
ISSN 0798 1015
 Vol. 41 (Number 06) Year 2020. Page 26
NURJANNAH, HAFIDZAH 1; MARDIANTY, DESY 2; HAYATI, RESTU 3 & SUSANTI, EFI 4
Received: 13/08/2019 • Approved: 18/02/2020 • Published: 27/02/2020
ABSTRACT: University graduates must be prepared to compete with each other regarding the increasing number of graduates each year. For this reason, universities must provide excellence for the graduates so that they will be noticed by stakeholders who will accept them as workers. The purpose of this research is to optimize the quality of universities in Indonesia, especially Riau Province, based on students’ perspectives. This research also aims to provide several responses to improve the quality of the universities. Eight private universities in Riau Province were selected as samples by using the cluster sampling method with a total of 400 students. This study applied Kano Model and Quality Function Deployment (QFD) approach as an integration tool that can help gather Voice of Customer (VoC) and produce a matrix of priority needs and technical responses in the form of House of Quality. The results of this study found eight priority needs, including the availability of e-library access, the ease in using the internet, adequate computer labors, lecturers adhering to the predetermined lecture schedules, an easy filling in online KRS, academic staffs who were responsive to complaints, academic staffs who serve patiently, and the communication of academic staff which runs smoothly in serving the students. In addition, the college management can take several steps to optimize the quality like monitoring the learning process. |
RESUMEN: Los graduados universitarios deben estar preparados para competir entre sí con respecto al creciente número de graduados cada año. Por esta razón, las universidades deben proporcionar excelencia a los graduados para que sean notados por las partes interesadas que los aceptarán como trabajadores. El propósito de este estudio fue optimizar la calidad de las universidades en Indonesia, especialmente Riau, en función de las perspectivas de los estudiantes y proporcionar varias respuestas para mejorar la calidad. Ocho universidades privadas en la provincia de Riau fueron seleccionadas como muestras utilizando el método de muestreo por conglomerados con un total de 400 estudiantes. Este estudio aplicó el enfoque de Despliegue de funciones de modelo y calidad de Kano (QFD) como una herramienta de integración que puede ayudar a reunir la Voz del cliente (VoC) y producir una matriz de necesidades prioritarias y respuestas técnicas en forma de House of Quality. Los resultados de este estudio encontraron ocho necesidades prioritarias, incluida la disponibilidad de acceso a la biblioteca electrónica, la facilidad de uso de Internet, el trabajo informático adecuado, los profesores que se adhieren a los horarios predeterminados de conferencias, un KRS fácil de completar en línea, personal académico que fue receptivo a las quejas, el personal académico que atiende con paciencia y la comunicación del personal académico que funciona sin problemas en el servicio a los estudiantes. Además, la administración de la universidad puede tomar varios pasos para optimizar la calidad, como monitorear el proceso de aprendizaje. |

The Higher Education Institute in Indonesia is currently showing a very rapid development, especially for private universities which are supported by the number of universities in Indonesia, which has reached 4,570 in 2018. This becomes an opportunity for the community to get a proper higher education and is certainly a threat to universities to compete. To compete, the universities are required to be competitive by providing service excellence as unique experiences in learning (Khodayari, 2011) and building up the internet facilities (Nurjannah, 2019). Although studies and innovations are the competition in the work of higher education, the Higher Education Institutes are expected to provide high quality services (Yousapronpaiboon, 2014). Therefore, to improve the quality of education, managements college staffs can assess the quality of services provided to students (Pohyae et al., 2016) by comparing the performance of universities with other local and foreign universities.
Generally, universities always strive to provide high qualities in terms of educational curricula and administrative processes, for example in the learning process (the material delivered is in accordance with the development of the latest science and is needed by the community). Meanwhile, in terms of administration, academic staffs always attempt optimally to serve students such as being on time in carrying out administration in accordance with the standards set by the university.
Regarding the quality in education services, the education curriculum and administrative process are not the main factors that can improve the quality of higher education, but are the facilities and infrastructure, academic systems, students’ competencies, research and community service carried out by lecturers and involving students what is fundamental. For this reason, to compete and to maximize students’ satisfaction with the services provided, the college management team must prioritize students as the main clients and should try to make continuous improvements in order to produce competent and competitive graduates.
This research helped college managements in determining attributes becoming the students’ needs and expectations so that these attributes can be priority things that must be improved to satisfy students as the main clients. One of the tools used to improve service quality and to satisfy customers’ expectations is Quality Function Deployment (QFD) with the help of the House of Quality (HoQ) matrix.
The objects in this study were students registered at private universities in Riau. The sample selection was conducted by using probability sampling method with random sampling technique. The sample size was determined proportionally based on the student population of each private university. In 2018 in Riau were about 400 students at Universitas Islam Riau, Universitas Lancang Kuning, Universitas Muhammadiyah Riau, Universitas Pasir Pangaraian, Universitas Islam Kuantan Singingi, Universitas Islam Indragiri, and Universitas Abdurrab.
The main instrument of this study was a questionnaire. This study implemented the Integration analysis of Kano Model and Quality Function Deployment (QFD) by designing House of Quality. The steps are the following:
Table 1
Kano’s Evaluation Table
Customer Requirement |
Disfunctional |
|||||
Like |
Must-be |
Neutral |
Live with |
Dislike |
||
Functional |
Like |
Q |
A |
A |
A |
O |
Must-be |
R |
I |
I |
I |
M |
|
Neutral |
R |
I |
I |
I |
M |
|
Live with |
R |
I |
I |
I |
M |
|
Dislike |
R |
R |
R |
R |
Q |
|
Source: Berger et al cited in Wang & Jay, 2010
Khamseh (2011) classifies six categories of Kano method of a product; they are:
Customers’ satisfaction will highly increase as the performance of attributes increases. However, the decline in the performance of attributes will not cause a decrease in the level of satisfaction.
The level of customers’ satisfaction is linearly related to the performance of attributes so that the high performance of attributes will result in high customers’ satisfaction.
Customers will not be satisfied if the performance of these attributes is not achieved. However, customers’ satisfaction will not increase even though the performance of the attributes is high.
Customers’ satisfaction is not influenced by the results of the performance of attributes
The level of customers’ satisfaction is inversely proportional to the results of the performance of attributes.
Answers from customers (respondents) are unclear or not according to the questions provided.
The rules in Blauth's formula were applied to specify the categories for each variable or Kano’s Weight (Walden, 1993), they are stated as below:
If the amount of scores (one dimensional + attractive + must be) > total scores (indifferent + reserve + questionable), the grade is the maximum score obtained from (one dimensional + attractive + must be).
If the amount of scores (one dimensional + attractive + must be) < total scores (indifferent + reserve + questionable), the grade is the maximum score obtained from (indifferent + reserve + questionable).
If the amount of scores (one dimensional + attractive + must be) = total scores (indifferent + reserve + questionable), the grade is the maximum score among all Kano categories, namely (one dimensional, attractive, must be and indifferent, reserve, questionable).
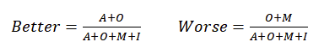
Calculating Better and Worse scores. Better indicates how much customers’ satisfaction increases if we provide the features (A&O). Whereas, worse indicates how much the customers’ satisfaction decreases if we do not provide features (O&M). Worse and Better can be calculated by the following formula:
The next step was to create a House of Quality. The first part of HOQ is a matrix of consumers’ needs that contains the attributes of the consumers’ voice, the level of importance and the Kano weight of each attribute. To compile HOQ, the following steps are required:
GAP = Expectation - Perception
AI = Kano’s Weight x GAP x Importance Level
The first step in data processing by using Kano method was to categorize respondents' answers into Kano categories by matching respondents' answers to functional questions and dysfunctional questions. After that, the answers were mapped with Kano categories, in which the determination of categories based on respondents' answers can be seen in the following table:
Table 2
Kano Model for Quality Evaluation
No. |
Items |
Category |
Weight |
1 |
Adequate classroom facilities (tables, chairs, blackboards, air conditioners, in focus) |
O |
2 |
2 |
Adequate Health facilities |
M |
1 |
3 |
Adequate sport activities facilities |
M |
1 |
4 |
Adequate library facilities (books, proceeding journals, dan articles). |
O |
2 |
5 |
Availability of e-library access |
A |
4 |
6 |
Ease of internet Access |
O |
2 |
7 |
Adequate computer laboratorium |
A |
4 |
8 |
Availability of parking facilities |
O |
2 |
9 |
The availability of clean prayer rooms/ mosques and toilets. |
A |
4 |
10 |
Teaching is in accordance with the Semester Learning Plan (RPS). |
O |
2 |
11 |
Lecturers obey the specified lecture schedule. |
A |
4 |
12 |
Assessment methods and procedures are carried out transparently and subjectively. |
O |
2 |
13 |
The exam is conducted based on the schedule presented in the Academic Calendar. |
M |
1 |
14 |
The result of the exam is announced on time no later than 2 weeks after the exam. |
M |
1 |
15 |
Registration procedures and payment of tuition are clear. |
O |
2 |
16 |
The process of filling online KRS is very easy for students. |
O |
2 |
17 |
Academic information is easily obtained, fast, and accurate. |
O |
2 |
18 |
As an academic supervisor, lecturers can assist students in solving learning problems. |
O |
2 |
19 |
The lecturer can guide in completing the final project / students' thesis well. |
O |
2 |
20 |
Academic administrative staffs are responsive to handle students’ complaints and requests regarding administrative services. |
A |
4 |
21 |
E-Learning |
M |
1 |
22 |
The campus environment (there is a security and CCTV) is clean and comfortable. |
O |
2 |
23 |
Academic administrative staffs serve sincerely, kindly, and patiently. |
A |
4 |
24 |
Lecturers obey the rules that have been set. |
M |
1 |
25 |
The communication between academic administration staffs and students goes well and smoothly. |
A |
4 |
26 |
Students can interact with lecturers outside the lecturing hours well. |
I |
0 |
Note:
A = Attractive
O = One Dimensional
M = Must-be
I = Indifferent
Table 2 demonstrates that Grade O (One Dimensional) is a very crucial attribute that needs to be prioritized by the college management because the level of students’ satisfaction is linearly related to the attribute performances. If the universities provide/ focus on these attributes, students’ satisfaction will increase while if the college does not provide or does not focus on these attributes, it will cause a decrease in students’ satisfaction. There are 12 attributes that belong to the O category.
Then, there are 7 attributes in grade A (Attractive) which means that the attributes included in this category need to be maintained because the level of students’ satisfaction will be very high as the increasing of attribute performance. However, the decrease in attribute performance will not cause a decrease in the level of students’ satisfaction.
Furthermore, there are 6 attributes in grade M (Must-be) in which the attributes in this category are still considered necessary by students because students become dissatisfied if the concerned attributes performance is low.
Grade I (Indifferent) only contains 1 attribute in which the attribute in this category is less noticed by students so that the presence or absence of this attribute will not affect the increase or decrease of the level of students’ satisfaction.
This analysis was utilized to get the Adjusted Importance value which was used to get the priority value of technical requests needed by universities in order to improve service qualities. These results are seen in table 3:
Table 3
Student’s Needs Priority
No. |
Attribute |
KW |
I |
GAP |
AI |
1 |
Availability of e-library access |
4 |
4,31 |
-1,26 |
21,70 |
2 |
Adequate computer laboratorium |
4 |
4,55 |
-1,03 |
18,70 |
3 |
Academic administrative staffs are responsive in handling complaints and students’ requests related to administrative services. |
4 |
4,36 |
-1,04 |
18,17 |
4 |
Academic administrative staffs serve sincerely, kindly and patiently. |
4 |
4,47 |
-0,98 |
17,47 |
5 |
Lecturers adhere to the set lecture schedules. |
4 |
4,52 |
-0,88 |
15,98 |
6 |
The process of filling out online KRS is very easy for students. Obeying the lecture schedules that is set. |
2 |
4,64 |
-1,60 |
14,80 |
7 |
Ease of internet access |
2 |
4,64 |
-1,48 |
13,75 |
8 |
The communication between academic administration staffs and students runs smoothly. |
4 |
4,35 |
-0,77 |
13,32 |
KW = Kano’s Weight, I = Importance, AI = Adjusted Importance
These technical requirement were obtained through interviews with higher education institutions whose status was higher than those of the universities being researched as benchmarking.
Table 4
Technical Responses were Priority
No. |
Technical Requirement |
Priority |
% |
1 |
Monitoring the teaching and learning process |
887,2 |
17,3 |
2 |
Improvement technology and internet facilities |
753,6 |
14,7 |
3 |
Improving the service of academic processes |
724,6 |
14,1 |
The percentage of priorities in technical demand was obtained through a matrix relationship between the priority needs and the priority of technical requests indicated by the higher institution.
This matrix explains what the technical parameters are and how universities can provide what is expected by students.
Figure 1
House of Quality
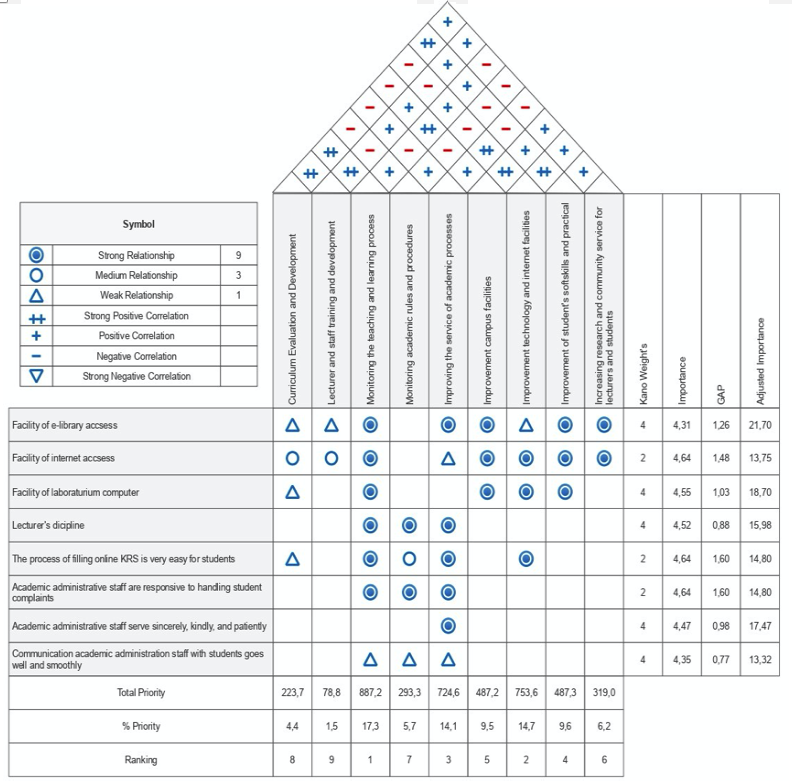
Figure 1 displays the matrix of the relationship between students’ priority needs with the priorities of technical requests which is marked by symbols
with a value of 9 (strong relationships), with a value of 3 (medium relationship), and with a value of 1 (weak relationship). The relationship between students’ priority needs with the priorities of technical requests is known as Interrelation Matrix. The interrelation matrix functions as a material consideration for improving the quality of services undertaken by universities in order to increase students’ satisfaction. Whereas the Technical Correlation Matrix, often called a roof, shows the relationship between attributes in technical demand.
The priority attributes of customer needs are crucial components in designing HoQ. A series of priority needs will have a great effect on the development of a product. The HoQ matrix explains some of the attributes that are prioritized by the students’ needs that can be used by Higher Education Institute as materials for the improvement that must be done, for example:
Higher Education must provide e-library access in order that students can easily obtain the necessary information quickly. Colleges must work with several journal publishers to make it easier for students to download the necessary journals.
Universities must have a strong internet network so that students can find the information needed.
The universities provide computers with updated specifications and complete the maintenance regularly so that students can learn best.
The college management periodically checks the presence of lecturers on time, whether the lecturers follow the applicable regulations, work according to procedures, and use facilities properly.
To make it easier for students to fill in the courses to be taken, the lecturer must publish the scores on time. The universities must ensure and provide punishment to lecturers who are late in inputting the scores into the system. In addition, it is needed to ensure the IT department to input the coming courses two weeks before the lecture begins.
The university management can assess the performance of academic administrative staffs through student satisfaction surveys and provide rewards to administrative staffs who have exceeded standard performance.
Universities must manage the performance of academic staffs such as helping to develop the academics and professionalism and providing information about institutions to monitor and assess the performance based on academic rules, procedures and job descriptions.
The integration of Kano model towards Quality Function Deployment is one of the Total Quality Management (TQM) analysis tools that can be used to optimize the quality of universities currently. The HoQ matrix gets several points for optimizing the quality that can be implemented in Private Universities.
Garibay, C., Gutiérrez, H., Figueroa, A., 2010. Evaluation of a Digital Library by Means of Quality Function Deployment ( QFD ) and the Kano Model. J. Acad. Librariansh. 36, 125–132.
Khamseh, Arshadi. 2011. Integrating Kano's Model into Quality Function Deployment (QFD) to Optimally Identify and Prioritize the Needs of Higher Education (case study: Engineering Faculty of Tarbiat Moallem University). Institute of Interdisciplinary Business Research.
Khodayari, Faranak ; Khodayari, B., 2011. Service Quality in Higher Education. Interdiscip. J. Res. Bus. 1, 38–46.
Nurjannah, Hafidzah; Mardianty, D., 2019. Integrasi Model Kano ke Dalam QFD untuk Mengoptimalkan Kualitas Perguruan Tinggi di Provinsi Riau. COSTING J. Econ. Bus. Account. 3, 136–144.
Pohyae, S., Romle, A.R., Darus, M., Saleh, N.H., Saleh, S.S., Khairul, S., Mohamood, B., 2016. The Relationship Between Service Quality and Student Satisfaction : The Case of International Students in Public University 34, 491–498.
Qureshi, Muhammad Imran, et all., 2012. Quality Function Deployment in Higher Education Institutes of Pakistan Quality Function Deployment in Higher Education Institutes of Pakistan. Middle-East J. Sci. Res. 8, 1111–1118.
Wang, T., Ji, P., 2010. Understanding customer needs through quantitative analysis of Kano ’ s model. Int. J. Qual. Reliab. Manag. 27, 173–184.
Yousapronpaiboon, K., 2014. 5 th World Conference on Educational Sciences - WCES 2013 SERVQUAL : Measuring higher education service quality in Thailand. Procedia - Soc. Behav. Sci. 116, 1088–1095.
Zohir, Arief, et all., 2017. Integrasi Metode SERVQUAL, QFD, dan Kano untuk Meningkatkan Kualitas Pelayanan pada Perguruan Tinggi IAIM NU Kota Metro. Jurnal rekavasi 5, 10–17.
1. Department of Management. Universitas Islam Riau. Indonesia. Email: hafidzahnurjannah@eco.uir.ac.id
2. Department of Management. Universitas Islam Riau. Indonesia
3. Department of Management. Universitas Islam Riau. Indonesia
4. Department of Accounting. Universitas Islam Riau. Indonesia
[Index]
revistaespacios.com

This work is under a Creative Commons Attribution-
NonCommercial 4.0 International License