![]() ISSN 0798 1015
ISSN 0798 1015

![]() ISSN 0798 1015
ISSN 0798 1015
Vol. 41 (Issue 07) Year 2020. Page 28
VOROZHBIT , Elena G. 1; VYSKREBENTSEVA, Anna S. 2 & KOZHEVNIKOV, Evgeny B. 3
Received: 20/11/2019 • Approved: 14/02/2020 • Published 05/03/2020
ABSTRACT: The article presents the forecasting of profitability indicators of an enterprise, which are the criteria for assessing the risk of a tax audit. The calculations showed the presence of tax risks in terms of profitability. Predicting the level of profitability and undertake timely measures to correct them will eliminate the likelihood of an on-site tax audit falling into the “risk zone”. The authors believe that forecasting profitability will allow timely adjustments to the intragroup pricing system and minimize tax risks. |
RESUMEN: El artículo presenta el pronóstico de los indicadores de rentabilidad de una empresa, que son los criterios para evaluar el riesgo de una auditoría fiscal. Los cálculos mostraron la presencia de riesgos fiscales en términos de rentabilidad. Predecir el nivel de rentabilidad y las medidas oportunas para corregirlos eliminará la probabilidad de que una auditoría fiscal en el sitio caiga en la "zona de riesgo". Los autores creen que pronosticar la rentabilidad permitirá ajustes oportunos al sistema de precios intragrupo y minimizará los riesgos fiscales. |

An important factor in the stable functioning of participants is the business structure; one of the most significant is tax risk. (C. Cozmei, E. Şerban,2004). There are several objective reasons for their occurrence. One of these reasons is a field tax audit (M. Mulyadi, 2015). As a rule, tax agents have financial losses.To reduce them, it is necessary to predict the occurrence of risk and take measures to reduce the degree of risk.
The topic is especially relevant for a group of companies, which is usually represented by business entities applying various taxation systems (special tax regimes).
The aim of this work is to forecast the profitability of sales and the return on assets of business entities using the regression equation, and to optimize the intra-group turnover in order to exclude them from being at risk of a field tax audit.
The study used general scientific and special research methods: analysis, comparison, generalization, as well as probabilistic and statistical methods.
The theoretical and methodological base of the study was composed of regulatory acts of the Ministry of Finance of the Russian Federation in the field of control measures, scientific works of domestic and foreign authors in affected areas of science.
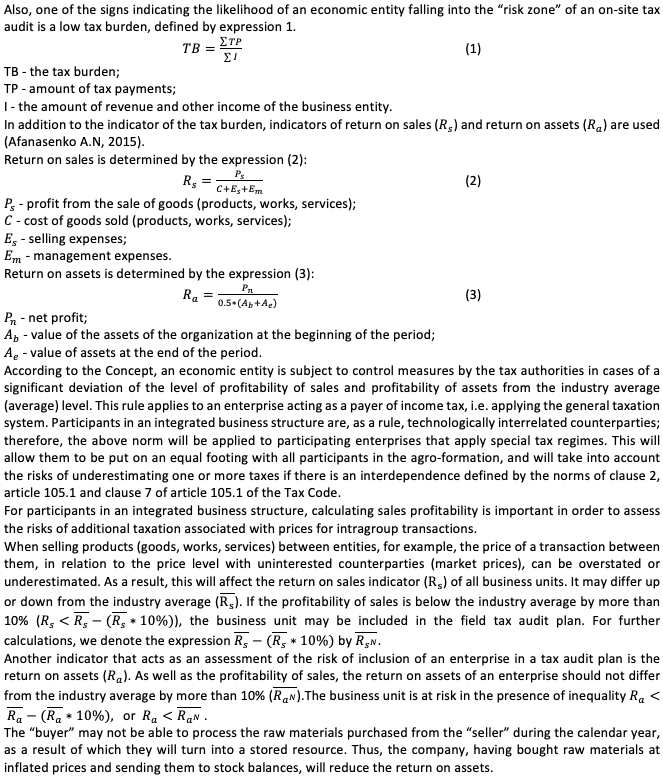
The criteria by which an economic entity can independently assess tax risks and determine the likelihood of inspections is presented in the Order of the Federal Tax Service of the Russian Federation of 05.30.2007 (hereinafter referred to as the Concept).
The concepts established 12 key criteria for rejection taxpayers for the provision of control measures (Borovinsky V.A., 2017; Edronova V.N., 2013).
The condition requirements are managed and unmanaged.
A low VAT burden can be corrected by reducing the share of deductions to a safe level by transferring deductions of value added tax to subsequent tax periods.
It is possible to control the criteria of approaching the threshold value, which gives taxpayers the right to apply special tax regimes: a simplified taxation system (STS) (Article 346.12 of the Tax Code of the Russian Federation, Article 346.13 of the NKRF), a unified agricultural tax (USCH) (Article 342.6 The Tax Code of the Russian Federation), the single tax on imputed income (UTII) (Article 346.26 of the Tax Code of the Russian Federation), the patent system of taxation (Clause 5 of Article 346.43 of the Tax Code, Clause 6 of Article 346.45 of the Tax Code)
A loss in reporting resulting from the activities of a taxpayer (tax agent) may also attract attention from representatives of tax authorities. To avoid falling into the “risk zone” of a tax audit according to this criterion, for example, choose the way of submitting break-even declarations by reducing the amount recognized in tax accounting expenses. The legislation does not contain a direct ban on the provision of “break-even” tax returns.
In the next calendar year, raw materials and materials that have become much more expensive will become one of the possible reasons for reducing the profitability of sales of the business unit of the customer.
When analyzing the return on assets of a business unit of a “seller", attention should be paid to intragroup receivables. Its presence may be associated with minimization of the tax burden and the transfer of tax payments to subsequent tax periods.
The problem of determining the level of profitability can be solved by predicting the ratios and then adjusting intra-group operations in order to achieve their safe value.
The most common and simple method of forecasting is extrapolation, i.e. extension of trends in the past to the future.
One of the most popular methods for modeling trends is the analytical alignment of the time series, which is the finding of an analytical function characterizing the dependence of the levels of the series on time (Zamkov O.O., 1998).
Automatic generation of future values will be based on trend calculations. The initial data representing time series for calculations will be ![]() and
and ![]() .
.
For practical verification of the correctness of the proposed approach, we will use the data of one integrated business structure. This group of companies represents a vertical agro-industrial integration of economic entities specializing in the production of grain raw materials, its industrial processing and the manufacture of flour, pasta, cereals and feed for farm animals.
The first and second business units are engaged in industrial processing of grain, and also have grain production. They apply the general taxation system and are also payers of the single tax on imputed income.
The third business unit provides intermediary services in the field of trade in agricultural products. It applies a simplified taxation system.
The fourth business unit is engaged in the production of grain, applies the unified agricultural tax.
Based on the industry to which the business units relate, indicators ![]() and
and ![]() are posted on the website of the Federal Tax Service of the Russian Federation. The data are presented in the table 1.
are posted on the website of the Federal Tax Service of the Russian Federation. The data are presented in the table 1.
Table 1
Selection of rows for
forecasting indicators
Business unit |
Row name |
|
2012-2016 |
beginning with 2017 |
|
Business unit 1 Business unit 2 |
Production of food products, including beverages, and tobacco. |
Production of food products. |
Business unit 3 |
Wholesale trade, including trade through agents, in addition to trade in motor vehicles and motorcycles. |
Wholesale trade, except for wholesale trade in motor vehicles and motorcycles. |
Business unit 4 |
Agriculture, hunting and forestry. |
Plant growing and livestock, hunting and the provision of appropriate services in these areas. |
Source: compiled by the authors
Profitability for business-units 1 and 2 over the past 5 years is presented in table. The calculation is presented in table 2.
Table 2
Return on sales and return on assets for business
units 1 and 2 for the period from 2014-2018
Index |
2014 |
2015 |
2016 |
2017 |
2018 |
|
11,1 |
10,1 |
10,2 |
10,7 |
9,6 |
|
6,8 |
6,1 |
5,1 |
7,0 |
8,4 |
Source: compiled by the authors
Profitability for business-units 3 and 4 over the past 5 years is presented. The calculation is presented in table 3.
Table 3
Return on sales and return on assets for
business-unit 3 and 4 for the period from 2014-2018
Index |
2014 |
2015 |
2016 |
2017 |
2018 |
|||||
3 |
4 |
3 |
4 |
3 |
4 |
3 |
4 |
3 |
4 |
|
|
10,5 |
11,7 |
9,4 |
6,3 |
10,3 |
18,4 |
9,8 |
21,3 |
7,3 |
16,8 |
|
7,8 |
4,8 |
7,4 |
2,5 |
4,4 |
5,7 |
6,4 |
7,4 |
6,0 |
6,8 |
Source: compiled by the authors
The guideline in choosing the regression equation for return on sales and return on assets for each enterprise will be the determination coefficient ![]() and the correspondence of the calculated value to the actual one.
and the correspondence of the calculated value to the actual one.
The determination coefficient ![]() shows the degree to which the trend model matches the source data. Its value can range from 0 to 1. The closer
shows the degree to which the trend model matches the source data. Its value can range from 0 to 1. The closer ![]() to 1, the more accurately the model describes the available data. Since
to 1, the more accurately the model describes the available data. Since ![]() is influenced by extraneous factors, it does not allow a final conclusion about the correctness of the selected equation and, accordingly, can lead to erroneous conclusions.
is influenced by extraneous factors, it does not allow a final conclusion about the correctness of the selected equation and, accordingly, can lead to erroneous conclusions.
As can be seen from the tables until 2019, the tax inspectorate, when calculating the return on assets and return on sales, was guided by more general (enlarged) codes of economic activity.
Since 2019, the IFTS has used a narrower approach, which significantly affected the profitability indicators. Therefore, the other criterion in the selection of the trend equation is the maximum approximation of the calculated indicators to the actual data of ![]() and
and ![]() for 2019
for 2019
The result of calculating the regression equations K and K1 with a reference to the sectoral result of 2019 is presented in table 4.
Table 4
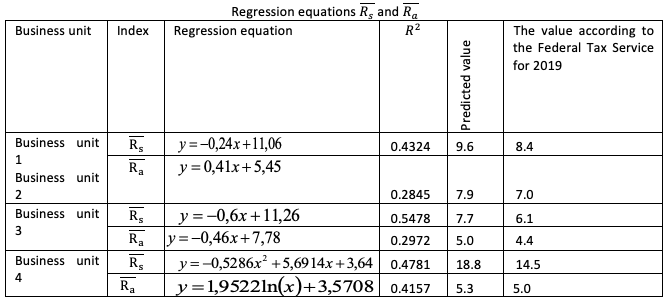
Source: compiled by the authors
-----
Table 5
Calculation of the threshold value of indicators of return on sales /
return on assets for participants in an integrated business structure
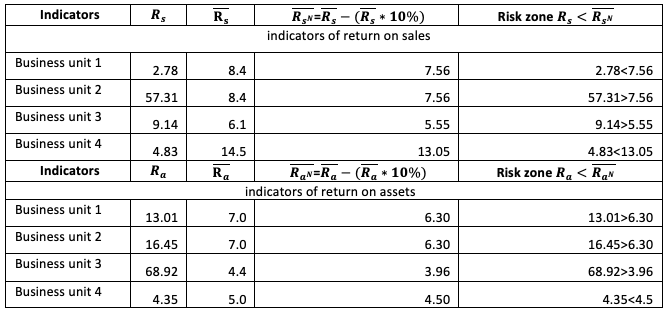
Source: compiled by the authors
According to the table 5, it is clear that the first and fourth business units are in the “risk zone” of the tax audit according to criterion ![]() . According to criterion
. According to criterion ![]() , business unit 4 falls into the “risk zone” of the field tax audit.
, business unit 4 falls into the “risk zone” of the field tax audit.
It is necessary to align the indicators, which should ultimately lead to the elimination of the risk of an on-site tax audit in relation to business unit 1. Simultaneously with this task (main), other tasks should be solved:
a) Business unit 2, as well as business unit 1, is on the general taxation system. The risks of an on-site tax audit based on profitability criteria also apply to it. Therefore, when solving the main problem, the adjusted indicators of profitability should not be lower than standard (industry) values;
b) The results obtained in solving the main problem should not allow a critical approach to the threshold value, which gives the right to business units 3 and 4 to apply special tax regimes;
c) The tax burden of business units should not increase significantly;
d) The solution of the main task should not lead to a significant increase in the overall group level of the tax burden.
The formulated tasks can be solved by adjusting the price of goods (semi-finished products), work (services) involved in the domestic turnover of the agricultural formation under consideration. Let business unit 1 increase by 0.50 rubles the price of wheat bran and grain wastes supplied to business unit 2 for the production of animal feed. To the same value, it will increase the price of baking flour sold by the third business unit.
Business unit 4 also increases the cost of wheat by 0.5 rubles supplied for flour production to business unit 2.
In turn, business unit 2 reduces by 0.50 rubles the cost of services for the storage and processing of grain provided to a business unit 4.
Assessing the risks of including a business unit in an on-site tax audit plan, an analysis of adjusted prices for transactions between participants in an integrated business structure was conducted for their compliance with market ones. For this, the method of comparable market prices was used (article 105.7. Part 1 of the Tax Code of the Russian Federation). It is used by tax authorities as a priority method in determining whether prices correspond to market prices for transactions between related parties.
Its essence is that the controlled price is in the range of market prices. This interval is set in accordance with paragraph 3 of art. 105.9 of the Tax Code of the Russian Federation and is the range that allows to exclude from the sample the minimum and maximum values. In our case, transaction prices correspond to market prices.
The adjusted rate of return on assets is denoted by ![]() , and the return on sales by
, and the return on sales by ![]() . The results are presented in table 6.
. The results are presented in table 6.
Table 6
The result of the impact of price changes on intragroup
transactions on return on sales / return on assets
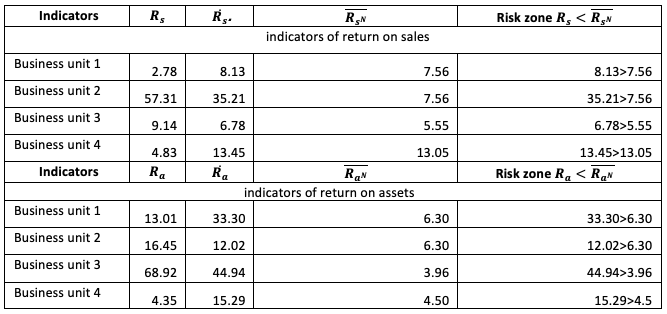
Source: compiled by the authors
The data presented in table 6 show that the price adjustment made it possible to equalize profitability indicators and remove business unit 1 from the risk zone of the tax audit.
Next, we analyze how the tax burden has changed as a result of adjusting prices for transactions between participants in an integrated business structure.
We calculate the tax burden for each business unit using expression 1, we present the data obtained in table 7. To analyze the data obtained, we denote by TBN the normative value of the tax burden, through T'B the tax burden obtained after adjusting the intra-group transactions.
Table 7
The result of the effect of price changes
on intragroup transactions on the tax burden
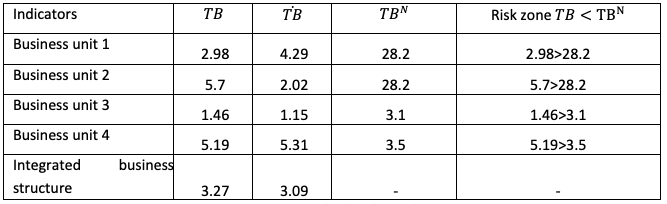
Source: compiled by the authors
The data presented in table 7. show that the change in prices for intragroup transactions led to an increase in the tax burden of business unit 1 by 1.31 percentage points (4.29% -2.98%). At the same time, the tax burden of business unit 2 is reduced by 3.68 percentage points. (2.02% -5.7%). For the third and fourth business units, changes in the tax burden are not significant. The level of tax burden as a whole for the integrated structure is marked by a slight decrease.
As can be seen from the management of such indicators as “return on assets” and “return on sales”, in order to reduce tax risks in an integrated structure, a worthy place should be assigned in the management system, both at the level of an individual enterprise and the corporation as a whole.
Thus, forecasting return on sales and return on assets using regression equations will reduce the risks of an on-site tax audit for participants in an integrated business structure and optimize intra-group operations.
A time series model has been selected for each business unit, which can be used in the construction of forecast calculations for subsequent tax periods.
The presented results can be used in the process of intra-group pricing in integrated business structures and will help minimize tax risks.
An important feature is that industry average indicators (tax burden by type of economic activity, profitability of sold goods, products, works, services and return on assets of the organization by type of economic activity, are updated by the Federal Tax Service of Russia closer to the middle of the year, which essentially deprives maneuver in managing financial and economic indicators and makes it difficult to predict tax risks.
Afanasenko A.N.(2015) Low profitability threshold and field audits // Finance and Credit. - 2015.- No. 12. - P. 49-54.
Borovinsky V.A., Vasilyeva N.V. Poverinova E.M.(2017) Criteria for assessing tax risks // Development of a strategy for social and economic security of the state. Materials of the III All-Russian Correspondence Scientific and Practical Conference. 2017 .-- P. 14-17.
Cătălina Cozmei and Elena Claudia Şerban (2004) Risk management triggers: from the tax risk pitfalls to organizational risk // Procedia Economics and Finance, 2004 № 15 P. 1594 – 1602
Edronova V.N., Podolyako M.N. (2013) Problems of planning the planning of field tax audits and ways to solve them [text] // International Accounting. 2013. - No. 9. - P. 24-37.
Martin Surya Mulyadi, Yunita Anwar (2015) Corporate Governance Earnings Management and Tax Management // Procedia - Social and Behavioral Sciences, 2015 № 177 p. 363 – 366
Zamkov O.O., Tolstopyatenko A.V., Cheremnykh Yu.N.(1998) Mathematical methods in economics: textbook / O.O. Zamkov, A.V. Tolstopyatenko, Yu.M. Cheremnykh. - M.: Moscow State University. M.V. Lo-monosova, Publishing house "DIS", 1998. - 368 p.
1. Altai State University. Department of Economics, Associate Professor, Barnaul, Russia, vorozhbit@mail.ru
2. Altai State University. Department of Economics, Associate Professor, Barnaul, Russia, vasfas@mail.ru
3. «Lokot» LLC. Deputy head, Barnaul, Russia, Evgeny-2004@NGS.RU
[Index]
revistaespacios.com

This work is under a Creative Commons Attribution-
NonCommercial 4.0 International License