![]() ISSN 0798 1015
ISSN 0798 1015

![]() ISSN 0798 1015
ISSN 0798 1015
Vol. 41 (Nº 14) Año 2020. Pág. 4
ACEVEDO ARANGO, Héctor D. 1; BECERRA AREVALO, Jairo A. 2; GUISAO USUGA, Fabián D. 3
Recibido: 15/05/2019 • Aprobado: 19/04/2020 • Publicado 23/04/2020
ABSTRACT: In the literature, the relation between corporate governance and enterprise value has been extensively studied, and has been found to be positive. However, it is assumed that the impact of improvements in corporate governance practices and enterprise value is homogeneous for any company. We developed a logit model with interactions per country and sector which makes it possible to find the probability of improving the Tobin’s Q when the MILA corporate governance index (MCGI) rises. We found statistically significant evidence that the probabilities differ for the sectors and countries studied. |
RESUMEN: La relación entre el gobierno corporativo y el valor de la empresa ha sido ampliamente estudiada, y se ha encontrado que es positiva; sin embargo, se asume que el impacto de las mejoras en las prácticas de gobierno corporativo y el valor de la empresa es homogéneo para cualquier compañía. Para este estudio se desarrolla un modelo logit con interacciones por país y sector que permite encontrar la probabilidad de mejorar la Q de Tobin cuando aumenta el índice de gobierno corporativo MILA (MCGI). Se encuentra evidencia significativa de que las probabilidades difieren para los sectores y países estudiados. |

Corporate governance is defined as the set of systems, regulations, and incentives to prevent possible fraud generated from conflicts of interest. Two types of conflicts of interest can arise: between managers and shareholders, and between majority and minority shareholders. In the case of Latin America, where ownership is highly concentrated, the second type applies (OECD, 2004b) . Good practices of corporate governance by the organizations and appropriate regulation by the government are some of the Organization for Economic Co-operation and Development (OECD) recommendations for economic growth (OECD, 2004a). Through the implementation of these practices, it is possible to have more access to financing, less costs of capital, better performance of the organizations, and more advantageous treatment for stakeholders (Claessens & Yurtoglu, 2013). Nunez, Onate, and Mendes de Paula (2009) state that corporate governance adds value to the company, decreases stock price volatility, favors international capital mobility, and reduces reputational risk.
The relation between corporate governance and enterprise value has been well studied in the literature from the creation of corporate governance indexes. These studies have been carried out in countries such as South Korea (Black, Jang, & Kim, 2006a) and the United States (Brown, Robinson, & Caylor, 2004; Gompers, Ishii, & Metrick, 2003); and for Latin America, in Colombia (Gutiérrez & Pombo, 2009), Peru (Fuenzalida, Mongrut, Arteaga, & Erausquin, 2013), Chile (Leal & Carvalhal-da-Silva, 2005), and others. It has been found that there is a positive and statistically significant relation between corporate governance practices and enterprise value. We confirmed these results for the Latin American Integrated Market (MILA) (Agreement between the Santiago Stock Exchange, the Colombia Stock Exchange, the Lima Stock Exchange, and the Mexican Stocks Exchange which aims for the integration of the equity markets) by developing the MILA Corporate Governance Index (MCGI). We found a positive relation between the MCGI and the Tobin’s Q through a lineal regression model with interactions per country (Anonymous, 2016).
Black, Hang, and Kim (Black, Jang, & Kim, 2006b) find that corporate governance decisions arise from different reasons such as increase of enterprise value, control of company decisions, and guarantee of long-term profitability. A company could make the decision of implementing improvements in corporate governance practices according to the different indexes in order to increase enterprise value. There exists evidence of the positive connection between corporate governance and enterprise value within markets in general. However, it is not considered that improvements in the corporate governance practices of each company could affect differently its enterprise value measured by the Tobin’s Q. We developed a logit model with interactions, which determines the probability of increase of the Tobin’s Q when the MCGI grows depending on the sector and country to which the company belongs. This constitutes an innovative finding since the indexes reported in the literature assume that the impact of corporate governance practices is homogeneous for the different economy sectors, while our model offers information for decision making on the probabilities of success of increasing the enterprise value if the MCGI improves, knowing the country and sector to which the company belongs. We found that the companies belonging to materials and consumer staples sectors have higher probability of increasing the Tobin’s Q when the MCGI increases, while financial sector have lower probability.
The database and the MILA corporate governance index (MCGI) construction are described in Anonymous (2016). We will merely summarize them here. The MCGI was built from the surveys filled out in 2013 by the selected companies belonging to the Chilean, Colombian, and Peruvian stock markets (This index was developed only for Chile, Colombia, and Peru since Mexico was not part of this market in 2013, year in which this study was conducted.) how is seen in Table 1.
Table 1
Sample by sector and country
Sector |
Chile |
Colombia |
Peru |
Total |
Consumer discretionary |
3 |
1 |
* |
4 |
Consumer staples |
4 |
2 |
1 |
7 |
Energy |
1 |
1 |
1 |
3 |
Financial |
3 |
11 |
2 |
16 |
Healthcare |
2 |
* |
* |
2 |
Industrial |
6 |
5 |
2 |
13 |
Information technology |
1 |
* |
* |
1 |
Materials |
3 |
9 |
9 |
21 |
Telecommunication services |
1 |
* |
* |
1 |
Utilities |
7 |
4 |
2 |
13 |
Total |
31 |
33 |
17 |
81 |
Source: Own creation, with R software
The companies composing the IPSA 40 index were selected for Chile; the companies of high and medium liquidity, for Colombia; and the companies belonging to the INCA index, for Peru. The sample ensures that a large portion (over 70 %) of the market capitalization of MILA for 2013 is included. Moreover, control variables (Table 2) were added to purify the effect of the corporate governance in the Tobin’s Q.
Table 2
Control variables
Variables |
Definition |
Tobin’s Q |
(Market value of assets)/(book value of assets) |
EBITDA margin (EM) |
(Earnings before interest, taxes, depreciation and amortization)/Sales |
Assets turnover (AT) |
Sales/Assets |
ROA |
Return on assets |
Turnover (TO) |
The number of shares traded for a period |
ROE |
Return on equity |
3yrROE |
3-year average return on equity |
3yrSales |
3-year average sales growth |
Assets |
Total assets |
Profit margin (PM) |
Net profit/Sales |
Operating margin (OM) |
Operating profit/Sales |
D/A |
Debt to assets ratio |
3yrAssets |
3-year average asset growth rate |
Market cap(Size) |
Market value of equity |
Sector (S) |
Industrial sector |
Source: Own creation
After an analysis of residuals standardized to 5 % and considering that the information of some companies could not be collected, the sample of this study takes 73 of the 81 companies included in the initial sample.
The model that showed greater goodness of fit and, therefore, becomes baseline for this study is a linear regression with interactions per country and different control variables (Table 2), given by the equation:
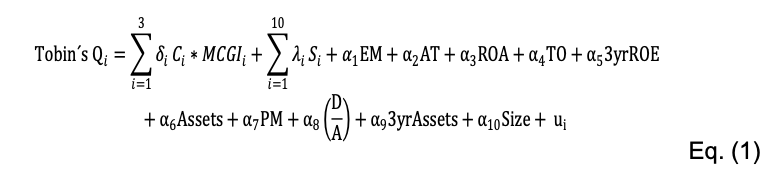
Source: Own creation
According to the R2, the goodness of fit of the model is 0.77 and the coefficients of the interactions associated with the MCGI are positive and statistically significant for the three countries (Table 3).
Table 3
Lineal regression model by
interactions and control variables
Dependent variable: Tobin´s Q |
|||
MCGI*Colombia |
0.677(0.00)* |
Materials |
0.046(0.75) |
MCGI*Chile |
0.798(0.02)* |
EM |
0.008(0.09)** |
MCGI*Peru |
0.525(0.03)* |
AT |
0.454(0.02)* |
Consumer discretionary |
0.547(0.02)* |
ROA |
0.078(0.00)* |
Consumer staples |
0.021(0.92) |
TO |
4.9E-08(0.54) |
Healthcare |
0.564(0.05)** |
3yrROE |
-0.005(0.28) |
Telecommunication services |
-0.475(0.20) |
Assets |
2.38E-06(0.56) |
Energy |
-0.760(0.16) |
PM |
-0.006(0.39) |
Industrial |
-0.053(0.76) |
D/A |
0.001(0.96) |
Information technology |
0.064(0.86) |
3yrAssets |
0.002(0.53) |
Utilities |
0.014(0.928) |
Size |
0.169(0.13) |
R2 |
0.769 |
||
Log Likelihood |
-2.98 |
||
Observations |
73 |
||
Level of significance * (5 %), ** (10 %) |
|||
Source: Own creation, with R software
The probit, gompit, and logit models are a dichotomous models used in problems associated with decision making when economic agents face a binary choice process. In this specific case, the model is implemented in the decision that the company makes to implement or not to implement corporate governance practices that improve the MCGI, thus increasing its Tobin’s Q.
This study focuses on a non-linear approach. By using these models, our interest is to identify the companies that generate Y=1 versus the Y=0 alternative, understanding Y=1 if the Tobin’s Q of the (i) company is above the average of the (i) sector in the MILA (and Y=0 if it is under the average). Y’s dichotomous value will depend on the MCGI of the country to which the company belongs, the sector, and the control variables. These exogenous variables will be represented as vector of variables X∙β ̂=Z_i (Table 4). The results for the three models are shown in the following table.
Table 4
Logit model variables
X1 |
MCGI |
X10 |
Assets |
X2 |
Colombia |
X11 |
3yr sales |
X3 |
Chile |
X12 |
PM |
X4 |
Peru |
X13 |
ROE |
X5 |
Financial |
X14 |
Consumer discretionary |
X6 |
Industrial |
X15 |
Size |
X7 |
Materials |
X16 |
OM |
X8 |
Utilities |
X17 |
EM |
X9 |
Turnover/1000000 |
|
|
Source: Own creation, with R software
We selected the most appropriate model based on the criteria of the R^2 McFadden goodness of fit, the log likelihood, Akaike, Schwarz, and Hannan Quinn. All of them indicate to us that the most appropriate model for our estimation is the logit model (Table 5).
Table 5
Probit, Gompit and
Logit estimates
Criteria |
Probit |
Logit |
Gompit |
McFadden R-squared |
0,691 |
0,699 |
0,677 |
Akaike info criterion |
1,072 |
1,062 |
1,090 |
Schwarz criterion |
1,808 |
1,798 |
1,826 |
Hannan-Quinn criter. |
1,362 |
1,352 |
1,380 |
Log likelihood |
-12,843 |
-12,513 |
-13,425 |
Source: Own creation, with R software
For the logit model, we have P(Y=1)=f(X∙β ̂ )=f(Z_i ), then the log-likelihood function is:
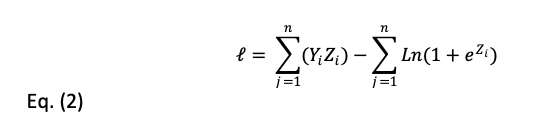
Maximum likelihood estimators β1,…,βk are obtained using the maximization of (2). The equation associated with the logistic distribution function is then:
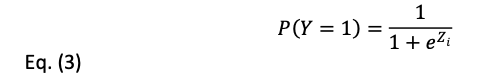
here P_i is the probability of a MILA company to increase Tobin’s Q if the MCGI rises; and [1-P_i ] is the probability that it does not happen. The values of this probability move within (0,1). It tends to 0 when Z_i~-∞; and it tends to 1 when Z_i~∞.
We developed a logit model with interactions. This estimation allows us to differentiate effects per country and/or per sector, since increases in the MCGI do not have the same effects for the different countries of the MILA (Anonymous, 2016). Companies belonging to the sectors of telecommunication services, information technology, healthcare, and energy were excluded from the estimation because there were no data for the three countries (Table 1).
The results of the estimation in Table 6 show that the MCGI coefficient is positive and statistically significant at a level of 10 %; interactions between MCGI and the countries are also significant at a level of 10 %; whereas interactions between MCGI and the sectors were significant for the utilities, materials, and industrial sectors at a level of 10 %. The logit model fit is 0.69 according the McFadden’s R2.
Table 6
Logit model results
Exogenous variables |
Coefficients |
Exogenous variables |
Coefficients |
|
C
|
-65.87** |
Industrials*IGCM |
-53.22 |
|
(38.82) |
|
(37.34) |
||
MCGI
|
70.42** |
Materials* IGCM |
-77.65* |
|
(43.00) |
|
(43.71) |
||
Colombia
|
51.97** |
Utilities* IGCM |
74.11** |
|
(35.08) |
|
(44.34) |
||
Chile
|
62.81** |
EM |
0.2104 |
|
(38.90) |
|
(0.201) |
||
Colombia*MCGI
|
-91.95 |
TO |
1.84e-05* |
|
(58.37) |
|
(1.06E-05) |
||
Chile*MCGI
|
-90.44** |
Assets |
-0.001* |
|
(55.43) |
|
(0.00) |
||
Financial
|
-122.2 |
3yrSales |
0.384* |
|
(332.3) |
|
(0.224) |
||
Industrial
|
35.61 |
OM |
0.400 |
|
(25.44) |
|
(0.306) |
||
Material
|
53.29** |
PM |
-0.023 |
|
(32.66) |
|
(0.210) |
||
Utilities
|
-59.93** |
ROE |
0.0041 |
|
(33.94) |
|
(0.296) |
||
Financial*MCGI
|
156.8 |
Consumer discretionary |
-3.84 |
|
(456.0) |
(4.21) |
|||
McFadden R2 |
0.6992 |
|||
Akaike info criterion |
1.061 |
|||
Level of significance * (5 %), and ** (10 %) |
||||
Standard errors in parenthesis |
||||
Source: Own creation, with R software
On average, the Peruvian companies have higher probabilities to increase Tobin’s Q if MCGI improvements occur, with 42 %; followed by the Chilean companies with 38.11 %; whereas the Colombian companies would have fewer probabilities with 32 %. Sector analysis shows that the financial sector has the lowest probability to increase the Tobin’s Q in case of MCGI improvements. This confirms the fact that the companies belonging to the financial sector are regulated differently. Conversely, the materials and consumer staples sectors have the highest probabilities. The Peruvian and Colombian consumer staples sector, as well as the Chilean industrial sector, have the highest probabilities to increase the Tobin’s Q if the MCGI grows (Table 7). The high values for the utilities sector in Peru and the materials sector in Chile are the result of having few companies, a high MCGI, and Tobin’s Q values above the average of the MILA sector.
Table 7
Logit estimations of probability
|
Chile |
Colombia |
Peru |
Overall |
Consumer staples |
0.364 |
0.471 |
0.587 |
0.426 |
Financial |
0.010 |
0.160 |
0.034 |
0.113 |
Industrial |
0.436 |
0.206 |
0.497 |
0.357 |
Materials |
0.998 |
0.467 |
0.301 |
0.445 |
Utilities |
0.272 |
0.334 |
0.987 |
0.401 |
All |
0.381 |
0.320 |
0.420 |
0.366 |
The values in the table are the estimated probabilities |
||||
Source: Own creation, with R software
Moreover, Table 8 shows that the dependent variable in the value (0) has been correctly captured by the estimation in 95.35 %; the dependent variable (1), in 81.82 %; and the global model, in 90.77 %.
Table 8
Forecasting model performance
|
Estimated Equation |
Constant Probability |
||||
|
Dep=0 |
Dep=1 |
Total |
Dep=0 |
Dep=1 |
Total |
% Correct |
95.35 |
81.82 |
90.77 |
100.00 |
0.00 |
66.15 |
% Incorrect |
4.65 |
18.18 |
9.23 |
0.00 |
100.00 |
33.85 |
Source: Own creation, with R software
The reported studies analyzing the relation between corporate governance and the value of the company find a positive relation. However, these results are generalized for all companies regardless of the sector to which they belong. Our research proves that this relation is positive, but the probabilities for this relation to occur differ depending on the economic sector of the company.
Corporate governance is a phenomenon that has gained significance in recent years, as it is an appropriate mechanism to provide investors with trust, which improves the markets and the economy. This research becomes a guide for decision making within organizations regarding the implementation or non-implementation of corporate governance practices and its related metrics.
This paper provides an opportunity to measure the efficiency of implementing corporate governance practices in different sectors of a country’s economy. We recommend that future researchers take a multi-year time frame in which it is possible to review the dynamism of these impacts over time.
Anonymous. (2016). Corporate Governance and Firm Valuation in MILA using a different approach. Unpublished.
Black, B., Jang, H., & Kim, W. (2006a). Does corporate governance predict firms’ market values? Evidence from Korea. Journal of Law, Economics, and Organization, 22(2), 366–413. http://doi.org/10.1093/jleo/ewj018
Black, B., Jang, H., & Kim, W. (2006b). Predicting firms’ corporate governance choices: Evidence from Korea. Journal of Corporate Finance, 12(3), 660–691. http://doi.org/10.1016/j.jcorpfin.2005.08.001
Brown, L. D., Robinson, J. M., & Caylor, M. L. (2004). Corporate Governance and Firm Performance.
Claessens, S., & Yurtoglu, B. B. (2013). Corporate governance in emerging markets: A survey. Emerging Markets Review, 15, 1–33. http://doi.org/10.1016/j.ememar.2012.03.002
Fuenzalida, D., Mongrut, S., Arteaga, J. R., & Erausquin, A. (2013). Good corporate governance: Does it pay in Peru? Journal of Business Research, 66(10), 1759–1770. http://doi.org/10.1016/j.jbusres.2013.01.008
Gompers, P., Ishii, J., & Metrick, A. (2003). Corporate governance and equity prices. The Quarterly Journal of Economics, 118(February), 107–155. http://doi.org/doi: 10.1162/003355303605351
Gutiérrez, L. H., & Pombo, C. (2009). Corporate ownership and control contestability in emerging markets: The case of Colombia. Journal of Economics and Business, 61(2), 112–139. http://doi.org/10.1016/j.jeconbus.2008.01.002
Leal, R., & Carvalhal-da-Silva, A. (2005). Corporate Governance and Value in Brazil (and in Chile). New York.
Nunez, G., Onate, A., & Mendes de Paula, G. (2009). Gobernanza corporativa y desarrollo de mercados de capitales (1st ed.). Bogotá: Cepal.
OECD (2004). OECD Principles of Corporate Governance (2004). France.
OECD. (2004b). “White paper” sobre gobierno corporativo en América latina. ParÍs.
Rodríguez-Guevara, D. E., Becerra-Arévalo, J. A., & Cardona-Valencia, D. (2017). Modelos y metodologías de credit score para personas naturales: una revisión literaria. Revista CEA3(5), 13–28.
1. Master in Ingeneering Management of the Universidad Nacional de Colombia; Finance teacher in ITM (Instituto Tecnologico Metropolitano de Medellín); davidacevedoa@gmail.com
2. Master in Financial Management of Universidad EAFIT; Faculty of Economic and Management Sciences (ITM) - https://orcid.org/0000-0002-0648-3600; jairo.becerra@gmail.com
3. Master in Economics of Universidad EAFIT; ; Finance teacher in ITM (Instituto Tecnologico Metropolitano de Medellín; guisao8@hotmail.com
[Índice]
revistaespacios.com

Esta obra está bajo una licencia de Creative Commons
Reconocimiento-NoComercial 4.0 Internacional