![]() ISSN 0798 1015
ISSN 0798 1015

![]() ISSN 0798 1015
ISSN 0798 1015
Vol. 41 (Issue 14) Year 2020. Page 9
VENKATAMUNI, Reddy R. 1; SUBRAHMANYAM, N. 2; NAGARAJ, Subbarao A. 3; NAGENDRA S. 4
Received: 13/10/2019 • Approved: 28/03/2020 • Published 23/04/2020
ABSTRACT: This study aims at finding (a) the average capital-asset ratio of central banks globally is 6.56 percent while the number in emerging economies is 6.96 percent. (b)over one in every seven central banks suffers operating losses in any given year with the average loss being 50 percent of core capital; and (c)our Value-at-Risk estimates for the RBI excluding exchange rate risk indicate that the current level of the core capital of the RBI at 6.6 percent is too low. |
RESUMEN: Este estudio tiene como objetivo encontrar (a) que la proporción promedio de capital-activos de los bancos centrales a nivel mundial es de 6.56 por ciento, mientras que el número en las economías emergentes es de 6.96 por ciento. (b) más de uno de cada siete bancos centrales sufre pérdidas operativas en un año dado con una pérdida promedio del 50 por ciento del capital básico; y (c) nuestras estimaciones de valor en riesgo para el RBI excluyendo el riesgo de tipo de cambio indican que el nivel actual del capital central del RBI en 6.6 por ciento es demasiado bajo. |

Central banks globally grapple with this while making decisions regarding how much of their profits to transfer to their ultimate owners and how much to set aside for augmenting their capital (including for contingencies funds). In most cases the owner of central banks is the government (though there are examples such as the US Federal Reserve System, the Swiss National Bank, South African Reserve Bank etc., who have private shareholders). Central banks transfer their financial surpluses to the government after deducting appropriate amounts to cover their operational requirements as well as putting aside funds for contingencies. The issue about the appropriate capitalization of central banks gains importance since there can potentially be a conflict between the principal owners' desire for profit-sharing revenue reasons and the central banks' assessment of their own capital needs.
Why does a central bank need capital? The Bank for International Settlements (BIS) describes the need for equity as being based on the need for central banks to build financial resources and financial strength. The goal is for the central bank to generate assets that can be used to generate a steady source of income to finance its operations and to absorb financial losses from these operations.
Commercial banks require capital to deal with valuation risks to their assets and liabilities and with operational risks. Central banks are no different. Their balance sheets are sensitive to fluctuations on both their asset and liabilities sides. Changes in domestic (foreign) interest rates, for example, alter the market value of the domestic (foreign) assets and liabilities they hold. Changes in the value of the domestic currency aspect the domestic currency value of foreign assets. In addition, central banks can (and often do) make negative net profits in the process of meeting their monetary and financial policy goals.1 These losses have to be met either through borrowing or by drawing down capital. Lastly, any conflict between mandated transfers to the government (if any) and the residual surplus of the central bank that is available for transfer to the government also has to be met by either drawing down the bank's capital or by printing additional liabilities (money).
The standard way in which central banks meet these balance sheet risks is by building capital reserves. Overall central bank capital (or equity) comprises mostly of paid up capital, contingency reserves and revaluation reserves. Individual central banks may sometimes have one or two additional reserves that shows their special needs. Out of these three types of reserves, the paidup capital is typically very small. Most of the remaining capital reserves is divided between contingency and revaluation reserves. The general practice at most central banks is to record changes in the local currency value of foreign assets due to exchange rate changes in their revaluation reserves. Revaluation reserves are essentially an accounting reserve. Contingency reserves on the other hand are reserves that are readily deployable.
Central banks typically have multiple mandates that include managing inaction, targetting credit aggregates to facilitate economic growth, managing the exchange rate of the country's currency to facilitate external adjustment, overseeing financial stability and regulating financial entities. With such an expansive mandate, an overarching principle of prudent central bank practice is to try and avoid situations with conflicting objectives especially given the limited number of instruments that are typically available to the central bank.
A good (and often unrecognized) example of limited instruments and multiple mandates is the revaluation of central bank foreign assets due to exchange rate changes. If these revaluation changes are counted as part of the core capital of the central bank then during periods of exchange rate depreciation the amount of core capital will appear to be sub-optimally high. This can lead to demands for transferring some of these funds to the authority for either direct spending or to pursue other goals such as restructuring of banks. Given that some of these potential uses of the funds may have implications for other goals of the central bank such as management or credit growth, the central bank may preempt this by preventing the exchange rate from changing. But this, in turn, could end up compromising the central bank's mandate of maintaining external balance through appropriate changes in the nominal exchange rate. An easy, simple and prudent way of avoiding such policy conflicts for the central bank is to remove revaluation reserves from the measure of core capital of the central bank.
In this paper, we measured of core capital on revaluation reserves from the overall capital holdings of central banks. To do this, we examine the balance sheets of 45 central banks comprising both developed and emerging economies. Central banks tend to follow different methods of accounting for revaluation of assets due to exchange rate changes. Some account for the changes in their profit and loss accounts while others create a separate entry in their balance sheet which records this amount. We compute the core capital of each central bank in each year by netting out the exchange rate induced revaluation of capital appropriately.
These three arguments are, however, all subject to debate. First, the increasing use of e-monies calls into question the sustainability of the monopoly role of central banks in issuing money. Second, during times of in cautionary stress a number of countries have found that people switch to alternative currencies such as US dollars and avoid dealing with the local currency. Hence, a better description of the money circulation process is that people are not really forced to accept the money issued by the central bank but rather choose to hold it. They could as easily choose to hold a money if it proved to be a better product. Lastly, the ability of a government to inject resources is limited by the health of its own finances. Governments with large outstanding public debt and high scale deficits are unlikely to be in a position to inject fresh capital into the central bank. Worse, it is precisely these types of governments that may be looking for surplus transfers from the central bank thereby calling into question the joint health of the whole financial and monetary system.
The preceding makes clear that the issue of the appropriate size of the central bank capital remains unsettled. In this paper, we explore some of the international patterns of central bank equity holdings, the likelihood of central banks suffering operational losses and the size of such losses. We also examine the relationship between central bank equity and variables such as the scale balances of the government, volatility of capital flows, and non-performing assets in the banking system and income losses of the central bank. In particular, we focus on the relative position of India in these international patterns. Lastly, we compute the Value-at-Risk (VaR) of the Reserve Bank of India's (RBI's) asset holdings to determine the level of capital that the RBI should target.
Our sample consists of 45 countries from around the world consisting of the 14 developed countries and 31 emerging and developing economies. Our data comes from the International Financial Statistics (IFS), the World Bank and the Annual Reports of individual country central banks. Some of the variables that are of key interest to us are central bank equity, general government fiscal balances and the volatility of capital flows. The data for central bank capital and for the general government fiscal balance is the latest available while the data for capital flows covers the period 2009-2017. Details on the data, its sources, and computations methods are given in the Appendix.
Table 1 gives the sample coverage of countries broken down by variable and country grouping.
Table 1
Sample Coverage by
Variable and Country Group
Averages |
All Countries |
Emerging Countries |
Developed Countries |
Capital ratios |
45 |
31 |
14 |
Fiscal Deficit |
41 |
28 |
13 |
Volatility of Capital Flows |
41 |
28 |
13 |
So how much capital should the RBI hold? That was the original question that we started with. Our analysis thus far has revealed that the RBI's core capital base of 6.6 percent is lower than the average for emerging market economies and around the same as the international average including developed economies which tend to hold lower levels of capital. That however does not tell us much about the desirable level of capital that the RBI should hold. This is what we turn to next.
An internationally accepted method of ascertaining the recommended level of capital for commercial banks is the Value at Risk (VaR) approach. The method is simple. Over any given time horizon (10 days, 30 days, three months, etc.) one can compute the return on the portfolio of the bank which can then be annualized. Every negative return when multiplied by the size of the portfolio gives the size of the fall in the value of the portfolio due to that particular negative realization. The computed annualized shocks to the value of the portfolio can then be ordered in ascending order to get a whole distribution of annual losses. Clearly, negative losses would be increases in the value of the portfolio.
This computed distribution can then be used to compute the Value at Risk of the portfolio. Specifically, one can choose a particular confidence interval x% and determine the size of the 1 x% largest portfolio losses. Let this computed number be y. This number would be interpreted as with x% certainty the loss in value of the portfolio will be less than y. The higher the x the greater the certainty one is demanding and consequently the greater the size of the loss that one is ruling out. Suppose one chooses the 99 percent confidence interval then x = 0:99. In this case one is trying to pick out the largest 1% of portfolio losses. Hence, the computed number for the 99 percent confidence interval will be greater than, say, the 95 percent confidence interval.
There are a couple of other methods that are also used to compute the potential risk to portfolio which are related to the VaR approach. The rst alternative is the Expected Shortfall approach or ES-VaR. This computes the total value at risk for a given con dence interval by adding up (integrating under the distribution) all the losses to left of the cut-o threshold. The VaR, in contrast, only computes the value at the chosen confidence interval threshold. Consequently, the estimated value at risk under ES-VaR will be greater than that under VaR.
A second alternative to VaR is the S-VaR approach which focuses on the worst z percent of all outcomes and computes the VaR for that truncated distribution. Since the worst x% outcomes under the full distribution will be lower than the worst x% outcomes under the truncated distribution of the worst z percent of all outcomes say, the loss numbers computed under S-VaR will also be greater than those under VaR for the same con dence interval. The S-VaR is a more stringent requirement than VaR which gives capital level to fend o a crisis now. Given that central banks must be credible even under stressed scenarios to fend o crises like the Global Financial Crisis (GFC) in 2008 or the Taper Tantrum in 2013, the S-VaR may be more appropriate. Indeed, after the GFC, commercial banks are being asked to hold capital based on stress tests and not just average time loss-based risk weights.
We estimated the VaR, ES-VaR and S-VaR for the RBI portfolio under the 99.9, 99 percent, 97.5 and 95 percent confidence intervals. We estimated these for returns over windows of 10 days, 30 days and 90 days. To construct the RBI asset portfolio, we follow Anand, Fellman, Sharma, and Subramanian (2018). We assume that the RBI foreign asset portfolio is composed of 30 percent foreign currency and 70 percent foreign assets. The currency portfolio is assumed to be 70 percent US dollars, 20 percent Euro and 10 percent British pounds. Similarly, the asset portfolio is assumed to be 70 percent US dollar assets, 20 percent German assets and 10 percent UK assets. We assume that all assets are held in terms of 10-year government securities. Lastly, the RBI's domestic securities are assumed to be held entirely in terms of 10-year government securities. VaR computations require incorporating the various shocks that typically impact the value of central bank assets. One of these shocks is the value of the exchange rate as it reacts the domestic currency value of the central bank's foreign assets. As we argued above, under our conceptual principle, exchange rate generated changes in the value of assets are accounting entities that should not be counted as part of core capital. Including these revaluation funds in capital also generates conflicting policy objectives as we highlighted above which makes it even more important to leave this out of any baseline measure of a central bank's core capital. In light of this, we take the following approach. For our baseline estimates, we compute VaR without incorporating exchange rate risk and compare the resultant estimates with the RBI's core capital which excludes the revaluation capital. We then conduct a second set of computations wherein we estimate the VaR of the RBI asset base by including exchange rate risk. These estimates are then compared with the RBI's overall capital base which includes the revaluation capital.
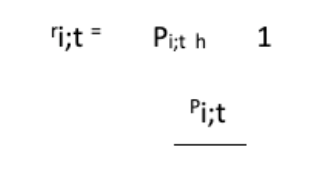
To compute actual returns on the portfolio we take the bond's clean price index value Pi;t, get negative return over h-day window, so that losses are on the right tail and profits are on the left.
We then annualise the above return as:
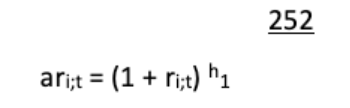
where 252 is the usual number of trading days per year in global markets. Lastly, we compute the loss-to-asset ratio as
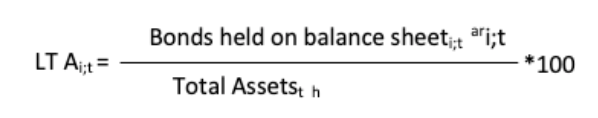
Table 2 shows the estimated value at risk (excluding exchange rate risk) of the RBI's
asset portfolio for different confidence intervals and time horizons. Our sample period is January 2013 - November 2018. The key feature that stands out from the VaR calculations is that the current core capital of the RBI at 6.6 percent is significantly lower than the estimated asset values of the RBI that are at risk for all confidence intervals, for all time horizons and for all methods. Even a 30-day horizon VaR estimate at the 95 percent confidence interval is 17.1 percent which is over 150 percent greater than the current core capital of the RBI.
Perhaps most strikingly, the 10-day return horizon VaR, ES-VaR and S-VaR estimates are all greater than even the overall capital of the RBI (including the revaluation capital fund) even at the 95 percent confidence interval. Indeed, at the 97.5 percent confidence interval the 10-day return horizon VaR estimate is 38.9 percent which is 11 percentage points more than the RBI's current overall capital holding including its revaluation capital!
Table 2
Capital required to cover Market Risk, as percent
of total assets, January 2013 - November 2018
CI |
10-day VaR |
10-day ES-VaR |
10-day S-VaR |
30-day VaR |
30-day ES-VaR |
30-day S-VaR |
90-day VaR |
90-day ES-VaR |
90-day S-VaR |
95 |
29.0 |
42.5 |
49.9 |
17.1 |
23.3 |
28.1 |
8.3 |
13.1 |
16.9 |
97.5 |
38.9 |
51.7 |
55.4 |
21.9 |
27.5 |
29.8 |
12.2 |
16.3 |
18.2 |
99 |
49.9 |
64.0 |
78.3 |
28.1 |
31.2 |
31.9 |
16.9 |
18.2 |
18.7 |
99.99 |
99.8 |
99.8 |
99.8 |
41.6 |
41.6 |
41.6 |
19.4 |
19.4 |
19.4 |
Notes:
One might wonder if our VaR estimates are high due to our using the sample period 2013-18 which includes the taper tantrum of 2013. At some level, episodes such as the taper tantrum are precisely the kinds of events for which the central bank needs to have capital. Nevertheless, we estimate the sensitivity of our VaR estimates to the sample period in two alternative ways. First, we use the sample period 2014-18 to re-estimate the VaR numbers reported in Table 6. These are reported in Table 7. Next, we re-estimate the VaR using only the 2017-18 data. These numbers are reported in Table 8. As the Tables make clear, the VaR estimates are robust in terms of our main conclusion: the RBI's core capital base of 6.6 percent is probably less than half of what it should be. In fact, even the 90-day horizon VaR estimates at all confidence intervals are greater than the current core capital ratio of the RBI.
Table 3
Capital Required to cover Market Risk, as percent
of total assets, January 2014 - November 2018
CI |
10-day VaR |
10-day ES-VaR |
10-day S-VaR |
30-day VaR |
30-day ES-VaR |
30-day S-VaR |
90-day VaR |
90-day ES-VaR |
90-day S-VaR |
95 |
24.8 |
34.8 |
42.4 |
12.9 |
16.3 |
18.4 |
7.0 |
7.9 |
8.5 |
97.5 |
32.1 |
41.3 |
47.9 |
15.6 |
18.4 |
20.7 |
7.8 |
8.4 |
8.9 |
99 |
42.4 |
48.7 |
53.0 |
18.4 |
20.3 |
21.9 |
8.5 |
9.0 |
9.4 |
99.99 |
66.8 |
66.8 |
66.8 |
22.6 |
22.6 |
22.6 |
9.7 |
9.7 |
9.7 |
Notes:
Table 4
Capital Required to cover Market Risk, as percent
of total assets, April 2017 - November 2018
CI |
10-day VaR |
10-day ES-VaR |
10-day S-VaR |
30-day VaR |
30-day ES-VaR |
90-day S-VaR |
90-day VaR |
90-day ES-VaR |
90-day S-VaR |
95 |
23.1 |
28.7 |
32.0 |
12.9 |
15.4 |
17.1 |
7.3 |
7.8 |
8.1 |
97.5 |
29.6 |
32.1 |
33.8 |
15.4 |
17.0 |
18.2 |
7.8 |
8.1 |
8.5 |
99 |
32.0 |
33.9 |
36.8 |
17.1 |
18.0 |
18.4 |
8.1 |
8.4 |
8.7 |
99.99 |
36.8 |
36.8 |
36.8 |
18.4 |
18.4 |
18.4 |
8.7 |
8.7 |
8.7 |
Notes:
The results also illustrate the importance of using as much data as possible for computing VaRs since any single year may be atypical in terms of the return profile that it generated. As is easy to see from Tables 7 and 8, the computed VaR's at all horizons and confidence intervals are increasing in the sample period that we used. That just rejects the fact that the longer time periods included more negative shocks to returns relative to, say, only the 2017-18 sample.
It is important to note that our VaR estimates are higher than the estimates reported in the work of Anand, Fellman, Sharma, and Subramanian (2018) across the board. The reasons for differences between our estimates and their's are three-fold: (a) our estimates do not include the exchange rate risk to asset values; (b) our estimates are based on a five-year time period from 2013-2018 to compute the VaR. This time period may be different from the sample period used by Anand, Fellman, Sharma, and Subramanian (2018) since they never explicitly report the sample period that they used; and (c) our VaR estimates are based on the clean price index of the various government securities by Anand, Fellman, Sharma, and Subramanian (2018) since with their sample time period silence, never explicitly state the bond price series that they use.
We made the crucial conceptual and analytical choice of not including exchange rate risk while deriving the estimates for VaR of the RBI asset base. How much of a difference does this make? Conceptually, one can anticipate that it might make a difference depending on the sample one is using. Recall that a rupee appreciation reduces the value of foreign assets while a depreciation raises the value. Thus, a researcher who only considers a sample period in which the rupee depreciated (say 2017-18 for India) would not find any negative return episodes on account of exchange rate fluctuations. Contrarily, a researcher who considers a longer sample such as 2013-18 that included periods of rupee appreciation would find negative return episodes due to exchange rate fluctuations and consequently will estimate a higher VaR.
To examine this, we incorporate exchange rate risk as well and recompute the VaRs at all horizons, frequencies and confidence intervals.Tables 9 and 10 below report the results for the full sample and for the 2017-18 sample period, respectively.
Table 5
VaR with exchange rate risk, as percent of
total assets, January 2013 - November 2018
CI |
10-day VaR |
10-day ES-VaR |
10-day S-VaR |
30-day VaR |
30-day ES-VaR |
90-day S-VaR |
90-day VaR |
90-day ES-VaR |
90-day S-VaR |
95 |
54.4 |
88.7 |
90.6 |
19.0 |
27.4 |
30.0 |
8.8 |
11.3 |
12.5 |
97.5 |
69.5 |
115.7 |
142.8 |
24.8 |
33.3 |
38.9 |
10.6 |
12.9 |
13.9 |
99 |
90.6 |
170.6 |
204.2 |
30.0 |
41.8 |
52.4 |
12.5 |
15.0 |
17.2 |
99.99 |
533.6 |
533.6 |
533.6 |
73.1 |
73.1 |
73.1 |
23.3 |
23.3 |
23.3 |
Notes:
As anticipated, considering longer time periods that include periods when the rupee appreciated raises the estimated VaR for the 10 and 30-day horizons for all confidence intervals and methods. As an example, the estimated 30-day S-VaR under the 95 percent confidence interval for the 2017-18 sample period is 20.8 percent. When the sample period considered is broadened to the entire 2013-18 period, the estimated S-VaR at the 95 percent confidence interval rises to 30 percent, a number that is even greater than the 27 percent consolidated capital base including the entire revaluation capital of the RBI!
Table 6
VaR with exchange rate risk, as percent of
total assets, April 2017 - November 2018
CI |
10-day VaR |
10-day ES-VaR |
10-day S-VaR |
30-day VaR |
30-day ES-VaR |
90-day S-VaR |
90-day VaR |
90-day ES-VaR |
90-day S-VaR |
95 |
25.2 |
30.4 |
33.2 |
14.8 |
18.2 |
20.8 |
10.2 |
11.9 |
13.3 |
97.5 |
29.8 |
34.0 |
33.8 |
16.5 |
21.1 |
23.4 |
11.2 |
13.3 |
14.0 |
99 |
33.2 |
36.7 |
43.3 |
20.8 |
25.8 |
28.2 |
13.3 |
13.9 |
14.4 |
99.99 |
43.3 |
43.3 |
43.3 |
28.2 |
28.2 |
28.2 |
14.4 |
14.4 |
14.4 |
Notes:
There are two main takeaways from the above. First, the estimated VaR for the RBI asset portfolio is quite high under all methods, horizons and confidence intervals. Indeed, our estimates excluding exchange rate risk suggest that the RBI's core capital needs to be well above 16 percent, which is more than double its current level of 6.6 percent. Second, including exchange rate risk raises the VaR estimates as long as one also includes periods where the exchange rate appreciated rather than only depreciating. Importantly, our S-VaR estimate including exchange rate risk is 30 percent for the 30-day horizon at the 95 percent confidence interval. This is almost 3 percentage points greater than the total capital of the RBI currently. Indeed, even the ES-VaR estimate at the 95 percent confidence interval for the 30-day horizon is 27.4 percent. The corresponding number for the 10-day horizon is a whopping 88.7 percent. Hence, independent of whether or not one includes exchange rate risk or not, the RBI's relevant capital base needs to be increased, not reduced.
The main source of financing for central banks is seignories, or real resources generated in the process of printing money. The revenue from money printing has two components. The interest is the rate of expansion of the real money base while the second is the tax. Central banks also face policy mandates on managing the reaction.
If the central bank relies on injection of resources by the government in the event of suffering operating loss that cannot be covered by its capital base, then there will automatically be the expectation that the central bank will make fiscal transfers to the government when it has operating profits and when the government needs those transfers.
Positive structural profits deliver lower action rates than central banks with negative structural profits (see Ize (2006), Oulidi and Ize (2009) and Stella (1997)). Researchers have also found that weakening of the financial strength of central banks is accompanied by worse macroeconomic performance on action and on monetary policy transmission (see Adler, Castro, and Mora (2012), Klueh and Stella (2008) and Stella (2008)).
This paper has explored international patterns of central bank capital-asset ratios. The focus has been on capital that is available to be deployed in emergencies. The RBI's current capital ratio is about 5 percent lower than the emerging economy average. Low capital reserves create two problems. First, they compromise the ability of a central bank to manage risks. Second, negative income shocks can push the central bank into negative equity territory which could further compromise the banks operational capability.
Moreover, when negative income shocks occur they can be large enough to wipe out the entire core capital of the central bank. In the Indian context, the time series behavior of surpluses of the RBI over the last 20 years indicate that a negative income shock of 1.29 standard deviations would be enough to wipe out all of the RBI's current core capital of 6.6 percent.
Amongst possible factors that obviate the need for a central bank to hold capital is the potential availability of capital injection by the government in case of emergencies. However, this possibility depends crucially on the health of government finances. we have conducted VaR estimation for the RBI balance sheet. Our estimates, for all confidence intervals, all methods and all-time horizons for computing returns, suggest that at 6.6 percent the current level of the core capital of the RBI is too low. The target number for the RBI core capital, according to our estimates, should be above 16 percent, which is more than double the RBI's current level of core capital. Moreover, once one includes exchange rate risk in the VaR computations, which the RBI's overall capital base including revaluation capital needs to be closer to 30 percent relative to its current level of 27 percent. Our primary conclusion is that the RBI is certainly not over-capitalized. Rather, its capital ratio (certainly the core capital but probably the overall capital ratio as well) needs to be raised. Our analysis of the capital structure of central banks around the world has focused on deployable capital, or capital that can be put to immediate use in the event of an emergency. In order to do so we have put aside the revaluation capital that a number of central banks carry on their balance sheets. Revaluation capital is an accounting entry that is used to accommodate changes in the domestic currency value of foreign assets due to changes in the exchange rate and gold prices. Leaving out revaluation capital from measures of core equity is part of a more general point regarding the design of a central bank's capital structure.
Adler, G., P. Castro, and C. Mora (2012): \Does Central Bank Capital Matter for Monetary Policy," IMF Working Papers 12/60, International Monetary Fund.
Anand, A., J. Fellman, N. Sharma, and A. Subramanian (2018): \Paranoia or Prudence?," Economic and Political Weekly, Vol. 53(Issue No. 48).
Ize, A. (2006): \Spending Seigniorage; Do Central Banks Have a Governance Problem?," IMF Working Papers 06/58, International Monetary Fund.
Klueh, U. H., and P. Stella (2008): \Central Bank Financial Strength and Policy Performance; An Econometric Evaluation," IMF Working Papers 08/176, International Monetary Fund.
Oulidi, N., and A. Ize (2009): \Why Do Central Banks Go Weak?," IMF Working Papers 09/13, International Monetary Fund.
Stella, P. (1997): \Do Central Banks Need Capital," IMF Working Papers 97/83, Inter-national Monetary Fund.
1. Professor, Department of Commerce, Manipal Academy of Higher Education (MAHE), Manipal, Karnataka, India. ORCID: 0000-0001-7808-2139 Email: rvm.reddy@manipal.edu Corresponding Author
2. Professor, School of Management, K L University, Vijayawada, Andhra Pradesh, India Email: nsubrahmanyam2011@gmail.com
3. Dean – Executive Education and Professor – SCMS, Dayananda Sagar University, Bangalore, India Email: dean-cee@dsu.edu.in
4. Associate Professor, PG Department of Business Administration, Alvas Institute of Engineering and Technology, Mijar-Moodbidri, Karnataka, India Email: nagendraskyfall@gmail.com
[Index]
revistaespacios.com

This work is under a Creative Commons Attribution-
NonCommercial 4.0 International License