![]() ISSN 0798 1015
ISSN 0798 1015
![]()
![]() ISSN 0798 1015
ISSN 0798 1015
![]()
Vol. 41 (Issue 17) Year 2020. Page 25
Received: 29/03/2020 • Approved: 05/05/2020 • Published 14/5/2020
ABSTRACT: This paper aims to analyze the effect of company size, leverage and return on assets on earnings management. The research method uses descriptive methods with a quantitative approach. The research data used financial statement data on the Indonesia Stock Exchange from 2014 to 2018. Data sources were obtained from the Indonesia Stock Exchange website. The research findings explain that company size has no influence on earnings management, while leverage and return on assets have an influence on earnings management. |
RESUMEN: Este documento tiene como objetivo analizar el efecto del tamaño de la empresa, el apalancamiento y el rendimiento de los activos en la gestión de ganancias. El método de investigación utiliza métodos descriptivos con un enfoque cuantitativo. Los datos de la investigación utilizaron datos de los estados financieros en la Bolsa de Indonesia de 2014 a 2018. Las fuentes de datos se obtuvieron del sitio web de la Bolsa de Indonesia. Los resultados de la investigación explican que el tamaño de la empresa no influye en la gestión de ganancias, mientras que el apalancamiento y el rendimiento de los activos influyen en la gestión de ganancias. |

Previous research related to earnings management can be done with pure earnings management and real earnings management. Accrual earnings management is carried out at the end of the earnings management reporting period before being engineered so that manipulation is needed to achieve revenue targets. Earnings management can occur because of financial reporting (Abad D, Cutillas-Gomariz, Sánchez-Ballesta, & Yagüe, 2018; Abarbanell & Lehavy, 2003a, 2003b; Abata & Migiro, 2016). Accrual accounting systems that already exist in generally accepted accounting principles provide an opportunity for managers to make accounting considerations that affect company earnings.
This research provides a number of contributions. The results of the study identify the important issues at present in Indonesia, where company size, leverage and return on assets have a positive influence on earnings management in Indonesia, which focuses on paying proper attention to the operations of telecommunications companies. The results of previous studies indicate that company size does not have an influence on earnings management, while leverage and return on assets have a positive effect on earnings management. As such, this paper expands knowledge about earnings management of companies listed on the Indonesia Stock Exchange.
Jensen & Meckling, (1976) Agency theory explains the conflict between management as the agent and the owner of the company, the agency relationship as the principal to perform certain services in the interest of the principal, by delegating authority to the agent. To account for the company's performance to the principal, the auditor provides an opinion. Principles considered more trusting of reports from auditors with high integrity and independence possessed by large auditors. Asymmetry of accounting information has access to information about company prospects that are not owned by outside partiesIf two groups of agents have principles that seek to maximize utility, and then there is good reason to believe agents do not always act in the best interests of the company owner. (Aarstad, 2010; S. Z. M. Abbas, Mahmud, & Manan, 2017; M. Abbasi, Dadashinasab, & Asgari, 2013; Abd Hadi & Mcbride, 2000; Abdallah, Darayseh, & Waples, 2013).
Basically earnings management is the potential use of accrual management with the aim of gaining corporate profits, management disclosure as a direct intervention management tool in the financial reporting process through the management income or earnings, to obtaining certain benefits or benefits for both managers and companies that are based by economic factors. Some understanding of earnings management concludes that earnings management is more related to management decision-making related to corporate financial statements (Abad D. et al., 2018; Abarbanell & Lehavy, 2003a, 2003b; Abata & Migiro, 2016). Management can take many ways to influence financial reporting either by manipulating data or financial information of the company or by choosing accounting methods accepted in generally accepted accounting principles, ultimately aiming to get company earnings even though the earnings generated do not show the real state of the company.
The size of the company can be seen from the total assets of the company owned. The size of companies in the public are generally divided into 3 categories: large companies, medium companies and small companies. The company's operating profit can be obtained if the number of sales is greater than the total costs incurred by the company (Aabo & Simkins, 2005; J. Abad, Cabrera, & Medina, 2016; Abban, Omta (Onno), Aheto, & Scholten, 2013; J. Abbas, Raza, Nurunnabi, Minai, & Bano, 2019; A. Abbasi & Malik, 2015). In order to have the desired amount of net earnings, the management carries out careful sales planning and appropriate controls are carried out to achieve the desired sales amount. The benefit of management control is to ensure that the organization has implemented its business strategy effectively and efficiently.
Leverage is used to measure the company's ability to guarantee total liabilities with total company assets. Leverage has an influence on the company because liabilities have a burden borne by the company. A company's failure to pay interest can cause financial difficulties that can result in the company's bankruptcy. The use of liabilities also provides tax subsidies on interest that can benefit shareholders. (Ault, Childs, Wainright, & Young, 2011; Christensen, Kaufman, & Shih, 2008; Coyne & Singh, 2008; Dotson & Nuru-Jeter, 2012; Dreachslin et al., 2017). Therefore the use of corporate liabilities must balance the advantages and disadvantages. Leverage has a relationship with earnings management practice reports, when companies have high leverage ratios, companies tend to practice earnings management reports because the company is threatened that it cannot fulfill its obligations by paying its debts on time. There are two kinds of leverage, operating leverage and financial leverage.
Return on Assets is a ratio to assess the percentage of income that has been associated with the company's total assets, so that the efficiency of the company in managing its assets can be seen from the ratio of the percentage of return on assets. The higher the value of Return on Assets means the higher the company's profit ability. The ability of a company to generate corporate income at the level of sales, assets, and capital is reflected in the ratio of the ability to obtain corporate profits, one of the most commonly used earnings ability ratios to assess the results of overall management performance is the ratio of return on assets (A. Wolf, Stephenson, Knoblauch, & Novakovic, 2016; F. J. Abbas, Nobanee, Khan, & Varas, 2017; S. Abbasi, Abbasi, & Foghi, 2016; Abdel-Maksoud, Cerbioni, Omran, & Ricceri, 2015; Ault et al., 2011). This ratio is calculated by dividing the amount of company revenue in a certain period by the amount of funds invested in the company in that period. The higher the Return on Assets (ROA) of the company, the more effective the company uses its assets in creating high earnings. High Return on Assets (ROA) opens up opportunities for corporate managers to manage earnings by increasing earnings to obtain large bonus amounts.
Larger companies generally receive more attention from external parties such as investors, analysts, and the government, so companies are more careful in managing their financial statements. So it concludes that the larger the size of the company, the less likely the company to do earnings management, if the company is still on a small-scale or small then high earnings management (Aabo & Simkins, 2005; J. Abad et al., 2016; Abban et al., 2013; J. Abbas et al., 2019; A. Abbasi & Malik, 2015). Based on some of the arguments above, researchers propose a hypothesis that is tested as follows:
H1: Firm size influences earnings management
Leverage is a measurement of the number of assets financed by debt; the debt comes from creditors, not from shareholders or investors. Debt policy is another alternative to get funds besides selling shares. In a debt agreement it is in the company's interest to be evaluated positively by creditors in terms of their ability to repay debt (Ault et al., 2011; Christensen et al., 2008; Coyne & Singh, 2008; Dotson & Nuru-Jeter, 2012; Dreachslin et al., 2017) Therefore, the company commits fraud in the form of earnings management, namely increasing reported earnings to increase the bargaining power of the company in debt negotiations, reduce creditors' concerns and to get credit line loosening. Thus, the hypothesis being tested is:
H2: Leverage effects to the earnings management
Return on Assets is a ratio to measure a company's ability to generate profits using total assets owned by a company Return on Assets shows management's ability to generate revenue by utilizing assets used in operating activities (A. Wolf et al., 2016; F. J. Abbas et al., 2017; S. Abbasi et al., 2016; Abdel-Maksoud et al., 2015; Ault et al., 2011). The greater return on assets shows the greater the fluctuations in management's ability to generate corporate profits affect investors in predicting income and estimating risk in investment so that it has an impact on investor confidence in the company's financial performance.. In this connection, management is motivated to practice earnings management reports, so that reported earnings do not fluctuate thereby increasing investor confidence. Thus the hypotheses that can be formulated are as follows:
H3: return on assets affects earnings management
The type used in this research is quantitative research whose analysis generally uses data measured in a numerical scale that is tested using statistical analysis. Quantitative descriptive is a research design that aims to explain or provide empirical evidence about a particular phenomenon accompanied by quantitative and qualitative data extracted from an object. Variables are clearly defined both conceptually and operationally, variables that can be measured. The variables used in this study are:
The independent variable influences the dependent variable. The independent variables in this study include:
Company size is denoted by size of a particular client or in the logarithm of total assets against the total size of the company; Abbasi and Malik (2015).
SIZE = Logaritma (Total Asset)
Leverage is a comparison between debt and assets that shows some of the assets used to guarantee debt. If the company's debt is greater than its assets, the greater the risk faced by the company to pay its obligations. Thus the value of leverage becomes high, so companies tend to do earnings management to avoid debt agreements. Leverage is defined as the debt to assets ratio which is the result of dividing t-year total by total t-year equity (Dreachslin et al. 2017), (Rusdiyanto, Agustia, Soetedjo, Narsa, & Septiarini, 2020). As for the formula used as follows:
![]()
Return on Assets is the company's ability to use total assets to generate corporate profits. This ratio is very important for company management to evaluate the effectiveness and financial efficiency of a company in managing its total assets The greater the return on assets, the more efficient the use of company assets to generate corporate profits, and vice versa (Rusdiyanto & Narsa, 2019). This ratio can be calculated as follows:
![]()
The dependent variable in this paper uses earnings management; earnings management is proxied by discretionary policies. Discretionary accruals use the accrual component in managing earnings because the accrual component does not require physical evidence of cash so to play with the accrual component is not accompanied by cash received. Earnings management is the process of preparing the company's financial statements for external parties can improve and reduce company management to use the leeway of accounting methods in terms of earnings management, namely income smoothing reports. Earnings management in this study is measured based on the ratio of work accruals to income (Harymawan & Nowland, 2016; Jones, 1991). The following is the measurement of earnings management:
![]()
Δ Working Capital Accruals = ΔAL - ΔHL – ΔKAS
Description:
ΔAL = Changes in current assets in the t-period
ΔHL = Changes in current debt in the t-period
ΔKAS = Changes in cash and cash equivalents in the t-period
The population in this study: researchers used the Company's financial statements on the Indonesia Stock Exchange from 2014 to 2018. The sampling technique in this study, researchers used a purposive sampling technique where the sampling is based on consideration and meets the criteria, the Telecommunications Company, the sample in this study reports information finances published during the period 2014 to 2018.
Descriptive statistical analysis to provide a statistical description of the independent and dependent variables in this study. The independent variables in this study are company size, leverage and ROA.
Table 1
Descriptive Statistics
|
N |
Minimum |
Maximum |
Mean |
Std. Deviation |
Firm Size |
25 |
16.69 |
26.05 |
19.8292 |
3.42125 |
Leverage |
25 |
.01 |
.90 |
.4776 |
.30691 |
ROA |
25 |
-140.91 |
25.70 |
-17.3296 |
42.21287 |
Earnings Management |
25 |
-38.74 |
69.96 |
1.3276 |
20.60538 |
Valid N (listwise) |
25 |
|
|
|
|
The table can be seen that the number of research samples is 25 samples with the lowest firm size value of 16.69 and the highest value of 26.05 while the overall average value is 19.8292 with a standard deviation of 3.42125. The lowest value is Leverage (0.01 and the highest value is 0.90 while the overall average value is 0.4776 with a standard deviation of 0.30691. The lowest Return on Assets value is -140.91 and the highest value is 25.70 while the value is overall average of -17.33296 with a standard deviation of 42.21287. The lowest value of earnings management is -38.74 and the highest value is 69.96 while the overall average value is 1.3276 with a standard designed of 20.60538.
Table 2
Linearity Test of Company Size (X1)
|
|
|
Sum of Squares |
df |
Mean Square |
F |
Sig. |
Earnings Managenent * Size |
Between Groups |
(Combined) |
9013.607 |
24 |
429.219 |
1.095 |
.549 |
Linearity |
92.336 |
1 |
92.336 |
.235 |
.661 |
||
Deviation from Linearity |
8921.271 |
22 |
446.064 |
1.138 |
.531 |
||
Within Groups |
1176.349 |
3 |
392.116 |
|
|
||
Total |
10189.956 |
25 |
|
|
|
||
The table can be seen that the number of research samples is 25 samples with the lowest firm size value of 92.336 and the highest value of 9013,607 while the overall average value is 392.116 with a standard deviation of 1176,349.
Table 3
Leverage Linearity Test (X2)
Sum of Squares |
df |
Mean Square |
F |
Sig. |
8741.296 |
24 |
437.065 |
1.207 |
.477 |
65.348 |
1 |
65.348 |
.180 |
.693 |
8675.948 |
21 |
456.629 |
1.261 |
.456 |
1448.661 |
4 |
362.165 |
|
|
10189.956 |
25 |
|
|
|
Based on the results of the linearity test in this paper, it can be seen in the Anova table that Sig. Deviation from Linearity of 0.456> 0.05, meaning that there is a linear relationship between the variable leverage and earnings management variables.
Table 4
Return On Assets Linearity Test (X3)
|
|
|
Sum of Squares |
df |
Mean Square |
F |
Sig. |
Earnings Managenent * Return On Assets |
Between Groups |
(Combined) |
9030.264 |
24 |
392.620 |
.339 |
.901 |
Linearity |
1002.718 |
1 |
1002.718 |
.865 |
.523 |
||
Deviation from Linearity |
8027.546 |
24 |
364.888 |
.315 |
.912 |
||
Within Groups |
1159.693 |
1 |
1159.693 |
|
|
||
Total |
10189.956 |
25 |
|
|
|
||
Based on the results of the linearity test in this paper, it can be seen in the Anova Table of Sig. Deviation from Linearity is 0.912> 0.05, meaning that there is a linear relationship between the leverage variable and the earnings management variable.
T-test partially tests the regression coefficients to find out whether each model used in company size research, leverage and Return on Assets has an influence about the practice of earnings management reports for companies on the Indonesia Stock Exchange.
Table 5
T-Test Results
Model |
Unstandardized Coefficients |
Standardized Coefficients |
t |
Sig. |
||
B |
Std. Error |
Beta |
||||
1 |
(Constant) |
12.683 |
40.262 |
|
.315 |
.756 |
Size |
-.599 |
1.706 |
-.099 |
-.351 |
.729 |
|
Debt |
2.349 |
18.185 |
.035 |
2.139 |
.003** |
|
ROA |
.035 |
.113 |
.072 |
2.310 |
.020** |
|
a. Dependent Variable: Earnings Management |
||||||
From the results of the research that has been done can be described each of the variables influence on earnings management as follows:
Based on the results of research that has been done shows that tcount is -0.351 while ttable = 1.71387, then the value of tcount <ttable. While the significance value of tcount is 0.729 that means> 0.05. Meaning that it can be concluded that H0 is accepted and H1 is rejected, meaning that there is no significant effect on company size on earnings management.
Based on the results of research that has been done to obtain the results of tcount is 2.139 while the ttable is = 1.71387, then the value of tcount> ttable. While the significance value of tcount is 0.03 which means <0.05, so it can be concluded that H0 is rejected and H1 is accepted, meaning that there is a significant positive effect of leverage on earnings management.
Based on the table that has been done shows the result of tcount is 2.310 while ttable = 1.71387, so tcount> ttable. While the significant value of tarithmetic is 0.20 which means <0.05. Meaning that it can be concluded that H1 is accepted, this means there is a significant effect of Return on Assets on earnings management.
The feasibility test examines the variables in the study consisting of company size, leverage and ROA that are appropriate for use in the research model. The feasibility test in this study used the F-test. As for the testing procedure used, if the significance value of the F-Test> 0.05, then the variable company size, leverage and ROA are not feasible to use the research model, If the significance value of the F-Test <0.05, then the variable company size, leverage and ROA are feasible to use the research model.
Table 6
F-Test Results
Model |
Sum of Squares |
df |
Mean Square |
F |
Sig. |
|
1 |
Regression |
8022.811 |
3 |
2674.270 |
7.905 |
.004a** |
Residual |
5412.793 |
21 |
338.300 |
|
|
|
Total |
13435.604 |
24 |
|
|
|
|
a. Predictors: (Constant), ROA, Debt, Size |
||||||
b. Dependent Variable: Earnings management |
||||||
The table above explains the significant level of the F-test is 0.004 <0.05 which shows that the influence of the independent variable company size, leverage and Return on Assets together affect earnings management. These results indicate the model is feasible to use.
Regression analysis used in this paper is multiple linear regression analysis that examines the relationship between one variable with another variable, in this paper there are one dependent variable and three independent variables.
Table 7
Results of Multiple Regression Test
Model |
Unstandardized Coefficients |
Standardized Coefficients |
||
B |
Std. Error |
Beta |
||
1 |
(Constant) |
12.683 |
40.262 |
|
Size |
-.599 |
1.706 |
-.099 |
|
Debt |
2.349 |
18.185 |
.035 |
|
ROA |
.035 |
.113 |
.072 |
|
a. Dependent Variable: Earnings management |
||||
The multiple linear regression formula in this study, researchers can describe as follows:
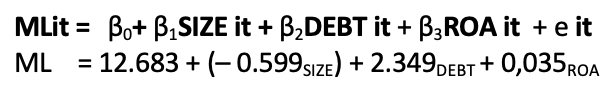
The results of regression testing the size of the company the significant value is 0.729, meaning that the size of the company does not have a significant effect on earnings management because the value of the significance level is greater than 0.05 so this hypothesis is rejected. It means that the company's total assets have no influence on earnings management. The size of the company is total assets information about the total assets of the company so that the size of the company becomes part of the public's attention related to the company's financial performance. Companies with a high level of assets of oversight from stakeholders are also increasingly large to oversee the company in managing its assets. So the company is careful in managing its assets into profits and reducing earnings management practices. Research that has been conducted in line with the signal theory that explains the high attention of external parties to the company, increasingly encourages large companies to be more careful in presenting financial reporting so as to avoid earnings management. Thus this research strengthens the signal theory that large companies do get higher attention than small companies so that it is possible to avoid earnings management.
The results of tests that have been done show the significance level of leverage with the level of singification is 0.003. So leverage has a positive and significant effect on earnings management, because the significance value is less than 0.05 so this hypothesis is accepted. This means that the amount of division between total liabilities and total assets can influence the company in modifying earnings management. This research shows that leverage has a positive influence on earnings management reports, meaning that the greater the company's leverage, the greater the occurrence of earnings management. This is in line with the signal theory that explains that companies need to convey information to external parties so that external parties can assess the current situation and prospects of the company in the future, one of which is the company's ability to pay off long-term liabilities.
The results of testing this paper show the significance value of Return on Assets of 0.020. It means that Return on Assets has an influence on earnings management because the significance value is less than 0.05 or the hypothesis is accepted. This means the rise and fall of the value of the division between net income and total assets of a company affect the company in carrying out earnings management practices. To sum up, if earnings ability has increased or decreased, the company continues to do earnings management because management thinks investors prefer stable earnings than fluctuations. Thus affecting investors in predicting the risk to get investment income, thus this has an impact on investor confidence in the company. This is also possible because the object of this research is a telecommunications company which incidentally is a company with income levels that increase from year to year. So the company is likely to take action on earnings management practices. The results of research that have been conducted are in line with agency theory which states that if the ability of earnings increases or decreases, the tendency of modifying earnings management reports is carried out by company management to attract investors.
The size of the company in this paper does not have an influence on earnings management, meaning that total company assets cannot influence earnings management. The size of the company in this paper provides information about company wealth. Leverage in this paper has a positive effect on earnings management, meaning that the percentage of division between total liabilities and total company assets can affect the company in presenting earnings management reports. While the Return on Asset variable has a positive influence on earnings management. This means the rise and fall of the value of the division between net income and total assets of a company affect the company in carrying out earnings management practices, earnings ability has increased or decreased, the company continues to do earnings management. Adjusted R Square value is 63.5%, that the independent variable consisting of company size, leverage and ROA can explain the dependent variable that is earnings management at 63.5%, while 36.5% is explained by other variables not included in this paper.
The authors of the paper would like to thank the journal management for correcting the journals for the perfection of this paper
A. Wolf, C., Stephenson, M. W., Knoblauch, W. A., & Novakovic, A. M. (2016). Dairy farm financial performance: firm, year, and size effects. Agricultural Finance Review, 76(4), 532–543. https://doi.org/10.1108/AFR-02-2016-0009
Aabo, T., & Simkins, B. J. (2005). Interaction between real options and financial hedging: Fact or fiction in managerial decision-making. Review of Financial Economics, 14(3–4), 353–369. https://doi.org/10.1016/j.rfe.2004.12.002
Aarstad, J. (2010). When agents become principals: The possible perversion of the incentive based compensation in the Norwegian Academia. Innovation Journal, 15(3). Retrieved from https://www.scopus.com/inward/record.uri?eid=2-s2.0-78650785081&partnerID=40&md5=eaaf77458b9c492b3775723819af42ac
Abad, D., Cutillas-Gomariz, M. F., Sánchez-Ballesta, J. P., & Yagüe, J. (2018). Real Earnings Management and Information Asymmetry in the Equity Market. European Accounting Review, 27(2), 209–235. https://doi.org/10.1080/09638180.2016.1261720
Abad, J., Cabrera, H. R., & Medina, A. (2016). An analysis of the perceived difficulties arising during the process of integrating management systems. Journal of Industrial Engineering and Management, 9(3), 860–878. https://doi.org/10.3926/jiem.1989
Abarbanell, J., & Lehavy, R. (2003a). Biased forecasts or biased earnings? The role of reported earnings in explaining apparent bias and over/underreaction in analysts’ earnings forecasts. Journal of Accounting and Economics, 36(1-3 SPEC. ISS.), 105–146. https://doi.org/10.1016/j.jacceco.2003.11.001
Abarbanell, J., & Lehavy, R. (2003b). Can stock recommendations predict earnings management and analysts’ earnings forecast errors? Journal of Accounting Research, 41(1), 1–31. https://doi.org/10.1111/1475-679X.00093
Abata, M. A., & Migiro, S. O. (2016). Corporate governance and management of earnings: Empirical evidence from selected Nigerian-listed companies. Investment Management and Financial Innovations, 13(2), 189–205. https://doi.org/10.21511/imfi.13(2-1).2016.07
Abban, R., Omta (Onno), S. W. F., Aheto, J. B. K., & Scholten, V. E. (2013). Connecting the dots: A multiple case study of the network relationships of small and medium-sized enterprises (SMEs) in the non-traditional agricultural export (NTAE) sector of Ghana. African Journal of Economic and Management Studies, 4(1), 74–94. https://doi.org/10.1108/20400701311303168
Abbas, F. J., Nobanee, H., Khan, M., & Varas, J. (2017). The influence of supply chain management and net trade cycle on financial performance. International Journal of Supply Chain Management, 6(4), 51–60. Retrieved from https://www.scopus.com/inward/record.uri?eid=2-s2.0-85039982082&partnerID=40&md5=ba5fcebb35487b801bb66b2bf4855e09
Abbas, J., Raza, S., Nurunnabi, M., Minai, M. S., & Bano, S. (2019). The impact of entrepreneurial business networks on firms’ performance through a mediating role of dynamic capabilities. Sustainability (Switzerland), 11(11). https://doi.org/10.3390/su11113006
Abbas, S. Z. M., Mahmud, R., & Manan, N. S. A. (2017). Foreign ownership and performance of Islamic banks. Advanced Science Letters, 23(8), 7594–7596. https://doi.org/10.1166/asl.2017.9530
Abbasi, A., & Malik, Q. A. (2015). Firms’ size moderating financial performance in growing firms: An empirical evidence from Pakistan. International Journal of Economics and Financial Issues, 5(2), 334–339. Retrieved from https://www.scopus.com/inward/record.uri?eid=2-s2.0-84979828472&partnerID=40&md5=0c5b36e74aefb30ccc598041a3572cc0
Abbasi, M., Dadashinasab, M., & Asgari, M. (2013). Corporate governance mechanisms and chief executive officer (CEO) duality evidence from the food industry of Iran. Research Journal of Applied Sciences, Engineering and Technology, 5(20), 4816–4821. Retrieved from https://www.scopus.com/inward/record.uri?eid=2-s2.0-84877116354&partnerID=40&md5=008217b35cba09c72328dc4bc484033e
Abbasi, S., Abbasi, R., & Foghi, H. (2016). Examining the relationship between social responsibility and financial performance regarding the mitigating variable of organizational risk in the companies admitted in Tehran stock market. International Business Management, 10(11), 2124–2129. https://doi.org/10.3923/ibm.2016.2124.2129
Abd Hadi, Z., & Mcbride, N. (2000). The commercialisation of public sector information within UK government departments. International Journal of Public Sector Management, 13(7), 552–570. https://doi.org/10.1108/09513550010362631
Abdallah, A. A.-N., Darayseh, M., & Waples, E. (2013). Incomplete contract, agency theory and ethical performance: Asynthesis of the factors affecting owners’ and contractors’ performance in the bidding construction process. Journal of General Management, 38(4), 39–56. https://doi.org/10.1177/030630701303800404
Abdel-Maksoud, A., Cerbioni, F., Omran, M. F., & Ricceri, F. (2015). The use of non-financial performance indicators and organisational performance: An empirical analysis of Italian firms. International Journal of Business Performance Management, 16(4), 421–441. https://doi.org/10.1504/IJBPM.2015.072240
Ault, K., Childs, B., Wainright, C. F., & Young, M. (2011). Relevant factors to consider prior to an investor-owned acquisition of a nonprofit healthcare entity. Journal of Healthcare Management, 56(4), 269–280. Retrieved from https://www.scopus.com/inward/record.uri?eid=2-s2.0-79961227409&partnerID=40&md5=eebb6983e538a4fcc3d9cc314990b865
Christensen, C. M., Kaufman, S. P., & Shih, W. C. (2008). Innovation killers: How financial tools destroy your capacity to do new things. Harvard Business Review, 86(1), 98-105+137. Retrieved from https://www.scopus.com/inward/record.uri?eid=2-s2.0-38349098747&partnerID=40&md5=8325bdee2461b45116b57325bcf86b3f
Coyne, J. S., & Singh, S. G. (2008). The early indicators of financial failure: A study of bankrupt and solvent health systems. Journal of Healthcare Management, 53(5), 333–345. https://doi.org/10.1097/00115514-200809000-00010
Dotson, E., & Nuru-Jeter, A. (2012). Setting the stage for a business case for leadership diversity in healthcare: History, research, and leverage. Journal of Healthcare Management, 57(1), 35–44. Retrieved from https://www.scopus.com/inward/record.uri?eid=2-s2.0-84859182880&partnerID=40&md5=56277cc78cbb76b157b050bbbdf0587a
Dreachslin, J. L., Weech-Maldonado, R., Jordan, L. R., Gail, J., Epané, J. P., & Wainio, J. A. (2017). Blueprint for sustainable change in diversity management and cultural competence: Lessons from the National Center for Healthcare Leadership diversity demonstration project. Journal of Healthcare Management, 62(3), 171–183. https://doi.org/10.1097/JHM-D-15-00029
Harymawan, I., & Nowland, J. E. (2016). Political connections and earnings quality : How do connected firms respond to changes in political stability and government effectiveness ? International Journal of Accounting & Information Management, 24(4), 1–20.
Jensen, M. C., & Meckling, william H. (1976). Theory of The Firm: Managerial Behavior, Agency Cost And Ownership Structure. Journal of Financial Economics, 3, 305–360.
Jones, J. J. (1991). Earnings Management During Import Relief Investigations. Jour Nal of Accounting Reserch, 29(2), 193–228.
Rusdiyanto, Agustia, D., Soetedjo, S., Narsa, I. M., & Septiarini, D. F. (2020). Determinants of Audit Delay in Indonesian Companies : Empirical Evidence. Espacios, 41(3), 46–55. Retrieved from https://www.revistaespacios.com/a20v41n03/20410324.html#cinco
Rusdiyanto, & Narsa, I. M. (2019). The Effects of Earnings Volatility , Net Income and Comprehensive Income on Stock Prices on Banking Companies on the Indonesia Stock Exchange. Internasiotional Review of Manahement and Marketning, 9(6), 18–24. https://doi.org/https://doi.org/10.32479/irmm.8640
1. PhD Student of Faculty of Economics and Business, Universitas Airlangga Indonesia, Corresponding author: rusdiyanto.se.m.ak-2017@feb.unair.ac.id
2. Professor of Accounting of Faculty of Economics and Business, Universitas Airlangga Indonesia, Corresponding author: i-made-n@feb.unair.ac.id
[Índice]
revistaespacios.com

Esta obra está bajo una licencia de Creative Commons
Reconocimiento-NoComercial 4.0 Internacional