Espacios. Vol. 36 (Nº 11) Año 2015. Pág. 22
IT Project Portfolio Monitoring
Monitoramento IT Project Portfolio
Eduardo Garcia VASCONCELLOS 1; Renato de Oliveira MORAES 2
Recibido: 09/03/15 • Aprobado: 18/05/2015
Contenido
ABSTRACT: |
RESUMO: |
1. Introduction
This paper presents a project monitoring system developed for an Information Technology company. This company recently created its project management office (PMO), and the proposed system is one of the actions that enabled the PMO to reach its goals.
The study company, henceforward called EW Company, is a subsidiary of a multinational software developer for geographic information, engineering & processes, information management, utilities & telecom and public safety. These types of solutions involve high technology software and hardware coupled with support services, training, consulting and software development.
The company's business is divided into two units according to the target market segment. The first unit encompasses Process Engineering, Marine Industry and Oil & Gas and the second unit includes Georeference Systems, Utilities & Telecom, and Public Safety. The company's revenue, which is approximately U.S. $ 50 million annually, is split almost equally between the two units.
This paper is organized as follows: in chapter two, a literature review is presented; chapter three provides the research methodology; chapter four describes the studied company and the control and monitoring of the project development system and, finally, chapter five offers the concluding remarks.
2. Theoretical Review
Although the concept of design includes the quality of uniqueness, it is possible to identify common elements between projects and even certain patterns in the variability presented by these elements. Shenhar and Dvir (2007) suggest defining templates for managing different types of projects, and they argue that the variability of projects is not addressed in current management models. The question addressed by these authors, therefore, is how to combine the common and different elements in a single model to enable managers to classify projects and to make decisions about them. The authors present three primary factors that can be used to classify a project: goal, task, and environment.
Shenhar and Dvir (2007) aimed to define a model to characterize projects that does not depend on the market, the technology or the type of organization to which the project relates; they presented the diamond NTCP model (novelty, technology, complexity and pace).
Figure 1 presents this model; it considers four dimensions that characterize projects, which are detailed below.
The Novelty dimension measures how new the product design is in its market and how new to potential users. Novelty measures the familiarity of the potential user with this type of product, its use and its benefits. The degree of novelty can be divided into three types: derivative, platform and breakthrough. The type will impact the project management of the product. According to the authors, the newness of the product will affect three main factors: trust in the market research, the time necessary to define product requirements and marketing strategies.
The Technological dimension is related to the technological uncertainty involved in the realization of the project. This uncertainty impacts the planning, testing, communication, and technical skills of the development team. There are four levels measuring this dimension: low-tech, medium-tech, high-tech and super-high-tech.
The Complexity dimension is related to the hierarchy of levels for the systems and subsystems that comprise the product design, which the authors call "system scope". If the product consists of a simple arrangement of subsystems, the project is considered to be of low complexity. In the case of a product formed by a complex arrangement of subsystems that are composed of other subsystems, and so on, then the project is considered to be of high complexity. The authors define three levels of complexity: assembly, system, systems array.
The Pace dimension measures the urgency with which the project (time available) should be addressed. Generally this urgency is related to time to market. This dimension affects the autonomy of the project team, bureaucracy, the speed of decision-making, and the intensity of senior management's involvement in project execution. There are four levels to this dimension: regular, fast/competitive, time critical, and blitz.
The Diamond NTCP model therefore combines specific categories of projects in each dimension. The model provides a graphic illustration (diamond shape) of the project according to the levels of novelty, technology, complexity and urgency (pace). The objective of the model is, firstly, to illustrate the type of project that is being worked on and to prioritize the measures of success and, secondly, to serve as a tool to analyze how the methodology of project management fits each project type.
Maximiano (2006) presents an approach for the classification of projects that uses two of the four dimensions of the NTCP diamond model of Shenhar and Dvir (2007): uncertainty and complexity. The author defines uncertainty in projects as the lack of income or a way to get to it or both. The lack of information about a new product also increases the uncertainty and risk associated with it. Complexity is treated by the author as the number of variables related to the project development. A complex project is one that administers to a large number of variables. Uncertainty and complexity are scales. Thus, the author presents an approach that categorizes projects into four types, as illustrated in Figure 2.
According to Carvalho and Rabechini (2006), one of the most frequently used techniques for measuring and monitoring project performance is Earned Value Management (EVM). This technique compares the value of work completed to the amount originally allocated in the budget, integrating areas of scope, cost and schedule. It uses two index to measuring performance: a cost performance index (CPI) and a schedule performance index (SPI). The CPI is the ratio of the earned value (EV) and the actual cost of the project observed (AC). If the value of the CPI is less than 1, the project is consuming more money than planned; if it is greater than 1, the project is consuming less money than planned; and if it is equal to 1, the cost is exactly equal to the observed planned value.
Earned value is the value of the work actually performed. The SPI is the ratio between the earned value and the value of planned work (PV). If the value of the SPI is less than 1, the physical progress of the project is slower than planned (the project is delayed); if greater than 1, the physical progress of the project is faster than planned (the project is ahead of schedule); and if it equals 1, the physical progress of the project is the same as planned.
One of the defining characteristics of a project is that it has a beginning, a middle and an end. The life cycle of a project consists of a set of stages, ranging from the beginning of the project until its end. Carvalho and Rabechini Jr. (2006) argue that this concept helps managers to lead projects in a more linear fashion and that the phases help to understand the expected outputs. Thus, project control becomes more professional because the team members must satisfy the requirements of each phase.
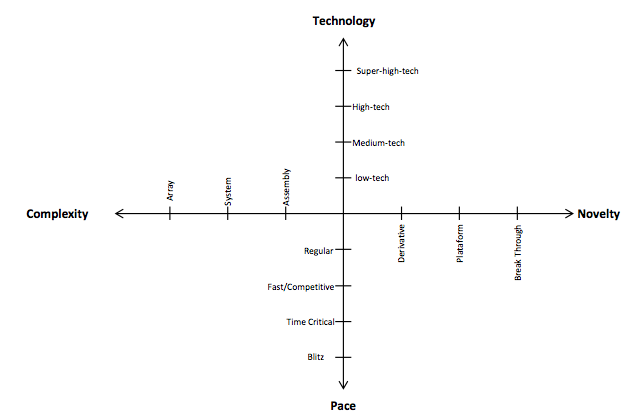
Figure 1 – Diamond NTCP model. Source: Shenhar & Dvir (2007)
Archibald (1992) presents a model for the project life cycle with five phases: Concept, Definition, Design, Execution, and Implementation.
PMI (2008) details more stages, proposing required outputs over the life of the project: specifications at the end of the concept phase, progress reports during the execution and a closure report after implementation. PMI also proposes documentation that should be drawn up: a project charter to launch the project, an execution plan, acceptance documents and an approval document for the initial implementation.
The separation between the phases is not always easily identifiable. Archibald (1992) argues that at each stage, a general review of the project up until that point should be taken. The result of its revision would be the decision about the direction of the project: to follow to the next phase, to redo the previous stage or to cancel the project.
Arcalá and Moraes (2010) performed a similar study and report positive results in the application of procedures and techniques for monitoring of the project portfolio through the performance of a newly created PMO within the organization.
The Project Management Institute (PMI) defines a project management office (PMO) as an organizational body responsible for centralizing and coordinating the management of all projects under its domain. The responsibilities of a project office can range from the provision of support to direct management (PMBOK®, 2008, p.443).
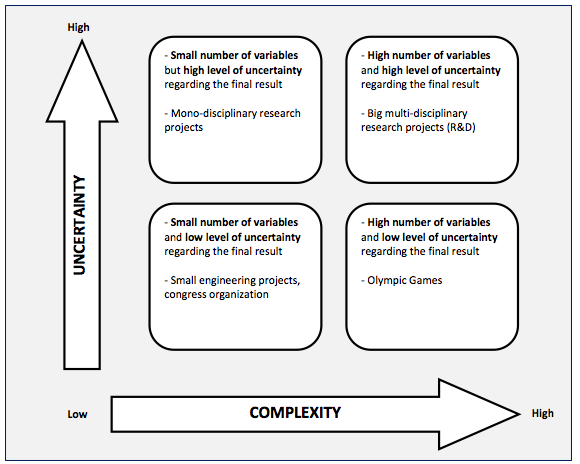
Figure 2 – Categories of projects based on complexity and uncertainty. Source: Maximiano (2006)
Carvalho and Rabechini (2006) argue that the project management office is a hub (core competencies in project management) that aims to consolidate the project area. The PMO consists of a structure devoted to applying project management concepts to increase project efficiency and thus transform strategies into results.
A PMO can increase the efficiency of projects in terms of cost, time and scope. The office may vary in terms of structure, size, responsibilities, and operations. According to Rad and Levin (2002), the functions of a PMO are project support, training, implementing process/project management methodologies, internal consulting, monitoring, developing management tools, and portfolio management.
Kerzner (2006) states that the project office is an organizational unit that is responsible for maintaining the intellectual property relating to project management and actively supporting the strategic planning of the corporation. According to this author, the use of a project office provides the following benefits to the executive levels of management: the standardization of operations; decisions based on the corporation as a whole and not on individual strongholds; better capacity planning (allocation of resources); faster access to better quality information; the elimination or reduction of individual strongholds in the company; more efficient and effective operations; less need for restructuring; fewer meetings that consume the precious time of executives; realistic prioritization of work; and the development of future general managers.
Kerzner (2006) states that there are three types of project offices:
- Functional Project Office: this type of PMO is used in a functional area or division of an organization, such as information systems. The primary responsibility of this type of project office is to manage a critical set of resources (resource management).
- Client Group Projects Office: This type of PMO aims to better manage and communicate with clients. Customers or joint projects are grouped to enable better management and better relationships. There can be multiple project offices simultaneously, based on groups of clients, and each may end up working as a temporary organization. In practice, this type acts as a company inside the company.
- Enterprise Project Office: this type of project office serves the entire corporation and focuses on strategic and corporate issues and not on functional issues.
Dinsmore (1998) proposes four models for a project management office: (i) Project Support Office (PSO); (ii) Project Management Center of Excellence (PMCOE); (iii) Program Management Office (PrgMO); and (iv) Chief Project Office (CPO).
3. Methodology
The collected data can be divided into qualitative and quantitative data. Qualitative data were obtained through interviews with project managers, functional managers, and account managers in the commercial area.
During the interviews with project managers and functional managers (there are cases where the same person assumes both positions), we gathered information about the methodology and processes of project management, changes in the scope of their recurring projects, the actual status of projects (often different than the present status of the company ERP system), along with other information regarding best practices and lessons learned. Eight interviews were conducted with project managers (three of which are leaders in the area) and one interview with a functional manager who is not a project manager. These interviews were semi-structured to both cover some key points and to allow wider discussion of other points. For example, a structured interview was used to collect data about project time and cost. However, to gather information about difficulties and scope changes during project execution, the interview was not fully structured, and each manager was free to express their opinions on the subject.
Some information related to items included in the proposal and the schedule for specific projects were only obtained through conversations with managers of the commercial area. Because some project managers left the company during the execution of certain projects, management information was lost. Three interviews with the business account managers were conducted to obtain information about the projects. These interviews were similar to the interviews with project managers and functional managers. Some large projects from large customers simply did not have any management schedule originally planned; there was no monitoring of what was done versus what was planned and no monitoring of billing, etc. In one of these cases, a project delayed two months without any billing because the responsible for the project measurements left the company; without this manager, the company had no control of what had actually been made and therefore stopped billing. These situations represent significant internal process failures.
The quantitative data were obtained from the database of the company's ERP system and the reports provided by the project managers.
When the client formally accepts the project proposal, the commercial area creates a project in the company's ERP system, and it registers the proposal and the items that comprise it. To better characterize the company's projects, information about active projects was obtained as well as finished projects occurring since early 2012. Furthermore, information about the balance of finished projects was also collected. All of this information will be detailed in the next sections.
During the verification of the project status, several interviews with project managers were conducted to obtain quantitative performance indicators for the biggest finished projects. These data include information about planned versus executed schedule and sold hours versus performed hours.
4. Case Study
This study was realized in a company that is a subsidiary of a software developer for geographic information and engineering processes, information management, utilities and telecom and public safety. These types of solutions involve high technology software and hardware coupled with support services, training, consulting and software development.
The company was founded in 1980 and currently has 143 employees. In the second half of 2011, the company was purchased by a European multinational that had bought the software developer some years before. Although the acquisition was realized some years ago, there are still remnants of the adaptation process due to the merging firms.
The company is divided into three major functional areas: technical, commercial and administrative. The technical department is responsible for the operational development processes of projects and routine activities such as service (help desk), training (regular schedule), and maintenance, among others. The business is responsible for sales. The administrative area is related to the administrative processes that keep the business running, such as payments, contracts, HR, marketing and IT.
Figure 3 shows the organizational chart illustrating the three major functional areas.
The board is composed by the President and Vice President and the European multinational, until its CEO. Within each functional area, there is a wide layer of directors that centralizes the power in each area. Both the technical area and the commercial area are divided according to the business unit in question (Process Engineering, Naval & Oil and Gas, and Utilities & Telecom, Government and Safety). Therefore, there are two commercial directors and two technical directors. Each business unit is divided into three functional areas, as illustrated by the chart, and each functional area has a functional manager in control of the area. Within each functional area, there are different positions, such as solutions consultant, analyst, solutions architect, developers and interns, all reporting to the area leader.
The company offers solutions in the areas of Marine, Plant Design and Engineering (Area 1),and the segments Safety, Government & Infrastructure (Area 2). In addition to offering IT solutions in the areas mentioned above, the company also offers support, training and consulting services. Therefore, the company offers turnkey solutions (no development of specific solutions, customization of existing products only), sold in the form of projects and services that complement the projects.
The company's projects can be divided into five groups according to their basic characteristics: Solution Implementation Projects, Multifunctional Solutions Implementation, Development of System Interfaces (communication between internal and third party systems), Process Mapping Projects, and Upgrade of Version.
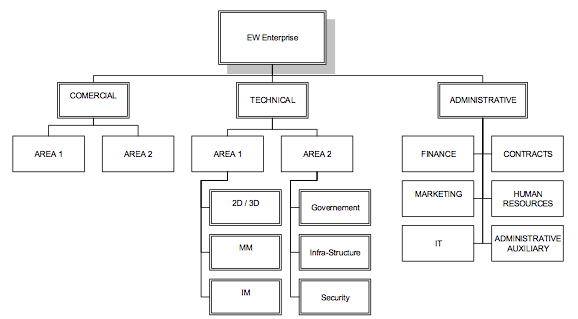
Figure 3 - EW Company organization chart
The company's projects can be characterized by two different approaches to project categorization. One is the approach presented by Maximiano (2006) and the other is the Shenhar and Dvir approach (2007). Interviews were conducted with the director of the PMO to define the values for each dimension (Complexity, Uncertainty, Rhythm and Novelty) for each type of project.
Two meetings for setting these values were conducted and an initial approach was analyzed (Maximiano) and then a second approach was analyzed (Shenhar and Dvir (2007).
Table 1 shows the values on a seven-point scale (0 = less uncertainty and complexity; 6 = greater uncertainty and complexity) for each type of enterprise project. A graph was constructed using these values (Figure 4). The graph shows each type of design according to the concepts of Maximiniano (2006).
Moraes and Laurindo (2003) present an approach to evaluate sets of projects. Although they focus on IT project composition, their work shows the importance of executive's participation choosing and evaluating subjective project performance criteria.
Moraes and Kruglianskas (2012) recognize the importance of project manager on IT project performance and on development environment inside IT organizations. The IT project manager behavior and performance (and consequently project performance) is also cause and consequence of his or her environment.
The project monitoring and controlling process (ex cursus evaluation) should be linked with project success evaluation (ex post evaluation). Despite this, IT project performance evaluation has some special features points out in others works (MORAES and LAURINDO, 2013; MORAES, LAURINDO e PEREIRA, 2011)
PROJECT TYPE |
UNCERTAINTY |
COMPLEXITY |
Unique Solution |
2 |
2 |
Multiple Solutions |
4 |
5 |
Interface Development and Customization |
5 |
4 |
Process Workflow Definition |
1 |
2 |
Software Upgrade |
2 |
4 |
Table 1 - Uncertainty and complexity by project type
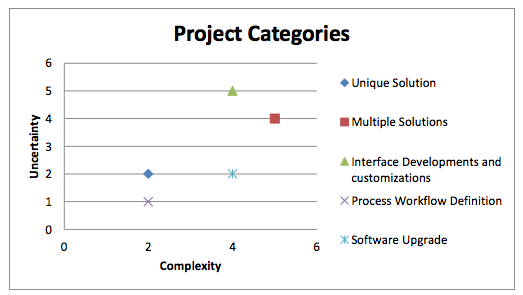
Figure 4 - Uncertainty and complexity by project type
An analysis of the graph shows that the Interface Development and Implementation projects that involve more than one solution (families of software) are more susceptible to internal and external risks. Therefore, a more multidisciplinary approach is required for project execution to manage the diversity and volume of information (interfaces and communication between various software) and the greater number of organizations involved. The development and customization of interfaces is considered the type of project with the greatest uncertainty because it involves software and systems from other suppliers, which often creates risks related to compatibility, communication, flow of information, developing policies, and data protection.
In the sequence, a similar analysis of the types of projects was performed according to the concepts of Shenhar and Dvir's (2007) model (Figure 5).
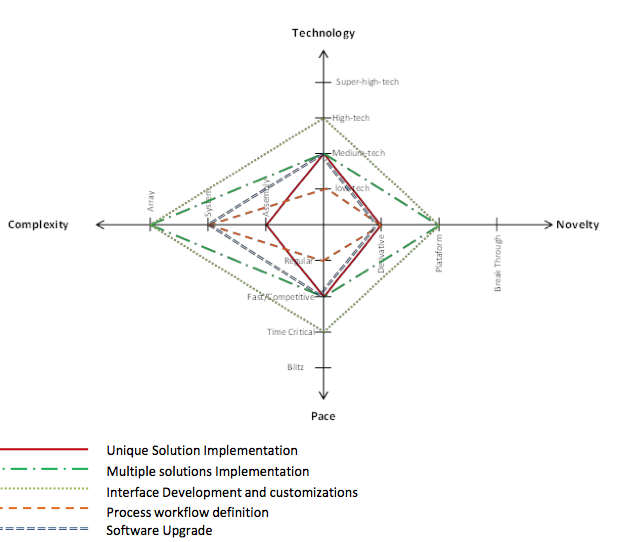
Figure 5 - Types of projects - Model NTCP of Shenhar (2007)
The life cycle of the company's projects can be divided into four main phases, and a fifth phase of post-sales, which is characterized by the provision of services after project closure. Post-sales and any services involved, because it does not belong to the duration of the project, was not considered a project phase. The four stages of the life cycle are Pre-sales, Planning, Execution and Closure.
Figure 6 illustrates the general flow between project phases, from opportunity identification to project closure, in addition to the documents associated with each interface between the phases.
In 2008, EW Company hired a management consultancy to define a methodology for project management. The methodology presented is based on the PMI standards and seeks to integrate the practices of project management with the company structure. The methodology was tested on two major projects (projects of approximately 5,000 hours) and was approved by the executive management of EW Company based on the results. Information on the company's project management methodology and its implementation was obtained through conversations with the two heads of the technical areas (areas 1 and 2), a project manager and a functional manager (leader of the technical areas), all of whom participated in the development, testing and deployment of the methodology. The existing documentation within the organization was also used.
The interviews with project managers and the data from the company ERP system for all projects started in 2012 and already closed (until May 15, 2013) identified that 71% of the projects were completed with delay and only 29% completed within the original schedule.
A total of 65 projects were analyzed, and most of them were from area 1. More than two thirds of the projects were delivered after the planned deadline. The managers responsible for projects that showed greater delays identified some of the causes: scope changes without planning review, estimation errors, client infrastructure problems, lack of resources, resources that left the company during project implementation (with no available replacement), and management problems.
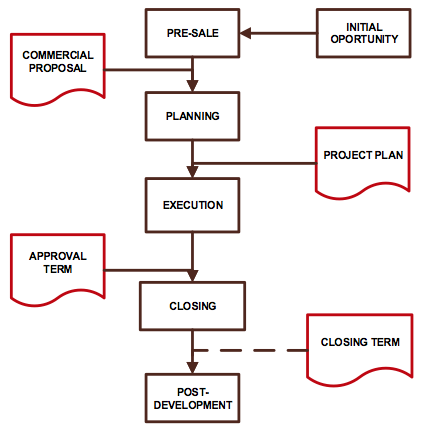
Figure 6 - Stages of the project life cycle
The use of hours in these projects versus the number of hours sold was also identified. This search was performed using the data available on the company's ERP system based on the labor hours performed for each project and the commercial and finance areas. It was found that 55% of projects used more hours than originally estimated, and only 45% consumed fewer than or equal to the budgeted hours.
In the 65 projects reviewed, 36 projects used more hours than the number sold. Examining these 36 projects more deeply revealed the results presented in Figure 7. For these projects, just over 8,500 hours were sold but over 13,000 hours were spent in execution. This difference represents a little more than a third of what was sold. In other words, there was an increase of approximately 50% of the time consumed in relation to time sold.
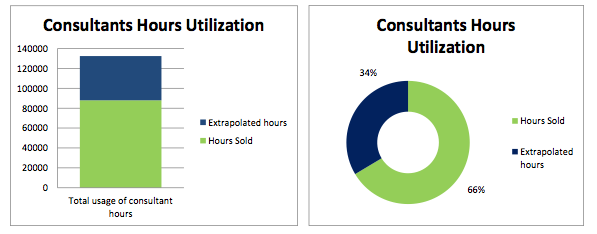
Figure 7 - Analysis of extrapolated hours spent on projects
From a qualitative point of view, the scope changes that occurred in some projects had significant impacts on time. Some examples of this situation are as follows:
- Creation of new environments: in one project, it was decided to use two computational environments (approval and production). However, during the execution of the project, the client realized the importance of a new (third) environment for development.
- Infrastructure: the primary factor responsible for the delay of one project, as identified by the area leader of the GI department, was the client's decision to change the infrastructure network and operating system of the servers. The project therefore required a change to adapt to the client's new structure.
- Change of customizable reports: One of work packages for a project in the GM department involved the development of five reports to be extracted from the system. However, the client requested a change to four of the five reports during project development, which resulted in delays and increased working hours.
- Creation of new work packages: the manager of one of the analyzed projects had to create two new work packages that were not in the original project scope at the client's request; this change was formalized only in the late stage of project execution and required a rework, also causing problems in resource allocation.
5. Proposal
The developed control system addresses three main points: the monitoring and control of ongoing projects, the disclosure of their performance to the various stakeholders, and, more broadly, risk management, quality, and scope changes during project execution.
All projects will be monitored by the project management office through the proposed control system; however, the monitoring approach will vary according to the project category.
The PMO is a recently created unit and therefore has limited resources to enable the strict monitoring of all ongoing company projects (approximately 50). Thus, the projects are divided into two groups. One group will contain the simpler, smaller and less strategic projects; their monitoring will be less accurate, the detailed collection of information will occur less frequently, and performance reports will be general and not specific (general data will be presented, rather than specific). This approach is called the Simplified Approach. The other group contains the largest, most complex, and most strategic projects for the company. They will be managed using the Detailed Approach.
Projects with the following characteristics will be considered to be simplified:
• Novelty: Derived or Platform
• Technology: Low and/or Medium technology
• Complexity: Assembly and System
• Pace: Regular or Fast / Competitive
The projects that fit within the shaded area of Figure 8 are monitored using the Simplified Approach. The criteria used to select the approach should be revised frequently to keep it evenly aligned with business strategy; an annual review of these criteria is suggested. The PMO should regularly seek to update the selection criteria to remain as flexible as possible as regards project monitoring, i.e., the PMO should select projects that require more critical monitoring and should update this selection according to the changes in the company, the customers and the market.
Projects that exhibit any of the following characteristics, regardless of other dimensions, are covered by the Detailed Approach:
• Novelty: Breakthrough
• Technology: High-tech or Super High-tech
• Complexity: Array
• Pace: Time critical or Blitz
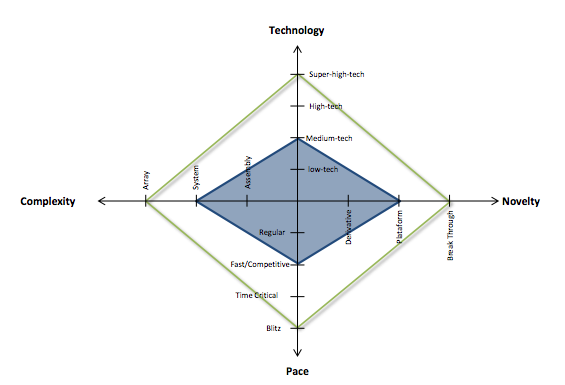
Figure 8 – NTCP Monitoring Approach
Thus, we define two approaches: simplified and detailed. The simplified approach is associated with most projects because most projects require an implementation type of solution or an upgrade solution, which have, in general, the form shown in Figure 5.
Analyzing the data obtained and the number of projects, approximately 80% of the projects would be covered by the simplified monitoring approach. The detailed discussion will be directed toward the most difficult projects and will present the critical characteristics of one or more dimensions of the NTCP model. These projects are in the minority, but they are much larger in size and importance (financial and strategic) and involve more extensive work by consultants, the project manager, technical directors, account managers and even top executives.
Project monitoring using the Simplified Approach has the following characteristics:
• Mandatory collection of RSAP and scheduling in standard format in MS Project platform once a month, and optional once a week
• Collection and storage of required documents that characterize the transition phases of the project life cycle
• Mandatory update of the control system data once a month, and optional once a week
• Mandatory presentation overview of ongoing projects for high-direction once per quarter
• PMO participation in all kick-off meetings for new projects
• Focused approach to support and follow-up
• Risk and quality analysis
Project monitoring using the Detailed Approach has the following characteristics:
• Mandatory collection and RSAP scheduling in MS Project format every week; levying RSAP schedules and following through on items not delivered
• Audit the completion and updating of RSAPs and timelines
• Collect and store required documents that characterize the transition phase of the project life cycle
• If the project performance is very poor (SPI <75% and / or CPI <75%) during a phase, a meeting should be held between stakeholders to discuss the project progress
• Update the control system data weekly (mandatory)
• PMO participation in all kick-off meetings for new projects
• Mandatory presentation of ongoing projects for this group
• Project management approach that moves beyond control and monitoring support
• Database of project risks, scope changes, and quality control is maintained in the RSAPs
5.1. Reporting to the company board
The purpose of reporting to the board is to present the actual performance of the portfolio of projects to the company's top management. In addition, these reports are important because they disclose the problems and difficulties faced by major projects. Thus, the presentations aim to align the board high-direction with the actual status of the project portfolio and the problems faced. In addition to the report, this disclosure may also occur in the quarterly meetings involving the PMO and the company directors.
Thus, we define the information contained in the reports presented to the board to provide an overview of the projects (number of projects delayed versus on time, projects within budget versus off-budget) and an overview of projects per functional area. Figure 9 illustrates the report for the senior management of EW Company. The bubble chart in the lower right corner shows the project performance along two dimensions: SPI and CPI on the horizontal axis and the performance index of Earned Value on the vertical axis. The bubble size indicates the size of the project in terms of sold value (monetary).
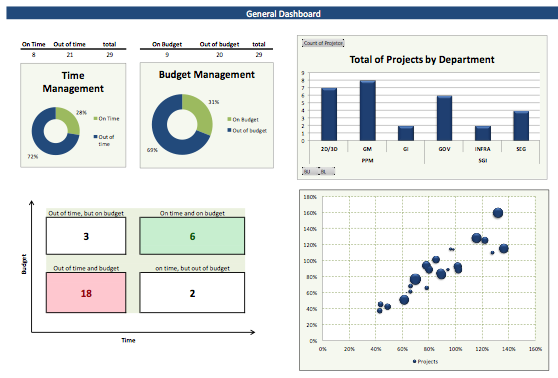
Figure 9 - Top Management Report
The top management report contains indicators for the company's major ongoing projects. Data from the five largest projects in terms of sales value, or, in special cases are presented, according to other factors to be determined retrospectively. Figure 10 illustrates the proposed report, which is very similar to the report to be sent to functional management, as detailed in the following section.
Reporting to functional management allows for the alignment of managers and project teams regarding project progress. Reports are issued by area. This alignment creates awareness on the part of those involved in projects with respect to performance issues, risk trends and the next steps identified for each project as well as the critical points of care and the strategic objectives for the development of the project.
Multi-functional projects (involving more than one functional area) are included in the reports of two areas. The report is divided into two blocks, one that presents the performance indicators of the project area and the other presenting an executive summary of the project (more qualitative). The indicators in the first block include the SPI, risk and quality information, the S curve, and a visual indicator (light) indicating the general status of the project. Red means that the project is in imminent danger because of the high risk or because of performance problems. These are projects that require extra attention from the PMO, the manager and the project team. Figure 11 illustrates an example report with indicators for functional management showing part of the projects.
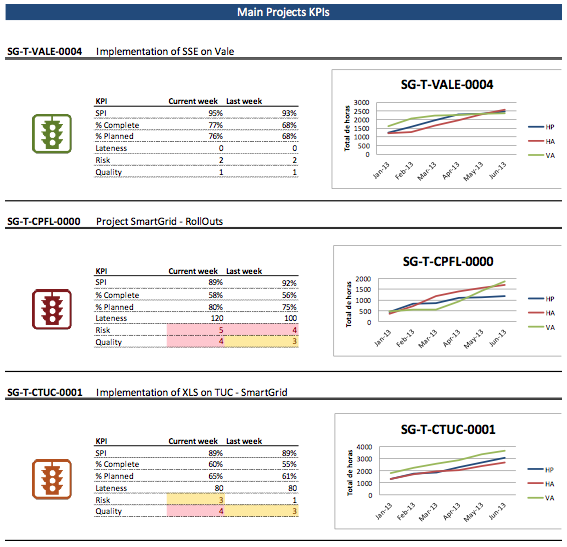
Figure 10 – Top management report - major projects
The executive summary can be viewed in Figure 12. This summary offers more detailed descriptions of the risks involved in each project, the quality problems, critical points requiring attention, potential impacts on other company projects, and next steps to be undertaken during the project.
It is also proposed that project performance be disseminated through the presentation of projects in public areas of the company, the disclosure of information in the company newspaper (newsletter), and disclosure in the quarterly report released via corporate email.
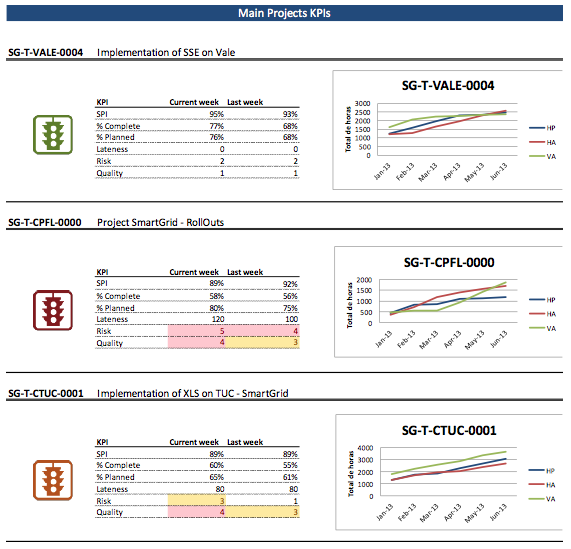
Figure 11 – Functional management reports - indicators for major projects
The presentation in public areas may involve notifications and postings in the cafeteria and on the bulletin boards in each area. In this case, it is suggested that the data shown in the technical areas be restricted to projects for that specific area.
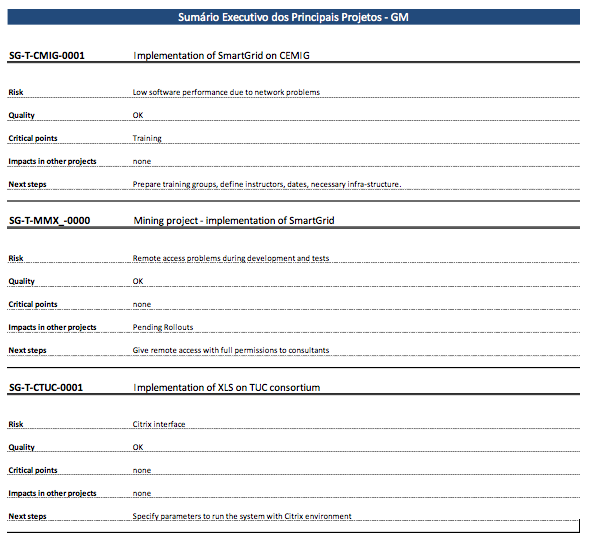
Figure 12 – Functional management report - executive summary of major projects
6. Final Remarks
This paper presented a project tracking and monitoring system for an IT company. The increasing demand for ever larger and more complex projects has forced EW Company to recognize the importance of project management as a tool for improving their performance. This recognition was initially expressed by defining a methodology for managing projects and then by the recent establishment of a project management office within the corporate structure. Because this event occurred in early 2013, the PMO did not yet have a structured process for managing projects, particularly procedures for monitoring and controlling project performance. The creation of a formal monitoring process provides visibility and traceability, which impacts the project performance and allows the identification of the most critical points for development projects. At this time, the system is deployed within the organization, and it is expected that, in the future, the data generated by this monitoring process can contribute to the improvement of management processes under a quality assurance perspective; in other words, it will be possible to act before potential problems arise.
References
ARCALÁ, L. S. and MORAES, R. O. Project management office function – small project portfolio control. Product: Management & Development – PMD. Vol. 8 nº 1 June 2010
ARCHIBALD, R. D. Managing high-technology programs and projects 2nd edition, John Wiley & Sons; 1992.
CARVALHO, M. M.; RABECHINI, R. Construindo Competências para Gerenciar Projetos. Teoria e Casos. Editora Atlas, São Paulo, 2006.
DINSMORE, P. C. Winning business with enterprise project management. New York: AMACOM, 1998.
MAXIMIANO, A. C. A. Administração de Projetos, Como Transformar Ideias em Resultados. 2ª edição. Editora Atlas. São Paulo. 2006.
MORAES, R. O and LAURINDO, F. J. B. Performance evaluation of IT projects - The Shenhar and Dvir model. Journal of Technology Management and Innovation. Vol 8 pp. 15 – 24, 2013
MORAES, R. O. and KRUGLIANSKAS, I. O gerente de projetos de TI em organizações com níveis de maturidade diferenciados. Revista Produção, vol.22, no.4, p.839-850, Dez 2012.
MORAES, R. O., LAURINDO, F. J. B. and PEREIRA, P.M.S. Ex-post evaluation of the information technology (IT) projects. Espacios. vol 32, 2011.
MORAES, R. O and LAURINDO, F. J. B. Um estudo de caso de gestão de portfolio de projetos de tecnologia da informação. Revista Gestão e Produção. vol.10, no.3, p.311-328, Dez 2003.
PMI, Project Management Institute. A Guide to the Project Management Body of Knowledge (PMBoK). 4rd edition. Project Management Institute Inc.
RAD, P. and LEVIN, G. The advanced Program Management Office: A look at function and implementation. Boca Raton, FL: St. Lucie Press, 2002.
SHENHAR, A.; DVIR, D. Reinventing Project Management. Harvard Business School Press, Boston, Massachusetts, 2007
1. Production Engineering Dept. of Polytechnic Engineering School, University of São Paulo (USP), Brazil. edu.gvasconcellos@gmail.com
2. Production Engineering Dept. of Polytechnic Engineering School, University of São Paulo (USP), Brazil. remo@usp.br