
 HOME | ÍNDICE POR TÍTULO | NORMAS PUBLICACIÓN
 Espacios. Vol. 37 (Nº 07) Año 2016. Pág. 19
Jhon Wilder ZARTHA Sossa 1; Fernando PALOP Marro 2; Bibiana ARANGO Alzate 3; Fabián Mauricio VELEZ Salazar 4; Andres Felipe AVALOS Patiño 5
Recibido: 01/11/15 • Aprobado: 28/11/15
4. Why is the S curve technology indicator accumulative?
8. Potential for new applications
ABSTRACT: In this article, the methodology of curves in S is applied in series of data on articles in Biotechnology and Nanotechnology since 1956 obtained from the ISI Web of Science and of patents since 1962 (year of priority) and 1970 (year of publication). Belonging to controlled release, of the medical context, the data was obtained from a Tech Mining approach using the Vantage Point software tool. With the accumulated data, in time, nonlinear regression was achieved and the inflection point in the two series was calculated, taking into account the statistical parameters like Fitted R2, Value T, Value P, and Durbin Watson. The data of the articles and patents were analyzed under the following models: Weibull, Gompertz, Logistic and Sigmodial, among others, for a total of 13 models analyzed. The models with the best fit in the inflection point were selected. In the series of data from the articles, one of the models that had the best fit was the Sigmoidal model. The Sigmoidal model contained three parameters which generated a value of 33.4 for the inflection point for the year of the studied series. With the obtained values for the inflection points in the series of articles and patents, the uncertainty can be reduced in the making of decisions about the Technology Life Cycle (TLC), especially in the following aspects: the identification of the kind of technology (before and after of the inflection point), the determination of the suitable moment to apply technological rights and intellectual property, and the establishment of strategies for monitoring (when the technology is emerging) and investment. |
RESUMEN: En este artículo, la metodología de curvas en S se aplica en la serie de datos sobre artículos en Biotecnología y Nanotecnología desde 1956 obtenidos de la ISI Web of Science y de patentes desde 1962 (año de prioridad) y 1970 (año de publicación). La pertenencia a una liberación controlada, del contexto médico, los datos se han obtenido a partir de un enfoque de Minería Tech utilizando la herramienta de software de punto de mira. Con los datos acumulados, con el tiempo, se logró la regresión no lineal y se calculó el punto de inflexión en las dos series, teniendo en cuenta los parámetros estadísticos como Equipada R2, T Valor, Valor P, y Durbin Watson. Los datos de los artículos y patentes fueron analizados bajo los siguientes modelos: Weibull, Gompertz, Logístico y sigmoidal, entre otros, para un total de 13 modelos analizados. Se seleccionaron los modelos con el mejor ajuste en el punto de inflexión. En la serie de datos de los artículos, uno de los modelos que tenían el mejor ajuste fue el modelo sigmoidal. El modelo sigmoidal contenía tres parámetros que generan un valor de 33,4 para el punto de inflexión para el año de la serie estudiada. Con los valores obtenidos para los puntos de inflexión en la serie de artículos y patentes, la incertidumbre se puede reducir en la toma de decisiones sobre el ciclo de Life Technology (TLC), especialmente en los siguientes aspectos: la identificación de la clase de tecnología (antes y después del punto de inflexión), la determinación del momento adecuado para aplicar los derechos de propiedad intelectual y tecnológica, y el establecimiento de estrategias para el seguimiento (cuando la tecnología está emergiendo) y la inversión. |
Some years ago, the academic, scientific, and business communities have attempted to comprehend the behavior of technology in time with the use of strategies that could be implemented through that trajectory. Some authors affirm that one alternative for the analyses of technologies in time is the S curve models (Kucharavy & De Guio, 2007), (Zartha 2009), (Perez, 2001), (Ortiz & Pedroza, 2006), with which it is possible to identify if a technology is emergent, entrant, key or declining; S curves can also make it possible to identify if a monitoring strategy, selective investment or no over-investment should be established, and to determine the phases of initial diffusion, early growth, late growth and maturity of a technology.
In the present document, the way a technology behaves in time is analyzed by means of S curves, taking the quantity of accumulated publications and the accumulated patents as performance parameters.
To obtain the S curves from these technologies, series of data were used from articles belong to Biotechnology since 1956; beginning with the ISI Web of Science and Patents from 1962 (priority year) and 1970 (publication year). Data was obtained using the software tool Vantage Point. The data was accumulated and later non-linear regressions were conducted on different sigmoidal mathematical models, taking into account statistical parameters as: R2, t value, p value, and Durbin Watson. The data series were analyzed with the Weibull, Gompertz and Logistic models, amongst others. A total of 13 models were analyzed, which obtained the values of the parameters of each model. Finally, the inflection point of the series was validated through means of the second derivative.
Different to previous works done in the analysis of the technology life cycle, this work presents an analysis of the inflection points of the technology based on the accumulated series of articles and patents. In this manner, with more precise information of the changes in the S curves, uncertainty can be reduced in the decision making process regarding the technology life cycle; especially in the following aspects: the identification of the type of technology (before and after the inflection point), the determination of the adequate moment to apply technological right mechanisms and intellectual property (convenient to protect before the inflection point), the establishment of strategies for monitoring (when the technology is emerging) and investment ( avoid over-investment after the inflection point).
The data for the construction of the S curves come from the scientific publications and patents about interest technologies, it is necessary to take into account previous scientometry concepts like some analyses that were done beforehand on the technology life cycle of the technologies.
This paper is organized as follows: An introduction where the importance of analyzing the technology life cycle and calculating the inflection point on cumulative data of articles and patents is mentioned. Then, the background is presented with the developments made in the recent years about the S curves, the distribution of time of the production knowledge regarding scientometry, an explanation about what the technology life cycle is and the necessity of analyzing it through accumulated performance parameters. Next, the process to analyze articles and patents of accumulated data, and examples on biotechnology (controlled released materials) and nanotechnology (solid lipid nanoparticles) are shown through a summarized methodology. Conclusions and limitations are shown after emphasizing on the potential applications of the methodology, such as using a third performance parameter that complements articles and patents, and the possibilities of generating S surfaces. At the end of the article, there is an annex with the search equations of an algorithm used for this study in order that the reader may be able to find the analysis criteria and apply this methodology in these areas of study or other areas of knowledge.
The S curves method, given its easy practice, has become a widely used tool in a broad range of applications, now that using it shows appropriate forecast results in a wide spectrum of systems (Ávalos et al., 2012). On the other hand, some authors like Modis (2007) and Schilling (2012) affirm that S curves as forecasts tools have some limitations. Some S-curve applications can be: the projection of the yield of new technologies, market penetration studies, population change forecasts, macro economical and micro economical analyses, diffusion mechanisms of technology, amongst others (Kucharavy & De Guio (2007); Modis (2007) and Schilling (2012)). The S curve models serve as an understanding for dynamics of change, to reveal patterns, causes, probabilities and possibilities in social, political, economic and technological systems, also for future studies with components for exploratory forecasting hypotheses in order to identify patterns of change in long term significances as long as 25 years or more (Stackelberg, 2009). The International Institute for Applied Systems Analyses IIASA, Laxenburg, Austria, has been applied in different fields for more than 35 years in order to identify particular variable growth in crime and terrorism, environmental changes, transport system substitution, amongst others (Kucharavy & De Guio, 2007).
Foxon et. al (2007), in the report Energy Technology Innovation: A Systems Perspective made for the United Kingdom government, used the S curve models to describe, qualitatively, the continuity that public policies should have in relation to the market penetration of technological innovations regarding the energetic market.
Furthermore, Modis and Debecker (1992) used S curves, and their relationship established at the beginning and end of the curve with the chaos theory, to find both erratic fluctuations at the end of the curve. His analysis is based on placing a discreet solution into the differential equation and an interpretation of several constants within the logistic growth models.
Zartha et al. (2009, 2010) have worked in the application of this methodology in products and technologies of the chemical, Agroindustrial, and pharmaceutical sector since 2007, using collections of data that described their performance in time. With their application in innovative product diffusion in the aforementioned sectors, they demonstrated that the accumulated product life cycle have a similar behavior to population growth with which strategic decisions can be implemented based on the evaluation given by the curve.
In studies related to the use of S curves, different stages or phases are identified, bounded by specific points in their growth. This evolution has been studied by authors like Nelson and Winter (1977), Dosi (1982), Pérez (2001), and Modis (2007), amongst others. Ortiz and Pedroza (2006), describe the evolution of a technology and its trajectory by means of the S curves. (Figure 1).
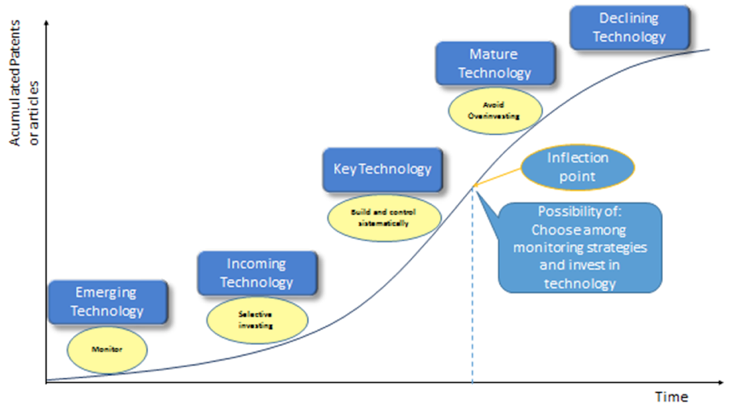
Figure 1. Evolution of a technology. Adapted from Ortiz & Pedroza (2006).
In accordance to the aforesaid, to academics, researchers, businessmen and in general for the stakeholders interested in the actions around technology: Imports, exports, diffusion, creation, and modification is relevant to analyzing the performance of technology from its own S curve, defined by temporary series in relation to one or many performance parameters; thus identifying each of the phases from properties of the curve as minimum and maximum values and the inflection point. For the construction of the curve, reliable data about the interest (in) technology can be used.
Regarding previous qualitative works about S curves in technology, some authors like Schilling (2012) explain that such can be applied in technology performance, transmitter density, and electronics of consumption and introduction of discontinued technologies, Burgelman, Christensen and Wheelwright (2003); in relation with product efficiency, technology maturity in magnetic discs and density in millions of bits by square inch. This is just like the S curves in the texts of Erosa and Arroyo (2007) and Tidd and Bessant (2009).
Bibliometrics, as much as scientometry, have had a known and long lasting debate about the significance of citations in production, dissemination and reconstruction of knowledge. Recently, it has been observed that a question still remains about what bibliometrics is really contributing to scientific history regarding its text analysis. A method of algorithmic historiography is implemented, which allows to mathematically model that history and in this manner test the hypothesis about the said contribution (Scharnhorst, Börner, & van den Besselaar, 2012).
The practice of citation analysis has become a fundamental part of the construction of scientific knowledge. In the early invention stage of cite indexation, that was initially oriented to the recovery of information, (Garfield, 1979) proposed the use of databases to reconstruct the history of scientific ideas. The bibliographic information contained in a published article collection and its references make a historic reconstruction through citations. Nonetheless, it must be taken into account that the search for cites represents a specific empirical method. On the other side, idea diffusion can be traced through the terminology and the citations. In the early stages of diffusion, the idea is associated with the document in which they were presented for the first time; the diffusion of that idea can be traced through citations (Zhao, 2003).
A method to evaluate the quality of research contributions between different techniques is the comparison of cites made in the investigation documents. This is used mainly to identify historical trends in research disciplines, identification of base documents, and identification of the citer's characteristics and to evaluate the impact of the investigator of the investigation organization. The number of citations received per document is a multi-variable function. Two of the most important are the quality of the document content and the number of investigators in the discipline oriented by such documents (Kostoff and Martinez; s.d). To conclude, cites can be used to evaluate the quality of scientific work; furthermore, citation or the use of statistics can be employed to measure the obsolescence of a field.
Scientific development usually follows an S curve pattern (Price, 1964). With a new invention, the progress tends to be slow at the beginning, and then through a trial and error process, the field starts to become systemized. In the growth stage, the increase is fast and sustained. Finally, when the technology is mature, an upper limit is reached and development becomes slow again. When the limit of technologies is reached, matured technology begins to decline and it is substituted by a new one that offers users more attractive benefits. In accordance to the above-mentioned, it is possible to orient bibliometric analysis with the objective of understanding future areas of importance for investigation and a corresponding plan development of basic research of a specific theme (Lin-Chu and Yi-yang 2013).
Shu- Jung and colleagues (2013) made an investigation on patents related to LED controllers, with the purpose of establishing R&D strategies. In their study, they accumulate data of patent solicitude with the end of producing a clear tendency graph of technological development.
Nowadays, it is common to find definitions using the terms product life cycle and industrial life cycle; finding the product life cycle as a dominant one, or simply both combined in the product life cycle. Product life cycle is normally used to help in the decision making process or in other fields of administration associated to strategies of supply chain management, inventory control policies, and demand forecast. However, the use of product life cycle does not distinguish between product class, shape or brand.
The market life cycle measures the diffusion of innovations of product life cycle, and the industrial life cycle describes how an industry emerges and develops. In fact, the representation of the industrial life cycle is described as an associated reference to the Programmable Logistic Controller (PLC), and it is named as a view in the evolution of such. This is comparatively similar to what has been identified by Morrison (1984), which refers to time terms in order to assume the most convenient and proper policy options that are currently starting and might define the beginning of a future impact of an industry.
Technology life cycle can generate confusion due to its own nature, or variety of forms it can acquire. These forms can be: machinery, assembles, techniques, processes, software, documentation, or a physical manifestation of a product.
The technology life cycle has been used to measure technological changes in two dimensions (Gao et al. 2011), competitive impact, and process and product integration in the following stages: emergent, growth and maturity. The characteristic of an emergent stage is a new technology with low competitive impact and low product and process integration. In the growth stage, there are stimulated technologies with a high competitive impact that have not been integrated with new products or processes. In the maturity stage, some stimulated technologies become key technologies and are integrated with products and processes and maintain a high competitive impact. As soon as a technology loses its technological impact it becomes a base technology, enters a saturation stage and can be replaced by a new technology; sequence that is interpreted and the technology life cycle.
To establish the technology life cycle concept, as well as, product life cycle, it is necessary to consider the perspective of technological changes in the last century, as mentioned by Stackelberg (2014); which analyzes the impacts of technological change from an organizational perspective and states that it is important to look at how those changes will affect efficiency, quality, and utility of a process, product or emerging technology.
The concept technology life cycle begins by valuing the reported magnitude of technological progression in data bases that could help bibliometric analysis of emerging technologies in technology forecast, whose general purpose is to provide a timely vision in the perspectives of technological change.
Analyzing the past and the present provides information to forecast the future. For the past and present analysis of technological innovation, it is necessary to search in deeper levels, generally from data bases and the technology life cycle.
The technological progression advances slowly at first, then accelerates and inevitably declines, forming an S curve, which can be divided in 4 phases: emerging, growth, mature, declining (Taylor and Taylor, 2012). In the same way Schilling (2012), describes the technology life cycle in the form of improving performance. The author affirms that there is a normal slow improvement at the beginning, then an accelerating improvement, and, at the end, the improvement decreases.
Price (1964), however, shows that the beginning of the linear growth does not evidence senility, or the death of the science, and identifies a variety of possible alternative scenarios, including a model that is supposedly scale believable, meaning that a new logistic curve elevates with renewed exponential growth as a result of some form of radical reorganization. This can also occur with technology, not because it has reached an inflection point in the S curve that represents a phase of senility, or the death of a technology, but other possible alternative scenarios such as: a transition to another S curve with renewed exponential growth as a result of radical reorganizations. (Garfield, 1979).
Since the beginning of nonlinear applications in S curves for parameter analysis in technology performance, experts have wondered if these analyses should be done with the parameters (articles and patents) just as they are generated in technology intelligence studies, or if they should be accumulated in time. However, decades ago, diverse authors had analyzed this situation in parameters related to science, and authors like Price established that "Science is the accumulative activity that establishes our culture, aside everything that has come before", also, "there is an increase of accumulated contributions in the field of science that resembles a stack of bricks". (Price, 1964).
The same author provides empirical data to support his observation that the growth variety in population size or scientific indicators, such as: scientific workers, scientific publications, and money spent on scientific research, amongst others has been exponential. For example, growth has occurred at a constant rate in the long run, which the speed growth is such that science has duplicated every 10 or 15 years since the seventeenth century (Price, 1961). The author goes further, establishing that this growth in science can be modeled through a logistic curve, which makes a prediction that, at some point in the future, the period of exponential growth observed to a given moment is no more than prelude of a linear growth period at a gradually decreasing rate; finally, from a linear growth period to a fast decreasing rate, in a characteristic pattern of a logistic model in which growth is described by an S curve converging to an upper limit or saturation point.
Modis (2007) affirms that it is very important to define "what is the species and what is the niche that is growing into". The author also affirms that "S-curves can also be used qualitatively to obtain rare insights and an intuitive understanding".
The Figure 2 Shows the process of S curve elaboration, starting from patents and article of biotechnology and nanotechnology.

Source: Self Elaborated
In the first phase, as shown in Figure 2, the necessary data was selected to elaborate the S curves. For this, searches were made for scientific publications on the data base ISI Web of Science. A search of patents in Thomson Innovation was performed too. The selected topics were about samples of biotechnology (controlled release materials) and nanotechnology (solid lipid nano). It is fundamental to ensure data accumulation per year. It is only with this accumulated data to do the S curve calculations.
Next, data is presented concerning patents obtained about both technologies, the data is accumulated.
Table 1. Accumulated data from the priority year and publication from technologies of Solid Lipid Nano and Controlled Release.
Solid Lipid Nano |
Solid Lipid Nano Patentes Publication Year |
Controlled Released Materials |
Controlled Released Materials Patentes Publication Year |
||||
Priority Years |
Acumulativo |
Publication Year |
Acumulado |
Priority Years |
Acumulativo |
Publication Year |
Acumulado |
1991 |
1 |
1993 |
1 |
1962 |
1 |
1970 |
3 |
1992 |
1 |
1994 |
2 |
1963 |
1 |
1971 |
7 |
1993 |
1 |
1995 |
3 |
1964 |
1 |
1972 |
9 |
1994 |
3 |
1996 |
13 |
1965 |
2 |
1973 |
12 |
1995 |
4 |
1997 |
23 |
1966 |
3 |
1974 |
14 |
1996 |
4 |
1998 |
33 |
1967 |
3 |
1975 |
19 |
1997 |
5 |
1999 |
47 |
1968 |
6 |
1976 |
30 |
1998 |
9 |
2000 |
67 |
1969 |
8 |
1977 |
42 |
1999 |
12 |
2001 |
84 |
1970 |
14 |
1978 |
51 |
2000 |
13 |
2002 |
114 |
1971 |
20 |
1979 |
67 |
2001 |
15 |
2003 |
150 |
1972 |
22 |
1980 |
87 |
2002 |
18 |
2004 |
188 |
1973 |
27 |
1981 |
107 |
2003 |
22 |
2005 |
244 |
1974 |
32 |
1982 |
123 |
2004 |
29 |
2006 |
312 |
1975 |
37 |
1983 |
147 |
2005 |
39 |
2007 |
381 |
1976 |
47 |
1984 |
172 |
2006 |
47 |
2008 |
488 |
1977 |
70 |
1985 |
206 |
2007 |
57 |
2009 |
615 |
1978 |
78 |
1986 |
251 |
2008 |
80 |
2010 |
780 |
1979 |
89 |
1987 |
309 |
2009 |
96 |
2011 |
1012 |
1980 |
122 |
1988 |
362 |
2010 |
113 |
2012 |
1245 |
1981 |
138 |
1989 |
450 |
2011 |
133 |
2013 |
1412 |
1982 |
155 |
1990 |
521 |
2012 |
147 |
|
|
1983 |
172 |
1991 |
584 |
2013 |
148 |
|
|
1984 |
201 |
1992 |
666 |
|
|
|
|
1985 |
253 |
1993 |
739 |
|
|
|
|
1986 |
305 |
1994 |
826 |
|
|
|
|
1987 |
380 |
1995 |
917 |
|
|
|
|
1988 |
478 |
1996 |
1013 |
|
|
|
|
1989 |
558 |
1997 |
1088 |
|
|
|
|
1990 |
641 |
1998 |
1173 |
|
|
|
|
1991 |
729 |
1999 |
1280 |
|
|
|
|
1992 |
798 |
2000 |
1433 |
|
|
|
|
1993 |
886 |
2001 |
1597 |
|
|
|
|
1994 |
987 |
2002 |
1771 |
|
|
|
|
1995 |
1085 |
2003 |
1990 |
|
|
|
|
1996 |
1189 |
2004 |
2203 |
|
|
|
|
1997 |
1283 |
2005 |
2440 |
|
|
|
|
1998 |
1436 |
2006 |
2663 |
|
|
|
|
1999 |
1601 |
2007 |
2952 |
|
|
|
|
2000 |
1780 |
2008 |
3257 |
|
|
|
|
2001 |
1981 |
2009 |
3579 |
|
|
|
|
2002 |
2201 |
2010 |
3882 |
|
|
|
|
2003 |
2443 |
2011 |
4213 |
|
|
|
|
2004 |
2701 |
2012 |
4551 |
|
|
|
|
2005 |
2935 |
2013 |
4597 |
|
|
|
|
2006 |
3213 |
|
|
|
|
|
|
2007 |
3528 |
|
|
|
|
|
|
2008 |
3838 |
|
|
|
|
|
|
2009 |
4142 |
|
|
|
|
|
|
2010 |
4431 |
|
|
|
|
|
|
2011 |
4731 |
|
|
|
|
|
|
2012 |
4966 |
|
|
Subsequently, the series of data obtained were processed in statistical software, with which non-linear regressions were made to the data of 13 mathematical models:
Three parameters Sigmoidal, four parameters sigmoidal, five parameters sigmoidal, Gompertz three parameters, Gompertz four parameters, three parameters logistic, four parameters logistic, Chapman three parameters, Chapman four parameters, four parameters Weibull, five parameters Weibull, Hill three parameters and 4 Hill four parameters.
The thirteen models used correspond to S curve models, in which the equation categories are from a sigmoidal type, meaning, logistic type equations. Each equation contains parameters, for example, the three parameter sigmoidal model gives values of a, b and X0; where X0 is the inflection point. The four parameter sigmoidal model provides values of a, b and X0 and Y0, where X0 keeps being the inflection point. This behavior is also present in others models such as: Gompertz, logistics, amongst others.
Each of these thirteen models has a characteristic equation, for example, for the three parameter sigmoidal models; its equation is: f= a/(1+exp(-(x-x0)/b)). However, there are small changes that make each model a unique way to approach to the obtained data in patents and articles. For this reason is why the aforementioned models should be applied in sigmaplot to the time series of patents and articles, and then chose the best fit.
With the non-linear regressions, S curves were obtained, where the Y-axis depicted the accumulated performance parameter, in this case patents or articles, and the X-axis stood for time. Then, the different performance parameters: R2, t value, p value and Durbin Watson (DW) were obtained. The best adjusted model was determined with these parameters, with which the inflection point was validated in the curve and determined through the second derivative in the software DERIVE o in any mathematical software that makes this type of calculations.
The best adjustment is obtained through t and P parameters, and only when these parameters are in the adequate values, is possible to accept or validate the value of the inflection point. Now, this leads to obtain various winning models, given that other parameters like the adjusted R2 and Durbin Watson; related to residue auto correlation, help prioritize some models over other ones.
The calculation of the second derivative is not necessary in the models 3 and 4 parameters sigmoidal, and Gompertz 3 and 4 parameters. In the other non-linear regression models, the second derivative does not coincide with the inflection point generated by the sigmaplot software; therefore its validation is necessary.
The software "DERIVE" calculates the second derivative of a function. This is important given that in previous works about S curves have demonstrated that some winning models generate inflection point values different from the same time series or technology data. To avoid this contradiction, a method that validates the inflection point is required, and that method is the calculation of the second derivative; which for this is case was done through the software DERIVE even though it can be done through another software or even by hand, which takes longer.
With the obtained results, the analysis is accomplished.
Searches of data series were made on articles and patents on biotechnology and nanotechnology, obtaining the data with which the non-linear regressions were accomplished.
Next, it is presented by way of example, in table 2; the summary of applied models to a series of data from one of the analyzed technologies. The same procedures are applied to the other series.
Table 2. Results of the application of 13 models from S curves in data patents by publication year in Solid Lipid Nano.
R2 |
Punto de Inflexión |
Valor T |
Valor P |
D.W. |
Modelo |
Validez |
0.9982 |
44,52 |
422.949 |
<0.0001 |
0.6082 |
Sigmoidal 3 parámetros |
SI |
0.9985 |
47,50 |
-28.259 |
0.0073 |
0.8280 |
Sigmoidal 4 parámetros |
SI |
0.9994 |
42,78 |
-102.331 |
<0.0001 |
0.5099 |
Sigmoidal 5 parámetros. |
SI |
0.9976 |
1647,48 |
0.0003 |
0.9998 |
0.5572 |
Logístico 3 parámetros |
NO |
0.9979 |
1541,95 |
21.401 |
0.0385 |
0.6584 |
Logístico 4 parámetros |
NO |
0.9983 |
42,85 |
128.871 |
<0.0001 |
0.7097 |
Weibull 4 parámetros |
SI |
0.9986 |
40,72 |
-30.198 |
0.0044 |
0.8156 |
Weibull 5 parámetros |
SI |
0.9982 |
91,26 |
90.732 |
<0.0001 |
0.7875 |
Gompertz 3 parámetros |
SI |
0.9982 |
103,10 |
-0,8902 |
0.3787 |
0.8269 |
Gompertz 4 parámetros |
NO |
0.9976 |
1653,55 |
0.0003 |
0.9998 |
0.5572 |
Hill 3 parámetros |
NO |
0.9979 |
40.65 |
21.385 |
0.0386 |
0.6584 |
Hill 4 parámetros |
NO |
0.9976 |
32,53 |
92.260 |
<0.0001 |
0.5560 |
Chapman 3 parámetros |
SI |
0.9979 |
40,77 |
20.014 |
0.0522 |
0.6573 |
Chapman 4 parámetros |
NO |
In the case of the patents by publication year, patents by priority year and articles on biotechnology, specifically on controlled released restrictions in the medical field, the following data was obtained respectively: 44, 51 and 58. With this data, non-linear regressions were made to 13 mathematical models, on which 3 were selected because of the obtained results (better adjustment). For each model, the statistical data R2, t value, p value and Durbin Watson were obtained (Table 3).
Table 3. Selected models and Inflection point
|
Patents by publication year 4 parameter Sigmoidal |
Patents by priority year
3 parameter Gompertz |
Articles 3 parameter Chapman |
Inflection point/year |
47.5/2016 |
51.01/2012 |
76.35/2031 |
R2 |
0.9985 |
0,9993 |
0,9978 |
D-W |
0.8280 |
0.2848 |
1.1566 |
In figure 3, it can be observed where the S curves are obtained from: patents by publication year (a), patents by priority year (b) and articles.
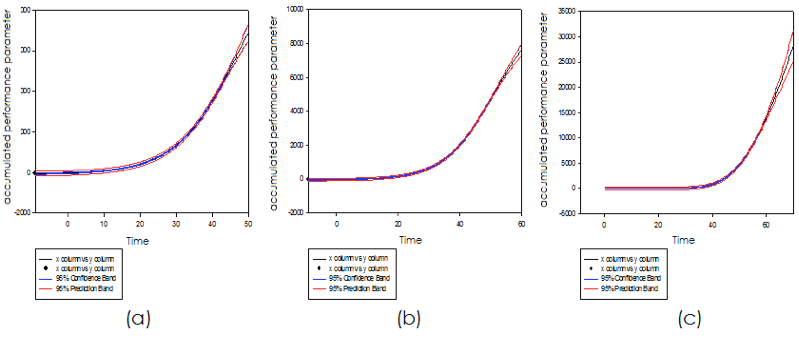
Figure 3. S curves of patents and data from articles on Biotechnology.
The graphs obtained can be correlated with the existent information about the type of technology (emerging technology, edge technology, key technology and base technology) and the decisions that can be made based on the different types (figure 4).
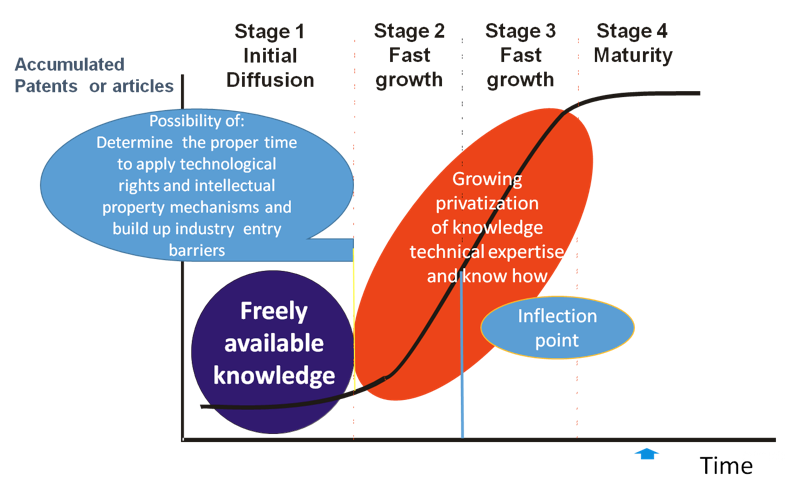
Figure 4. Decisions based on the type of technology
Source: Adapted from Pérez (2000)
The analyzed data in nanotechnology (solid lipid nano) were accumulated data of patents and articles. A series of 23 patents and series of 21 data for articles were obtained. Same as with the accumulated data of biotechnology, non-linear regressions were made to 13 mathematical models, in which 2 were selected because of the obtained results (better adjustment). For each model, the statistical was obtained. (Table 4).
Table 4. Selected models and the Inflection point
|
Patents by publication year 4 parameter Sigmoidal |
Patents by priority year
5 parameter Sigmoidal |
Articles 5 parameter Sigmoidal |
Inflection point/year |
25,3512/2011 |
25,3061/2009 |
21,4/2013 |
R2 |
0,9987 |
0,9983 |
0,9998 |
D-W |
1,6514 |
1.7256 |
1.7999 |
The S curves are obtained from: patents by publication year (a), patents by priority year (b) and articles, as shown on figure 5.
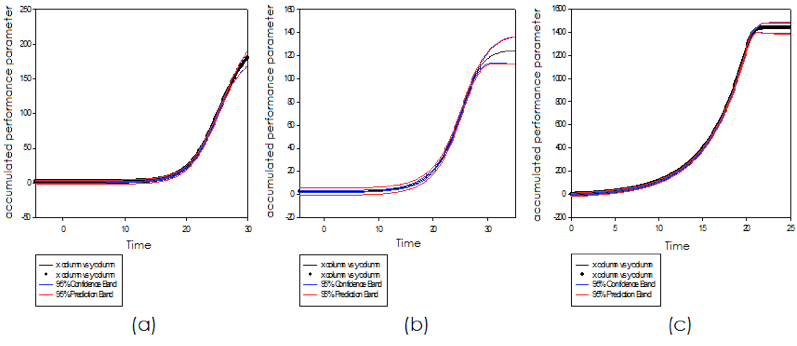
Figure 5. S curves for patents and articles data on Nanotechnology
With the values obtained in the inflection points in the series of articles and patents, decision making can be made with relation to the type of technology identification before and after the inflection point. Before: emerging technology, edge technology and key technology. After: mature technology and base technology.
In the different stages of technology transfer, or in the operations that can be developed through it, such as: transmission, absorption, usage, learning, accumulation, generation and diffusion, among others. There is always an interest concern about knowing the stage of the analyzed technology, especially if the technology is actually emerging or incoming, or if it is mature or declining instead. In the presented cases, analyzed technologies are reaching the inflection point just in 2013 for nanotechnology (Solid lipid nano), or it will be reached in the upcoming years in the case of biotechnology (controlled release materials).
In the case of biotechnology, specifically controlled released materials, the inflection point regarding patents by publication date will be in 2016, for the patents by priority year will be in 2042 and based on the information from the articles, the inflection point will be in 2031.
Regarding series of articles and patents in nanotechnology (solid lipid nano), the inflection point for patents by priority year was in 2012 and based on the articles information, the inflection point will be in 2013.
In the analyzed series, the inflection points for the articles occurred some years after the inflection points were obtained from the patents. This may be because, from the beginning of the article's dynamic publishing, the previous existence of information is required, so that it can only be obtained from the first patents
For the "controlled release materials" series in biotechnology, the article's inflection point has several years of difference from the inflection point of patents. This can be due to the early stages of the technology life cycle where the researchers found a "mine", or high inventory of new knowledge, that is susceptible to being applied in some industrial sectors, and therefore generate a high dynamic scientific production that can be observed in a high slope, with the curve in the growing stage. With this high slope values, the only option for the software is to project the inflection according to the historic information value.
An additional analysis can be made from the inflection point for the determination of the adequate moment to apply technological right mechanisms and intellectual property. Before the inflection point: technological right mechanisms and intellectual properties are performed. After the inflection point: technical experience and knowledge are available and over costs should be considered to protect new dominant designs that could enter the market.
At last, S curves and their inflection point can help reduce uncertainty in monitoring decisions, when technology is emerging before the inflection point, to not over-invest, and when a technology becomes base after the inflection point.
If cites can be used to evaluate the quality of scientific work, citations can also be used to measure the obsolescence of a field, an analysis application can be made on patents and articles through citation analysis of a technology, so that now it can be counted with three performance parameters for decision making.
It can be spoken of a near future, not of S curves but of S surfaces, in a way that involves more than one performance parameter in the analysis. Surfaces can be made with combinations of articles and patents and the analysis of an inflection point that involves the behaviors of two performance parameters.
It is fundamental to review alongside experts to be sure that working with patents and articles corresponds to the technology being studied.
Given the difficulty in the decision making process with just one performance parameter, it is suggested that for the same technology, patents and articles are analyzed simultaneously.
The obtained analysis from the software when the inflection point had not occurred, but projected to the future, in this case inflection points above 2013, are estimates that should be read carefully now that the software does not have the preinstalled limits, threats (legal or political), and enhancers of a technology in its life cycle. Nonetheless, obtaining a future inflection point shows promise to the studied technology producers, as much for the adopters, diffusers, and buyers of the same.
Ávalos, J. E., Bermúdez, J. L., Zartha, J. W., & Ávalos, A. F. (2012). Curvas en S - Análisis de tendencias en dos segmentos de la categoría de galletas. III Congreso Internacional de Gestión Tecnológica e Innovación COGESTEC 2012. Medellín.
Burgelman, R., Christensen, C., Wheelwright, S. (2003). Strategic management of technology and innovation. Fourth edition. McGraw Hill Irwin.
Dosi, G. (1982). Technological paradigms and technological trajectories: A suggested interpretation of determinants and directions of technical change. Research Policy, 2(3).
Erosa, V., Arroyo, P. (2007). Administración de la tecnología. Nueva fuente de creación de valor para las organizaciones. Limusa. ISBN-13: 978-968-18-6981-6. 266p.
Foxon, T., Gross, R., Heptonsall, P., Pearson, P., & Anderson, D. (2007). Energy Technology Innovation: A Systems Perspective. Imperial London College.
Garfield, Eugene (1979). "Is citation analysis a legitimate evaluation tool?". Scientometrics, 1979, 1(4):359-375.
Kostoff, R., & Martinez, W. (s.f.). Science and technology citation analysis: is citation normalization realistic? Recuperado el 4 de 8 de 2013, de http://www.dtic.mil/cgi-bin/GetTRDoc?AD=ADA426271
Kucharavy, D., & De Guio, R. (2007). Application of S-Shaped Curves. TRIZ-Future conference 2007: Current Scientific and Industrial Reality. Frankfurt.
Lidan Gao, Alan L. Porter, Jing Wang, Shu Fang, Xian Zhang, Tingting Ma, Wenping Wang, Lu Huang. (2011) Technology life cycle analysis method based on patent documents.
Ling-Chu, L., & Yi-Yang, L. (s.f.). Bibilometric analysis for discovery of future trends in. Recuperado el 4 de 8 de 2013, de http://www.enid-europe.org/conference/abstract%20pdf/Ling_Chu_abstract.pdf
Margaret Taylor, Andrew Taylor. (2012) The technology life cycle: Conceptualization and managerial implications
Modis, T. (2007). From my perspective. Strengths and weaknesses of S-curves.
Modis, T., Debecker, A. (1992). Chaoslike States Can Be Expected Before and After Logistic Growth. TECHNOLOGICAL FORECASTING AND SOCIAL CHANGE 41, 111-120.
Morrison, James L.; And Others. (1984). Futures Research and the Strategic Planning Process Implications for Higher Education. ASHE-ERIC Higher Education Research Report No. 9.
Nelson, R., & Winter, S. (1977). In search of a useful theory of innovation. Research Policy, 6(1), 36-76.
Ortiz, S.; Pedroza, A. (2006); ¿QUÉ ES LA GESTIÓN DE LA INNOVACIÓN Y LA TECNOLOGÍA (GInnT)?. Journal of Technology Management & Innovation. Vol. 1, No. 2.
Perez, C. (2001). Cambio tecnológico y oportunidades del desarrollo como blanco móvil. . Revista de la Cepal , 75, 115-136.
Perez, C. (2000). el cambio tecnológico y las oportunidades de desarrollo como objetivo móvil. Conferencia de las naciones unidas sobre comercio y desarrollo. Mesa Redonda de Alto Nivel sobre Comercio y Desarrollo: Orientaciones para el siglo XXI. Bangkok, 12 de febrero de 2000.
Price, D.J. de S. (1961) Science since Babylon. New Haven, CT: Yale University Press
Price, D.J. de S. (1964) The science of science. In: The science of science, eds M. Goldsmith and A. Mackay, pp. 195–208. London: Souvenir Press
Scharnhorst, A., Börner, K., & van den Besselaar, P. (2012). Models of Science Dynamics. Springer.
Schilling, M. (2012). Strategic management of technological innovation. New York University: McGraw-Hill Higher Education. 4th edition. 320 p.
Shu-Jung, C., Fang-Pei, S., Kuei-Kuei, L., Ming-Tsung, Y., & Ping-Chun, C. (2013). The Patent Information, Strategic Patent Deployment Thinking, and Technology Strategies of Small and Medium-Sized Enterprises. 2013 Proceedings of PICMET '13: Technology Management for Emerging Technologies.
Stackelberg, P. (2009). Footprints of the Future: Timelines and Exploratory Forecasts in Futures Research. Journal of Futures Studies, 13(4): 13 – 34.
Stackelberg, P. (2014). Technology and the future: Managing change and innovation in the 21st century. Jericho Hill Interactive.
Tidd, J., Bessant, J. (2009). Managing innovation. Integrating technological, market and organizational change. Fourth edition. ISBN: 978-0-470-99810-6.
Zartha J, Avalos A, Urrea S. Hernandez F. (2009). Metodología para la medición de innovaciones tecnológicas aplicada a empresas del sector agroindustrial. Biotecnología en el Sector Agropecuario y Agroindustrial, 7(2), 89-98.
Zartha J, Avalos A, Urrea S. (2010). Curvas en s, aplicación en productos innovadores del sector agroindustrial y químico colombiano. Biotecnología en el Sector Agropecuario y Agroindustrial, 8(2), Colombia 95-103.
Zhao, D. (2003). A COMPARATIVE CITATION ANALYSIS STUDY OF WEB-BASED AND PRINT JOURNAL-BASED SCHOLARLY COMMUNICATION IN THE XML RESEARCH FIELD. Recuperado el 4 de 8 de 2013, de http://diginole.lib.fsu.edu/cgi/viewcontent.cgi?article=5442&context=etd
Samples used and search strings:
For the purpose of this paper we decided to cover the SLN scope with a simplified search string that does not include equivalent and related terms as Xiao Zhou et al (2013) did with a set of 3607 records. Our simplified search string was shared with this author.
1 (TS=("solid lipid nanoparticle*")) AND Document Types=(Article) : 1274
2 (TS= ("solid lipid microparticle*")) AND Document Types= (Article): 50
3 (TS=("drug delivery")) AND Document Types=(Article) 48392
4 (TS=("SLN")) AND Document Types=(Article) 3533
1 OR 2 = 1319; 3+4= 490; 1319 OR 490= 1412
CTB=(Solid ADJ lipid ADJ nanoparticle*) AND DP>=(19900101); 125
CTB=(Drug ADJ delivery) AND CTB=(SLN) AND DP>=(19700101); 6
CTB=(Drug ADJ delivery) AND CTB=(solid ADJ lipid) AND CTB=(nano*) AND DP>=(19900101); 18
CTB=(Solid ADJ lipid ADJ microparticle*) AND DP>=(19900101); 2
CTB=(Solid ADJ lipid ADJ nanoparticle*) AND DP>=(19900101) OR CTB=(Drug ADJ delivery) AND CTB=(solid ADJ lipid) AND CTB=(nano*) AND DP>=(19900101) OR CTB=(Drug ADJ delivery) AND CTB=(SLN) AND DP>=(19700101) OR CTB=(Solid ADJ lipid ADJ microparticle*) AND DP>=(19900101): TOTAL 135 INPADOC Families
(1) Collections:US Grant, GB App, US App, FR App, WO App, DE Util, EP Grant, DE Grant, EP App, DE App, JP App, KR Grant, KR App, Other, JP Util, KR Util , CN Util, JP Grant, CN Grant, CN App,
Topic=(Control* released material*) = 11129 records on all type of documents
Timespan=All Years. Databases=SCI-EXPANDED, SSCI, AandHCI, CPCI-S, CPCI-SSH.
TAB=(control* release*) AND IC=((A61K)) AND DP>=(19700101) with 4597results; in order to simplify the search string we have used "control release" and avoided the term materials because it could of contain too many equivalent terms. Due to that, we limited the results of "control release" to the IPC class A61K on medical compositions. Following the Journal of Controlled Release definition "the controlled release and delivery of drugs and other biologically active agents. The terms "controlled release" and "delivery" are used in their broadest sense to include mechanisms such as diffusion, chemical and enzymatic reactions, dissolution, osmosis, targeting, as well as the utilization and manipulation of biological processes. A broad spectrum of studies dealing with all aspects of controlled release and delivery, including gene delivery, tissue engineering and diagnostic agents, are encouraged. The use of pro-drugs and carriers such as water-soluble polymers, micro and nanoparticles, liposomes and micelles are included in the scope. "The time was also restricted to patent documents published after 1970.
1. Facultad de Ingeniería Agroindustrial, Escuela de ingenierías de la Universidad Pontificia Bolivariana Jhon.zartha@upb.edu.co
2. Universidad Politécnica de Valencia fpalop@gmail.com
3. Facultad de Ingeniería Industrial, Escuela de ingenierías de la Universidad Pontificia Bolivariana Bibiana.arango@upb.edu.co
4. Instituto Tecnológico Metropolitano ITM fvelez@gmail.com
5. Universidad Pontificia Bolivariana avalosp@gmail.com