![]() ISSN 0798 1015
ISSN 0798 1015

![]() ISSN 0798 1015
ISSN 0798 1015
Vol. 40 (Number 11) Year 2019. Page 21
SIMANCA, Fredys 1; CORTES, Jairo 2; CASTRO, Mario 3; PÁEZ, Jaime 4; MONTENEGRO, Carlos 5 y PALACIOS, Jairo J. 6
Received: 04/12/2018 • Approved: 23/03/2019 • Published 08/04/2019
ABSTRACT: Research article “Social and institutional economic variables of greatest influence on the second-generation indicators related to the water resource and its management”, which was financed by CONADI in 2015. This work shows how functions implemented in PHP and MySql for determining the Water Quality Index (WQI) established by the Institute of Hydrology, Meteorology and Environmental Studies (IDEAM) (2011). It starts by the data and measurements collection at different locations in the Bogotá river basin. |
RESUMEN: Artículo de investigación “Variables económicas sociales e institucionales de mayor influencia en los indicadores de segunda generación relacionados con el recurso hídrico y su gestión”, financiado por el CONADI en el año 2015. El trabajo muestra cómo implementar funciones en PHP y MySql para determinar el Índice de calidad del agua – ICA establecido por el Instituto de Hidrología, Meteorología y Estudios Ambientales – Ideam (2011). Comienza con la recolección de datos y mediciones en diferentes lugares de la cuenca del río Bogotá. |

A major concern of all societies is the conservation of natural resources, particularly water. We performed multiple studies to develop software for measuring the human impact on water resources. Water quality has been often studied (Ward et al., 2003). Previous data allowed us to establish water quality assessment structures as presented by (Adriaanse, 1996). Our goals were (1) to establish a monitoring and network design strategy and (2) to collect samples, perform laboratory analyses, and manage data to generate a reliable analysis and corresponding report. There are several methods for establishing water quality indexes (WQI) around the world. The WQI can be calculated using different variables, whose quality and type depend on the polluting pressures to which the different bodies of water are subjected to, as well as the type of water body. In Ecuador, the methodology for calculating the WQI is determined by the National Sanitation Foundation (NSF). The indicators vary along the course of the river and variables are used that allow for the determination of the most affected areas (Quiroz et al., 2017). In Colombia, the IDEAM (Institute of Hydrology, Meteorology and Environmental Studies) conducts research on the climate and water resources; additionally, departments are subdivided where the regional autonomous corporations that allow characterizing and modeling of different environmental sources operate. For example, the Cauca River, also called Icauca, utilizes ten variables for the water index calculation (Cadavid et al., 2010). Studies have been performed in India, primarily on the Gomati river in Lucknow, which is affected by wastewater when the river rises. These studies used the WQI to establish water quality (Goel, Saxena & Sen, 2018). Since 2005, Colombia has used a set of five variables associated with surface currents, including dissolved oxygen, total suspended solids, chemical oxygen demand, electrical conductivity and total pH. Since 2009, the total nitrogen and total phosphorous were added to be measured at the network stations (Ideam, 2011). The following formula, which is used to calculate the WQI, was taken from the WQI-IDEAM methodology sheet:
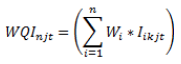
Source: Standardized Methodological Sheet – WQI – IDEAM
where WQInjt is the water quality index with n variables, t is a determined period of time, j is water quality; W is a weight assigned to each quality variable i; l is the calculated value of i, at monitoring station j, in a quarter k. The number of variables and weights is summarized in the following tables:
Table 1
Variables of the model with weighing
Variable |
Unit |
Weighing |
Dissolved oxygen, DO |
% Saturation |
0.2 |
Total suspended solids, TSS. |
mg/l |
0.2 |
Chemical oxygen demand, COD. |
mg/l |
0.2 |
Electrical conductivity, E.C. |
μS/cm |
0.2 |
pH |
Units of pH |
0.2 |
Source: Standardized Methodological Sheet – WQI – IDEAM
-----
Table 2
Variables of the model with variable weighing
Variable |
Unit |
Weighing |
Dissolved oxygen, DO |
% Saturation |
0.17 |
Total suspended solids, TSS. |
mg/l |
0.17 |
Chemical oxygen demand, COD. |
mg/l |
0.17 |
TN/TP |
- |
0.17 |
Electrical conductivity, E.C. |
μS/cm |
0.17 |
pH |
Units of pH |
0.17 |
Source: Standardized Methodological Sheet – WQI – IDEAM
The weights established for the analysis of five variables were considered as a reference for the present study (dissolved oxygen – DO, total suspended solids – TSS, chemical oxygen demand – COD, electrical conductivity - E.C., and pH) and have been used to calculate the WQI via the software development that is part of this investigation. The research question posed is as follows: Which software design defines the appropriate functions for determining the calculation of the WQI?. To support the decontamination of the Bogotá River, we propose designing software that defines the appropriate functions for determining the calculation of the WQI because these types of applications are not currently adapted to Colombia. Based on this question, several studies were performed on the functionalities and differences present in various international models regarding how the measurement indicators are established for determining the water quality in different locations. The objective of this investigation was to design a software product to calculate the WQI proposed by the IDEAM. The software is parametrized such that it can incorporate records of values from different years, perform comparisons and produce the graphic information required for decision making, such as procedures for water treatment to ensure its quality over time.
There are countless investigations worldwide that have worked on the WQI and water pollution indexes. (WPI) (Ramírez et al., 1997). In a study performed by Samboni (Samboni et al., 2007), it was shown how these indexes and the methodologies associated with their application and implementation, have evolved. The importance of these indexes has led to the unification of methodologies for calculation and application, and thus, they have been continuously improved since 1965, with approximately 30 indexes consolidated worldwide (Fernandez et al., 2005). However, in Colombia, due to the lack of data collection on the rivers at different points (from source to mouth), the existing data are not standardized nor systemized, which prevents the control and decontamination of the Colombian tributaries. Therefore, in the present investigation, data were analysed and collected from different areas at different times of the year to be used as software input to calculate the WQI of Colombia. These data are shown in Table 3.
Table 3
Basic input data to the model
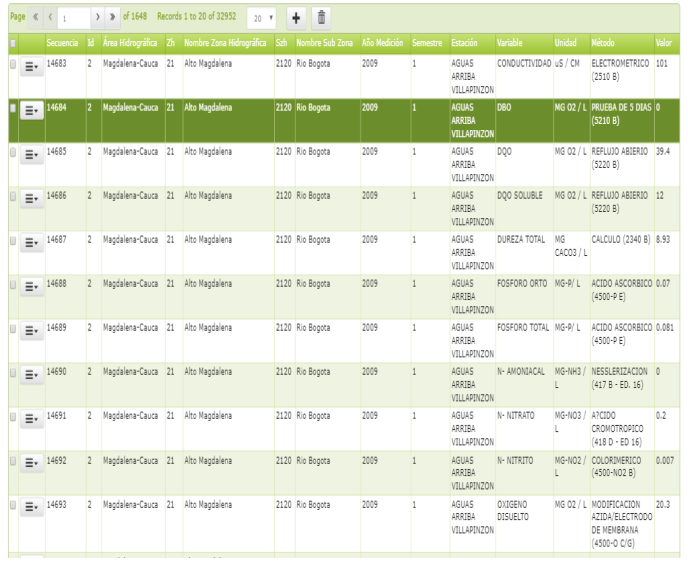
Source: Authors
Once the information and documentation has been reviewed for the calculation of the WQI according to the IDEAM, a user can obtain several results, as shown in Figure 1.
Figure 1
Use cases: query.
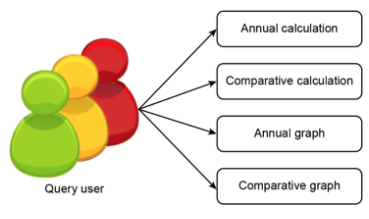
Source: Authors
Figure 2 shows that the administrator can upload information for the analysis, manage users, and generate reports and graphs.
Figure 2
Use cases: Administrator.
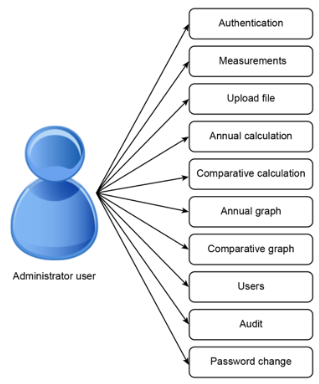
Source: Authors
This function calculates the WQI variables.
The current functions depend on the region, the value of the river flow and the date in which the sample is collected. First, the parameters are uploaded, and then, the parametrized calculations are performed.
function traer_parametros($Zona,$Caudal,$Ano,$Mes)
{
$link=Conectarse();
$Fecha = date('Y-m-d');
$Hora = date('h:i');
$Usuario = $_SESSION['UsuarioLogin'];
$Accion = "Consulta Zona = ".$Zona." caudal = ".$Caudal." del año".$Ano." Del semestre: ".$Mes;
grabarEvento($Fecha, $Hora, $Usuario, $Accion);
$respuesta = new xajaxResponse('iso-8859-1');
$texto="";
$texto.="<br><table width=\"900\" border=\"1\" align=\"center\">
<tr align = center>
<th colspan=6 class=\"tdbuena\">Calculo del ICA, Caudal: $Caudal, Año: $Ano, Periodo: $Mes</th>
</tr>
<tr>
<th>Parámetro</th>
<th>Unidades</th>
<th>Resultado</th>
<th>W</th>
<th>I</th>
<th>W*I</th>
</tr>";
//Field Conductivity
Expressed in the following function are the field conductivity values
function Conductividad($Zona,$Caudal,$Ano,$Mes){
$link=Conectarse();
$waux=0;
$result=mysql_query("SELECT * from ucc_tbmediciones WHERE NombreSubZona='$Zona' AND
Estacion='$Caudal' AND AnoMedicion='$Ano' AND SemestreMedicion='$Mes' AND
Variable='CONDUCTIVIDAD DE CAMPO'",$link);
$fila=mysql_fetch_array($result);
if ($fila[13]>0){
if ($aux > 0 ){
$aux = round((1-pow(10,(-3.26+1.34*(log10($fila[13]))))),2);
}
else {
$aux=0;
}
if ($aux>0) {
$waux= $aux*0.2;
}
else {
$waux=0;
}
}
else {
$waux = 0;
}
return $waux;
}
//Calculation of Dissolved Oxygen and Water Temperature in accordance to the following expression:
Source: Standardized Methodological Sheet – WQI – IDEAM
where Ox is the dissolved oxygen and Cp is the oxygen equilibrium concentration.
The function of the oxygen calculation depends of the region, flow value and the sample date.
function CalculoOxigeno($Zona,$Caudal,$Ano,$Mes){
$link=Conectarse();
$result=mysql_query("SELECT * from ucc_tbmediciones WHERE NombreSubZona='$Zona'
AND Estacion='$Caudal' AND AnoMedicion='$Ano' AND SemestreMedicion='$Mes' AND
Variable='OXIGENO DISUELTO'",$link);
$fila=mysql_fetch_array($result);
$od = $fila[13];
if ($fila[13]>0){
$result1=mysql_query("SELECT * from ucc_tbmediciones WHERE NombreSubZona='$Zona' AND
Estacion='$Caudal' AND AnoMedicion='$Ano' AND SemestreMedicion='$Mes' AND
Variable='TEMPERATURA AGUA'",$link);
$fila1=mysql_fetch_array($result1);
$temp = $fila1[13];
$psod = ($od*100) / (-0.6537153-0.0104799*$temp+6.918079*$od+0.2075711*$temp*$od - 0.0129793 * $od * $od);
}
else {
$psod = 0;
}
if($psod<100)
$iod = (1-(1-0.01)) * $psod;
else
$iod = ((1-0.01)*$psod)-1;
$waux = $iod * 0.2;
return $waux;
}
//pH calculation
The following function calculates the parameter associated with the WQI and pH, depending on the region, flow value and the sample date.
function CalculoPh($Zona,$Caudal,$Ano,$Mes){
$link=Conectarse();
$result=mysql_query("SELECT * from ucc_tbmediciones WHERE NombreSubZona='$Zona' AND
Estacion='$Caudal' AND AnoMedicion='$Ano' AND SemestreMedicion='$Mes' AND
Variable='PH'",$link);
$fila=mysql_fetch_array($result);
$euler = 2.71828182;
if ($fila[13] > 0){
if ($fila[13]>11)
$aux = 0.1;
else if ($fila[13]>8)
$aux = 1 * pow ($euler,$fila[13]-8-0.5187742);
else if ($fila[13]>7)
$aux = 1;
else if ($fila[13]>4)
$aux = 0.02628419 * pow ($euler, $fila[13]*0.520025);
else
$aux = 0.1;
}
else {
$aux=0;
}
if ($aux>0) {
$waux= $aux*0.2;
}
else {
$waux=0;
}
return $waux;
}
The following function calculates the total suspended solids, depending on the region, flow and sample date.
function SolidosSuspendidos($Zona,$Caudal,$Ano,$Mes){ $link=Conectarse(); $result=mysql_query("SELECT * from ucc_tbmediciones WHERE NombreSubZona='$Zona' AND Estacion='$Caudal' AND AnoMedicion='$Ano' AND SemestreMedicion='$Mes' AND Variable='SOLIDOS SUSPENDIDOS'",$link);
$fila=mysql_fetch_array($result);
$tempo = $fila[13];
if ($fila[13]>0){
if ($tempo > 320)
$aux = 0;
else
if ($tempo > 4.5)
$aux = 1-(-0.02+0.003*$tempo);
else
$aux = 1;
}
else {
$aux=0;
}
if ($aux>0) {
$waux= $aux*0.2;
}
else {
$waux=0;
}
return $waux;
}
There are many different available software programs to calculate the WQI, but all process data similarly (Sarkar & Abbasi, 2006). These products analyze data collected at different locations of the river basins at different times. Based on data collection, government departments establish their water quality indexes depending on the water pollution and toxicity levels. The QUALIDEX Software (Sarkar & Abbasi, 2006) was designed in India in Visual C++ and uses Microsoft Access as the database. QUALIDEX features modules of different water quality indexes, as well as an entire comparison process of these indexes for assessment.
Likewise, several countries use software products similar to QUALIDEX to control the pollution levels of their water systems. In addition, China has performed studies for assessing water quality using algorithmic software based on machine learning (Wang et al, 2017). This software product is based on the WQI, remote sensors and special indexes, shows comparative data and generates WQI estimations. This software is interesting but difficult to implement in countries with no appropriate technology and does not consider variables that are used in the WQI measurement model, such as in the Bogotá river basin. In Colombia, there are no similar software products, although there are proposals for expert systems for the reutilization of treated wastewater (Escobar et al, 2016) based on logic to support decision-making, with a focus on the domestic level. Therefore, this investigation presents a model that allows the generation of several relations that make the software more accessible to previously authorized users.
See Table 4, taken from the database administrator.
Table 4
Relation parameters and tables associated with the database
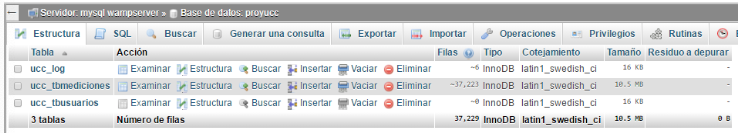
In the analysis and queries performed, products developed to perform data analysis and decision making were not common. Software development was the result of an investigation with support from the IDEAM regarding the data used as software application results.
The software development to calculate WQI provided results that allowed a greater opportunity for the analysis and appropriate decision-making regarding the pollution and water quality levels in different regions of Colombia. In the initial screen (see Graph 1), the historical data from several locations in the river basins are uploaded, and the river to be analyzed, the selection of the flow and the date performs.
Graph 1
Analysis, initial menu.
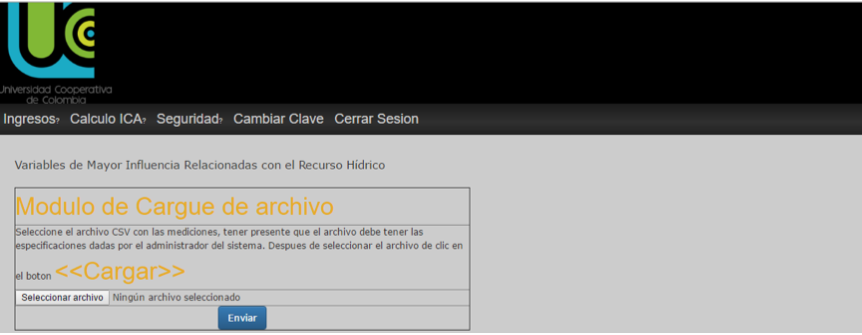
When the selection of the river, the date, and the flow come over, the software receives the data required to be analyzed (see Graph 2).
Graph 2
River’s historical files upload.
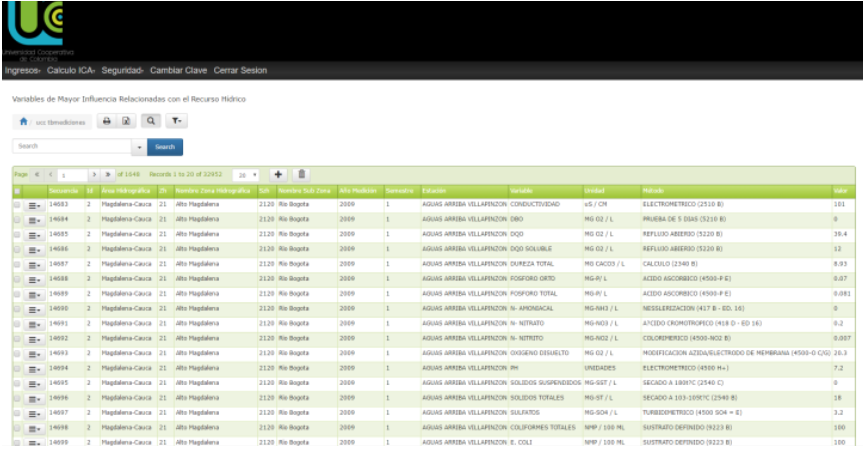
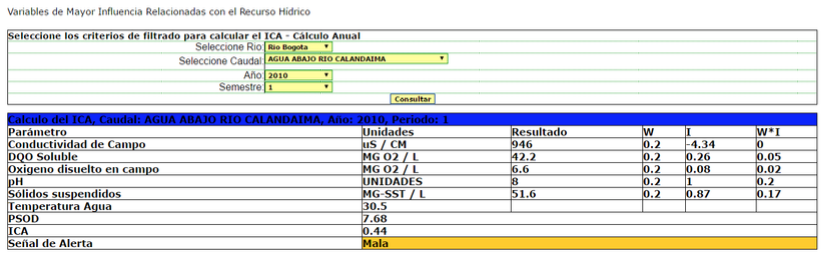
If the upload is performed correctly, the following screen shows the data regarding the variables of major influence related to the water resource.
See Graph 3.
Graph 3
Query Result
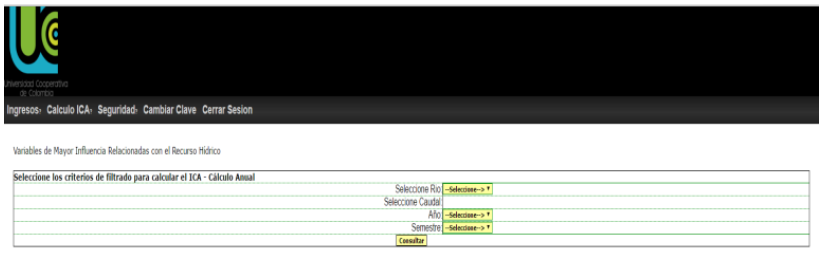
With the uploaded information, graphs can be generated by filtering the information by river, flow and semester in which the samples for the analysis were collected.
See Graphs 4 and 5.
Graph 4
Filtering criteria of the information to consult.
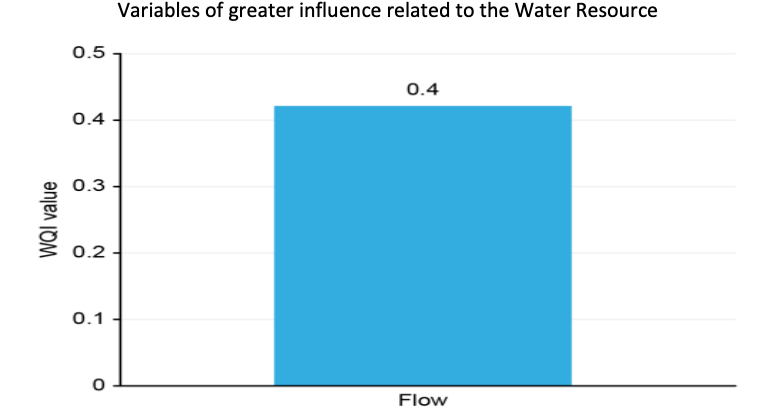
Graph 5
Result of the graphical query. Additionally, analyses can be
performed by comparing year and semester (Graph 6)
WQI calculation – Flow: DOWNSTREAM WATERS OF CHIA – Year: 2015 - Period: 1
-----
Graph 6
Query by year and semester
Once the parameters have been loaded, a graph is generated. WQI calculation, Flow: DOWNSTREAM WATERS OF CHIA, Initial Year: 2015 Final Year: 2016 Period: 1
Graph 7
Result of the consultation by comparative years and semester
Variables of greater influence related to the Water Resource
The calculation of the parameters associated with the WQI can be summarized in Graph 8.
Graph 8
Summary of parameters for the WQI calculation.
The parameters that were used to calculate the WQI included:
The temperature is within the measurements in the database, and the PSOD is calculated when oxygen is determined.
$psod = ($od*100) / (-0.6537153-0.0104799*$temp+6.918079*$od+0.2075711*$temp*$od - 0.0129793 * $od *
The software allows the generation of several types of graphs to support information for the WQI analysis. Several of these graphs are shown below. For the graph by semester, see Graph 9.
WQI calculation – Flow: DOWNSTREAM WATERS OF CALANDAIMA RIVER – Year :2008 – Period: 2
Graph 9
Graph by semester
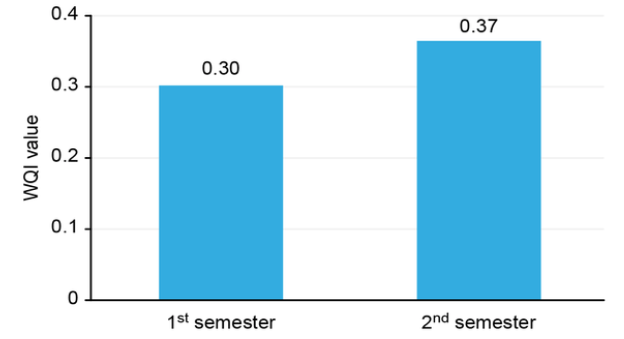
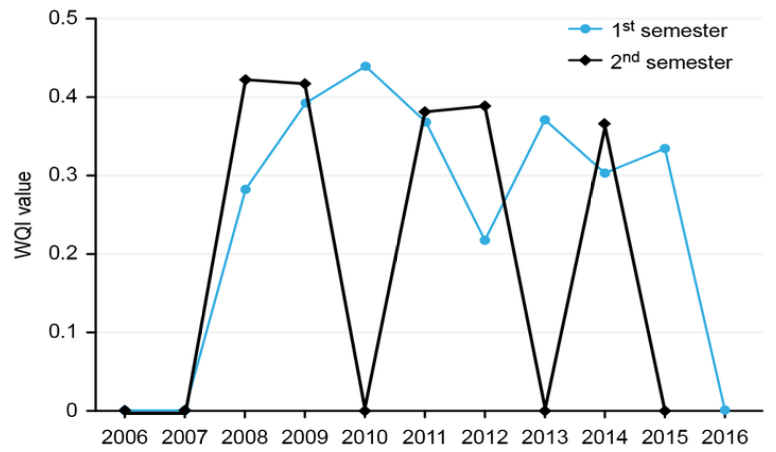
Likewise, several semesters can be compared, which generates the Semester Comparative Graph; see Graph 10.
WQI Calculation, Flow: DOWNSTREAM WATERS OF CALANDAIMA RIVER, Initial Year: 2006 Final Year: 2016 Period: 1
Graph 10
Comparative graph by semester
Variables of greater influence related to the Water Resource
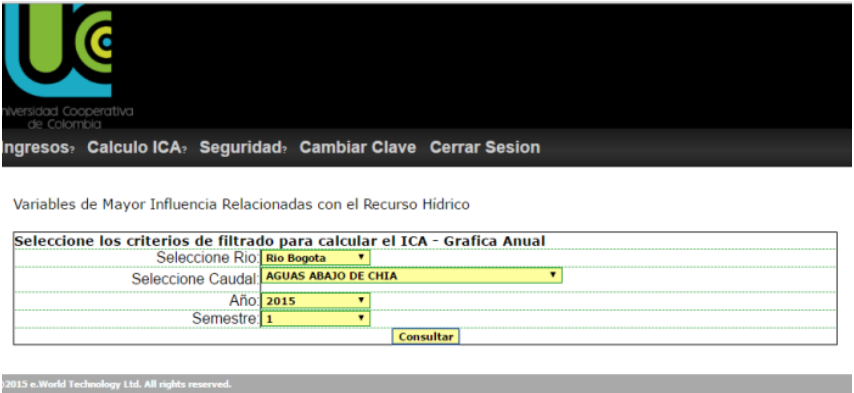
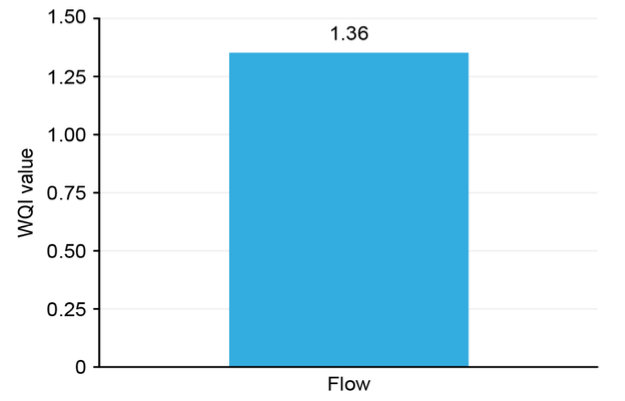
To consolidate the data, they can be grouped by year, which generates the annual graph; see Graph 11.
WQI Calculation, Flow: DOWNSTREAM WATERS OF CALANDAIMA RIVER, Year: 2014
Graph 11
Annual graph of the WQI calculation
Variables of greater influence related to the Water Resource
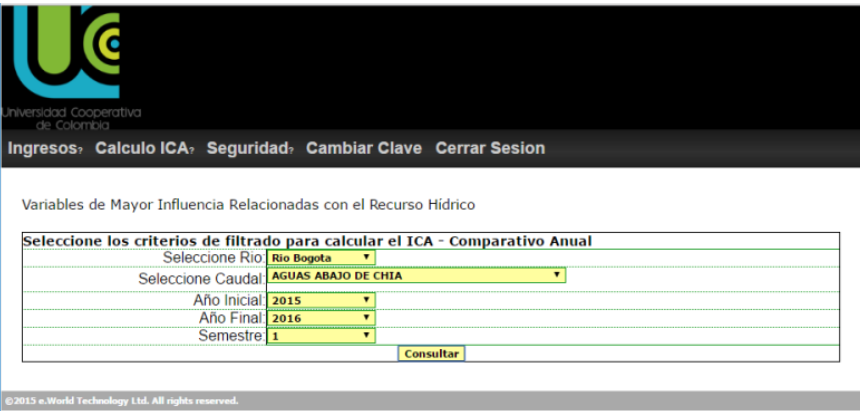
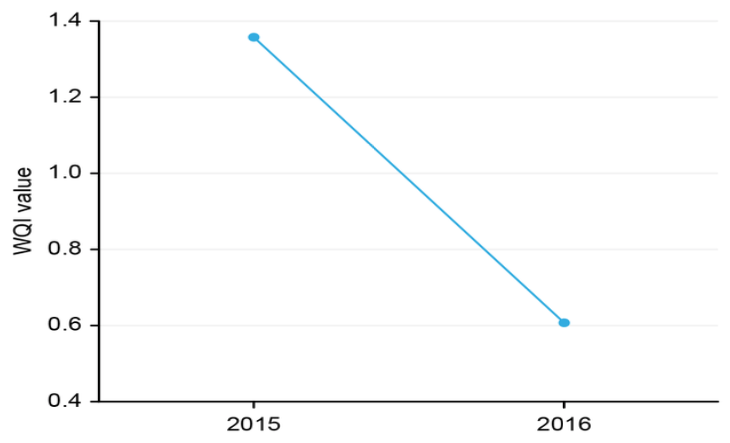
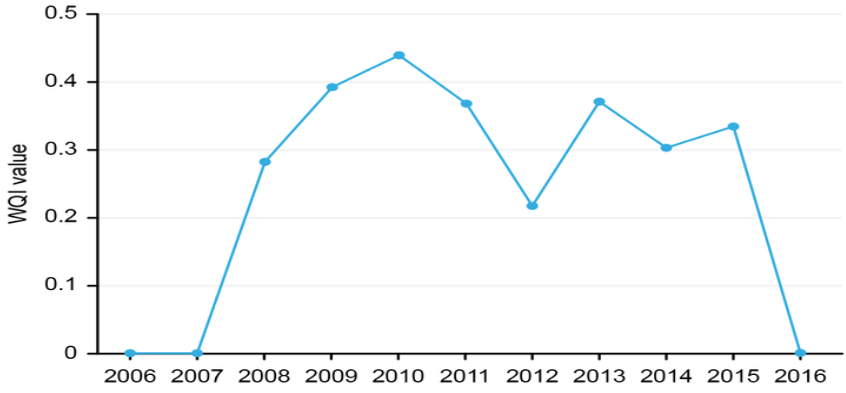
Annual comparative graph, see Graph 12
WQI Calculation, Flow: DOWNSTREAM WATERS OF CALANDAIMA RIVER, Initial Year: 2006 Final Year: 2016
Graph 12
Annual comparative graph of the WQI calculation
Variables of greater influence related to the Water Resource
The software was developed as a response to the need for an analysis of the quality of water resources not only in Colombia but also worldwide. Although there are remote and real time data-reporting tools, not all institutions have the required resources for their operation.
This software is reproducible with other indicators that are related to the water resource quality, as well as to environmental, social and/or economic variables that must be analyzed.
Adriaanse, M. (1996). Tailor-Made Guidelines: A Contradiction in Terms. In Proceedings of Monitoring Tailormade II, An International Workshop on Information Strategies in Water Management, Published by Riza, Institute for Inland Water Management and waste water treatment, Lelystad, the Netherlands, pages 391-399.
Cadavid, J., Echeverri & J., Gómez, A. (2010). Modelación índices de calidad de agua. Revista Gestión y Ambiente Vol. 13 Nro 2. Colombia – Medellín, ISSN 0124.177x pp 7-24.
Escobar, M. C., Tovar, L. F. & Romero J. (2016). Diseño de un Sistema Experto para Reutilización de Aguas Residuales tratadas. Ciencia e Ingeniería Neogranadina. Vol 26-2 pp. 21-34, DOI: http://dx.doi.org/10.18359/rcin.1827
Fernandez, N. & Solano, F. (2005), Índices de Calidad y de contaminación del Agua., Universidad de Pamplona.
Goel, P., Saxena, A., Sen, D. & Verma, D. (2018). Impact of rapid urbanization on water quality index in groundwater fed Gomti River, Lucknow, India. Research Communications, current science, vol 114, No. 3. Pp 650-654.
Instituto de Hidrología, Meteorología y Estudios Ambientales – IDEAM. (2011). Hoja metodológica del indicador Índice de calidad del agua (Versión 1,00). Sistema de Indicadores Ambientales de Colombia - Indicadores de Calidad del agua superficial. 10 p.
Quiroz, L., Izquierdo, E. & Menéndez, C. (2017). Aplicación del Índice de calidad de agua en el río Portoviejo, Ecuador. Revista Ingeniería Hidráulica y Ambiental, Vol 38, No. 3 pp-41-51
Ramírez, A., Restrepo R. & Viña G., (1997). Cuatro índices de contaminación para caracterización de aguas continentales. Formulaciones y aplicación. Scielo. Recuperado de http://www.scielo.org.co/scielo.php?script=sci_arttext&pid=S0122-53831997000100009
Samboni, Ruiz, N E; Carvajal Escobar, & Escobar, J C; (2007). Revisión de parámetros fisicoquímicos Como indicadores de calidad y contaminación del agua. Ingeniería e Investigación,27() 172-181. Recuperado de http://www.redalyc.org/articulo.oa?id=64327320
Sarkar, C. & Abbasi, S: A. (2006). QUALIDEX – A new Software for Generating Water Quality Índice. Environment Monitoring and Assessment. pp 119:201-231. Springer, DOI:10.1007/s10661-005-9023-6.
Wang, X., Zhang, F., & Ding, J. (2017). Evaluation of water quality based on a machine learning algorithm and water quality index for the Ebinur Lake Watershed, China. Scientific Reports. Recuperated http://www.nature.com/scientificreports.
Ward, R., Timmerman, J., Peters C. & Adriaanse, M. (2003). In search of a common water quality monitoring framework and terminoligy. En: Proceedings of water tailor made monitoring IV. www.Mtm-conference.nl/
1. Faculty of Engineering. Cooperative University of Colombia. Teacher (informatics). fredys.simanca@campusucc.edu.co
2. Faculty of Engineering. Cooperative University of Colombia. Teacher (informatics).
3. Faculty of Engineering. Cooperative University of Colombia. Teacher (informatics).
4. Faculty of Engineering. Cooperative University of Colombia. Teacher (informatics).
5. Faculty of Engineering. Cooperative University of Colombia. Teacher (informatics).
6. Faculty of Social Sciences. University College of Cundinamarca. Teacher (social planning). jjpalacios@unicolmayor.edu.co