![]() ISSN 0798 1015
ISSN 0798 1015

![]() ISSN 0798 1015
ISSN 0798 1015
Vol. 40 (Number 13) Year 2019. Page 11
RODRÍGUEZ, Darío 1; MARTÍNEZ-GÓMEZ, Javier 2; GUERRÓN, Gonzalo 3; RIOFRIO, Augusto 4 & NARVÁEZ C., Ricardo A. 5
Received: 16/12/2018 • Approved: 31/03/2019 • Published 22/04/2019
ABSTRACT: This research deals with the possible effects on electrical power quality in Ecuadorian households due to induction stoves penetration. For this purpose, several voltage and harmonic current measurements have carried out in a prototype house in Quito D.M, considering different models of induction cookers. These home appliances are currently sold within the framework of the Energy Efficiency Program (EPC) for Cooking in Ecuador. Finally, the achieving results demonstrate that induction stoves are not a significant harmonic source; therefore, they do not generate a considerable increment of harmonic distortion levels in the residential sector. |
RESUMEN: Esta investigación aborda los posibles efectos sobre la calidad de la energía eléctrica en los hogares ecuatorianos debido a la penetración de las cocinas de inducción. Para este propósito, varias mediciones de tensión y corriente armónica se llevaron a cabo en una casa prototipo en Quito D.M., considerando diferentes modelos de cocinas de inducción. Estos electrodomésticos se venden actualmente en el marco del Programa de Eficiencia Energética para la Cocción (PEC) en Ecuador. Finalmente, los resultados obtenidos demuestran que las cocinas de inducción no son una fuente armónica significativa; por lo tanto, no generan un incremento considerable de los niveles de distorsión armónica en el sector residencial. |

A sustained increase in the use of non-linear load devices from residential users has conducted to enhance attention on policies regarding voltage and current waveform distortions in distribution systems (Suárez et al. 2005). Electricity supply, but above all electrical power quality, must fulfill certain standards to ensure customer satisfaction. In this sense, the most important electrical parameters that these standards request to fulfill are: i) frequency, ii) voltage levels, iii) voltage fluctuations (flicker), iv) harmonics and higher frequency components, v) voltage and current unbalance, vi) power factor, vii) gaps and surges, and viii) active and reactive power (Kit et al. 2012).
Power quality levels are ruled by international organizations, such as the Institute of Electrical and Electronic Engineers (IEEE), International Electrotechnical Commission (IEC), among others. Many of these standards are accepted or reformulated by each country or region before applying them (Kit et al. 2012). In the specific case of Ecuador, the Electricity Regulation and Control Agency (ARCONEL) is in charge of issuing power quality regulations for the electricity sector (Martinez et al. 2017; Martínez-Gomez et al. 2017).
Related to power quality, many current home appliances are based on power electronics, which generate harmonic currents over distribution and transmission networks, affecting some reliability indicators of electric utilities, for example, the Customer Average Interruption Duration Index (CAIDI), System Average Interruption Duration Index (SAIDI), and System Average Interruption Frequency Index (SAIFI). Otherwise, this distortion can cause undesirable effects in other equipment installed in the same home, such as computers, protection devices, capacitor banks, motors, etc. Besides that, heating issues in cables and transformers of distribution networks could be arisen as well (Wagnerl. 1993).
The Energy Efficiency Program for Cooking by Induction and Water Heating Using Electricity in Replacement of Liquefied Petroleum Gas (LPG) in the Residential Sector (EPC) is a pioneer project for Ecuadorian government, which looks for replacing about three million LPG cookers by induction stoves, whose energy source is based on electricity (Villacis et al. 2015).
Prior to EPC launch, many power quality and electrical studies were carried out to quantify the benefits of induction stoves implementation (Martínez-Gómez et al., 2016). As a result, it was identified that 92% of LPG is consumed in the residential sector, and 80% of which it is imported, generating foreign currency outflow. Additionally, Ecuadorian government has to assume an important cost due to LPG subsidy for end residential users (Goldemberg et al. 2018). This situation has caused dependence on an imported fossil fuel (LPG), which affects the Ecuador’s trade balance and avoids using this money in relevant projects for national development. Under this context, Ecuador is one of Latin American countries with high level of subsidies destined to fuels. According to the national budget in 2014, $ 3931 million were destined to fossil fuels, of which $ 680 million were invested in LPG importation (Espinoza et al. 2018). In fact, a 15kg LPG gas bottle costs USD $ 1.60, while this price ranges among USD $ 17 and 23 in nearby countries (Martínez-Gómez, 2017). Therefore, if Ecuadorian authorities decide to eliminate LPG subsidy, adjust rate deficit, and finance the first 100 [kWh] of induction stoves, Ecuador would save USD $ 260.7 million per year, according to 2012 consumption information. Additionally, this saving would increase up to USD $ 906.5 million per year if the computation takes into account that 93.53% of electricity generation comes from hydroelectric plants (Kastillo et al., 2017).
Otherwise, EPC program has spent around USD$ 420 million in building new distribution networks as well as reinforcing the current networks due to the relative high power load of induction stoves. To illustrate it, Riofrio et al. (2015) determined that the optimal rated power for the induction stoves of the EPC program should be 4 kW. In addition, electricity supply for induction stoves has to be at 220 V to minimize current values over household circuits and other home appliances (Riofrio, 2015).
The main objective of this research is to analyze the power quality in a prototype house in the city of Quito – Ecuador. For this purpose, the effects of induction stoves penetration in the residential sector are quantified. In this regard, several analyses have been carried out in accordance with EN 50160 (2011) and IEC 61000 - 4 – 30 (2001) standards. The achieving results are based on voltage and harmonic current analyses for four different models of induction stoves which are currently commercialized in Ecuador within the EPC program.
In this section, the methodology applied for determining the main features of prototype home is explained. Furthermore, principal technical characteristics of the chosen induction stoves for the study are detailed. In the same way, the process followed to measure electrical parameters as well as the equipment and standards used for this purpose are described.
In order to evaluate the impact of induction stoves, a prototype house was chosen in the city of Quito. It has to accommodate an average family composed by 4 people. Also, this house should be equipped at least with the equipment described in table 1, which represent the average home appliances in Ecuadorian homes. Indeed, table 1 specifies the quantity, nominal power and estimated monthly consumption per household appliance. In addition, compact fluorescent lamps are considered because the government has widely promoted their use in Ecuador (Goldemberg et al. 2018).
Table 1
Rated power and average monthly consumption of the prototype home loads
N° |
HOUSEHOLD APPLIANCE |
QUANTITY |
RATED POWER |
AVERAGE CONSUMPTION |
1 |
Flat screen TV |
3 |
86 |
7 |
2 |
Audio system |
1 |
150 |
5 |
3 |
Computers |
3 |
65 |
9 |
4 |
Compact fluorescent lamps |
10 |
26 |
27 |
5 |
Incandescent light bulbs |
1 |
100 |
8 |
6 |
Washing machine |
1 |
400 |
4 |
7 |
Electric shower |
1 |
3300 |
47 |
8 |
Microwave oven |
1 |
1200 |
6 |
9 |
Refrigerator |
1 |
575 |
75 |
10 |
Others |
5 |
1500 |
10 |
TOTAL |
198 |
Four different models of induction stoves, sold as a part of EPC program, were chosen to carry out this research. The main technical characteristics of the tested induction stoves, according to the number of induction hobs, electric oven, rated voltage, and maximum nominal power are shown in table 2. It should be highlighted that the rated power for induction stove N.1 includes the power of cooktop plus electric resistance oven. Additionally, all of these stoves are currently sold in Ecuador throughout different distribution channels.
Table 2
Technical features of tested induction stoves considering the number
of hobs, electric oven, rated voltage, and maximum nominal.
No. |
Number of hobs |
Electric oven availability |
Rated voltage (V) |
Maximum nominal voltage (W) |
1 |
4 |
yes |
220 |
7200 |
2 |
4 |
No |
220 |
3500 |
3 |
4 |
No |
220 |
4000 |
4 |
4 |
No |
220 |
4000 |
Power quality measurements inside the prototype home were made at the magneto-thermal switch box. At the moment, there is not a specific local regulation for energy quality and harmonic rates in end users’ homes. However, there are international regulations which standardize the power quality that utility companies have to offer to their end customers.
After connecting the measurement equipment in the above detailed point, the next process was to record the follow measurements:
1- Power quality without incorporating any induction cooker. The analysis period is 7 days, with measurements every 10 minutes, in accordance with the recommendations by EN 50160 (2011). Also, this information allows recreating the weekly load profile for the prototype home.
2- Power quality of the prototype house is re-measured after connecting one by one all the chosen induction cookers. For each stove, two evaluations are carried out. The first one is during cooking process (operation), while the second measures power consumption at stand-by mode. Electrical parameters are measured during 10 minutes for each power level of the induction stoves, nine in total, so 90 minutes are spent in this test; besides, the sampling frequency is 1 second. Contrary, the second test measures power quality for 22 hours with a resolution of 1 second.
In both cases, the follow electrical parameters were measured: i) voltage and current, ii) amplitude and phase of harmonics up 50th order for voltage and current, iii) total harmonic distortion (THD) of voltage and current. These evaluation indices are widely known and their definition can be found in (Kit et al. 2012).
Energy quality measurements were performed using a three-phase power quality and energy analyzer, model 435 series II by Fluke. This analyzer counts on current probes, model Fluke i200 AC, with a selectable current range from0 to20A or 0 to200A, in order to improve measurement accuracy. The measurement procedure of the equipment was carried out taking into account the IEC 61000 - 4 - 30 (2012) standard, which is explained below.
For the development of this research, two international standards (IEC 61000, 2012; EN 50160, 2011) and one national (CONELEC 004/01, 2001) regarding energy quality were considered. These standards set harmonic distortion limits for both voltage and current in low voltage electrical systems.
It establishes limit values for the emission of harmonic currents of electrical equipment which is fed in high voltage (AT), medium voltage (MV), and low voltage (LV) systems. Low voltage systems operate with rated voltage less than 1 [kV], and their limits are considered in this paper. More information about this standard can be found in (IEC 61000, 2012; EN 50160, 2011).
In addition, for the 7-day power quality analysis, the European standard EN 50160 (2011) was used. This standard determines quality requirements for electricity supply in public distribution networks. In the same way, it describes voltage and current levels used by European utility companies in distribution networks and specifies. Harmonic voltage limits for MV and LV systems. In this regulation, systems with voltage up to 35 kV are considered, and voltage harmonic distortion limits are expressed as a percentage of the fundamental supply voltage. More information about this standard can be found in EN 50160 (2011).
Finally, the regulation issued by the ARCONEL stipulates power quality levels over Ecuadorian distribution networks as well as their evaluation methods. As regards harmonic distortion limits, this regulation states that they will be expressed in percentage according to the relationship between the voltage at measuring point and the rated voltage of the system. More information about this regulation can be found in (CONELEC 004/01, 2001).
In this section, we present the measurement results of 50th order harmonics of voltage and current, in percentage of voltage and nominal current, respectively.
In relation to voltage values and RMS current values, which were obtained from the electricity supply circuit of prototype home, they have these features: two-phase electric system with line to neutral voltage equals to 127 [V] and 220 [V] for line to line voltage.
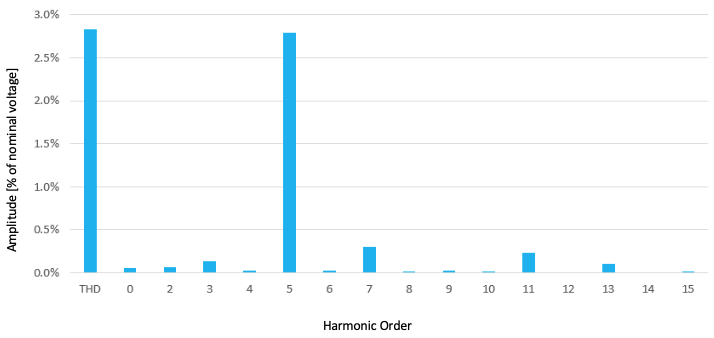
Values obtained for voltage harmonics and the total harmonic distortion (THD) in the prototype residence, for the first case of not taking into account any induction cooker (only the loads specified in table 1), are detailed in the spectrogram of figure 1. The amplitude of the measured harmonics is shown up to 15th order harmonic since the rest have values close to zero. It is also noted that THD equals to 2.83% for the 5th order harmonic, and the remaining harmonic orders have amplitudes lower than 0.35%, including the 3rd order harmonic. Thus, it is confirmed that voltage harmonic in the prototype home, without induction stoves penetration, accomplish the limits established by standards IEC 61000-3-6, EN 50160, and the CONELEC 004/01-Power quality regulation.
Figure 1
Voltage harmonic measurements of prototype residence
without induction stove until 15th order harmonic
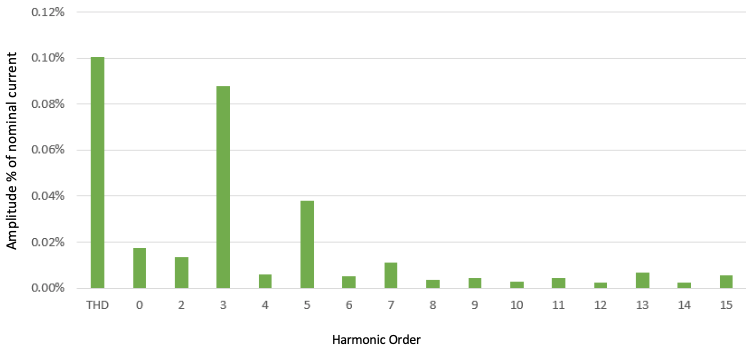
Current harmonics and the current THD in the prototype residence, with the loads specified and without including any induction cookers, are detailed in the spectrogram of figure 2. It shows that the current THD is equal to 0.1%. Besides, 3rd and 5th order are most considerable with values equal to 0.09% and 0.04%, respectively. Therefore, current harmonic levels in this home before PEC inclusion fulfill the limits established in the standards IEC 61000-3-6, EN 50160, and the CONELEC 004/01.
Figure 2
Current harmonic measurements of prototype residence without induction stove until 15th order harmonic
In this subsection, induction stove effects over voltage and current harmonics are presented. The achieving results are focused on the stand-by mode of these home appliances. In simply words, an induction stove is plug in to the network, but it is not being used in a cooking process.
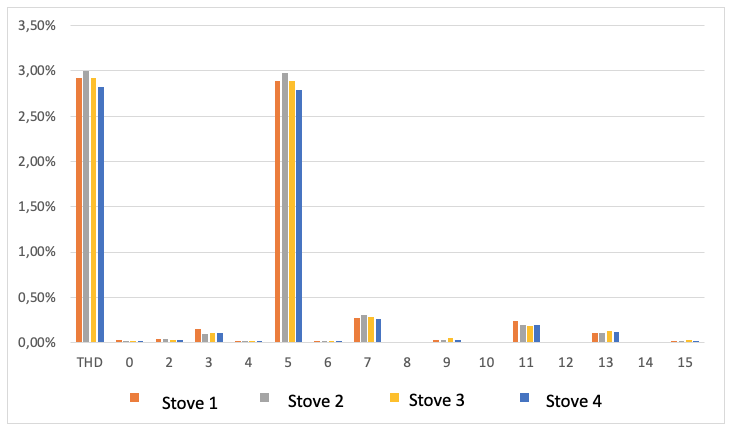
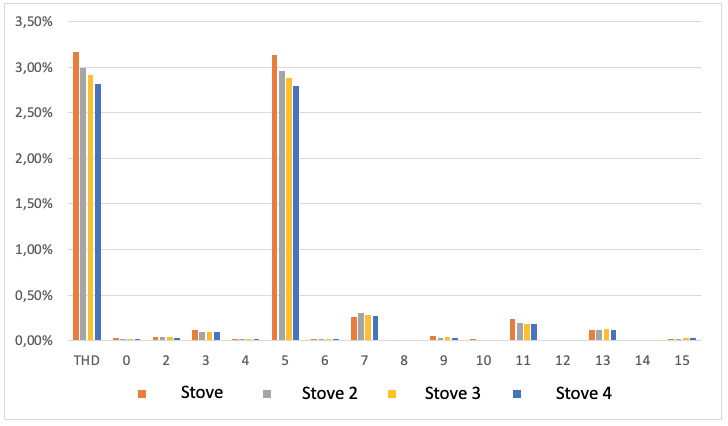
The results of the voltage harmonics and the voltage THD for the four tested induction cookers in standby mode until 15th order harmonic are presented in figure 3. Voltage THD results are 2.92%, 3.00%, 2.92%, and 2.82% for the cookers 1, 2, 3 and 4, respectively. Indeed, 5th order harmonic are the highest levels, with values equal to 2.89%, 2.98%, 2.89%, and 2.79%, respectively for every tested stove.
The average THD voltage growth due to induction stoves penetration ranges from 2.83% to 2.91%, and means a small increment equal to 0.08%. In this sense, voltage harmonics in the prototype home, including induction cookers, accomplish with the limits established in the standards IEC 61000-3-6, EN 50160, and the CONELEC 004/01.
Figure 3
Voltage harmonics for the tested induction stoves in stand-by mode until 15th order harmonic
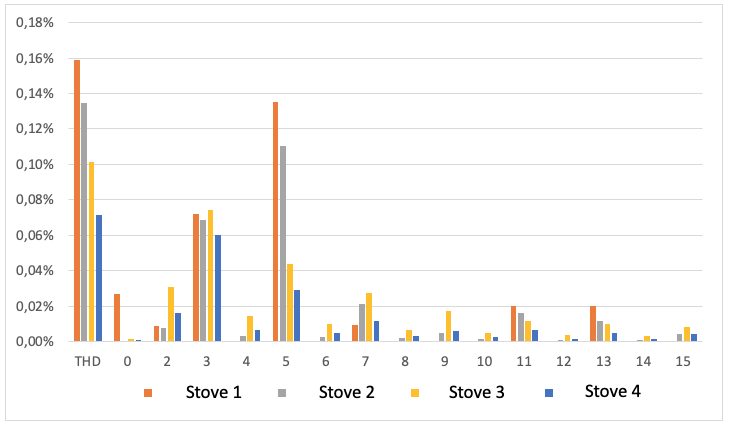
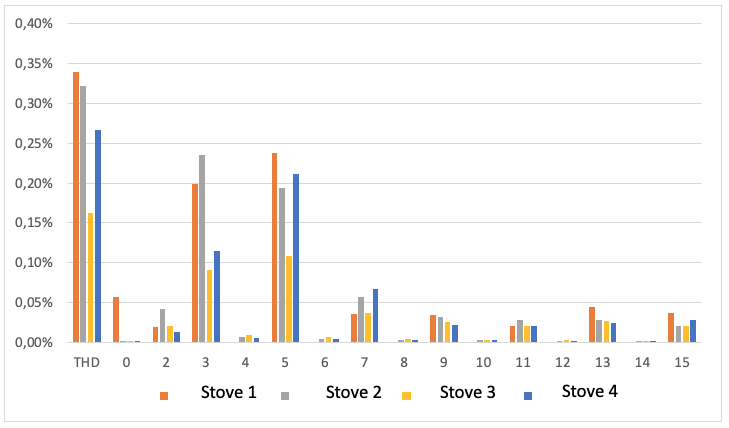
Results for current harmonics and current THD of the four tested induction cookers in stand-by mode until 15th order harmonic are presented in figure 4. THD final results are 0.16%, 0.13%, 0.10% and 0.07% for each one of the cookers respectively. In this case, 3rd order harmonic had the follow values: 0.07%, 0.07%, 0.07%, and 0.06%, whereas 5th order harmonic reached these values: 0.14%, 0.11%, 0.04%, and 0.03%.
The average growth of current THD, in absolute value, varies from 0.10% to 0.115%, due to the inclusion of tested induction cookers. Hence, the final variation is equal to 0.015%. Also, it can be noted that even after the 4 models of induction cookers were included, both voltage and current harmonic distortion continue keeping lower values than national and international regulations require.
Figure 4
Current harmonics results of the tested induction stoves in stand-by mode, until 15th order harmonic
In this subsection, the results of voltage and current harmonic distortion are presented. These measurements were carried out after the tested stoves were connected and during cooking processes. Voltage harmonic results and voltage THD for every tested induction stoves, up to the 15th order harmonic, are depicted in figure 5. THD values were: 3.16%, 2.99%, 2.91% and 2.82% for stoves 1, 2, 3, and 4, respectively. For the tests done, 5th order harmonic had the highest values, of 3.14%, 2.96%, 2.89%, and 2.79%.
The average growth of voltage, in absolute value, was 0.14%. To illustrate, the initial THD was 2.83% while the final THD was around to 2.97%.
Figure 5
Voltage harmonic results for tested induction stoves in operation mode, until 15th order harmonic
Meanwhile, the results of current harmonics and current THD for the tested stoves appears in figure 6. Measured values of current THD were: 0.34%, 0.32%, 0.16%, and 0.27%, respectively. In this case, 3rd order harmonic had the following values: 0.20%, 0.24%, 0.09%, and 0.11%, whereas 5th order harmonic was: 0.24%, 0.19%, 0.11%, and 0.21%, respectively for each induction stove.
The average growth of current, in absolute value, changed from for 0.10% to 0.27%, what means that the final increment equals to 0.17%.
In this test, not only voltage but also current harmonics, for all tested induction stoves, were within the limits established in the standards IEC 61000-3-6, EN 50160, and CONELEC 004/01 regulation. However, current harmonics showed a considerable rise, which should be considered in network expansion and operation.
Figure 6
Current harmonic results for tested induction stoves in operation mode, until harmonic 15th order harmonic
Results of voltage and current harmonic levels when induction cookers operate in standby mode are shown in table 2. The maximum voltage THD was 0.17%, whereas its average growth was around 0.09% in absolute value. For voltage distortion, 5th order harmonic presented the highest values, which were similar to maximum voltage THD. In contrast, current THD grew up in an absolute value of 0.02% and a maximum of 0.06%. Moreover, results show that 3rd order harmonic decreases an average of 0.02%, while 5th order harmonic increases in 0.05%.
Since a statistical approach, the achieving results demonstrate that the covariance between voltage THD and current THD is 0.0019, which suggests a close relation amid these two variables. In addition, the standard deviation of voltage THD ranges between 0.07 and 0.08, while current varies among 0.01 and 0.05. Finally, the variance is placed for both voltage THD and current THD below 1%.
Table 2
Results of voltage and current harmonic levels
for tested induction stoves during standby mode.
Without stove |
Standby mode |
Average value |
Standard deviation |
Variance |
Difference |
Mean difference |
|||
Voltage harmonic distortion (%) |
THD |
1 |
2.83 |
2.92 |
2.91 |
0.07 |
0.004 |
0.09 |
0.09 |
2 |
3.00 |
0.17 |
|||||||
3 |
2.92 |
0.09 |
|||||||
4 |
2.82 |
-0.01 |
|||||||
5th |
1 |
2.8 |
2.89 |
2.89 |
0.08 |
0.005 |
0.09 |
0.09 |
|
2 |
2.98 |
0.18 |
|||||||
3 |
2.89 |
0.09 |
|||||||
4 |
2.79 |
-0.01 |
|||||||
Current harmonic distortion (%) |
THD |
1 |
0.1 |
0.16 |
0.11 |
0.04 |
0.001 |
0.06 |
0.01 |
2 |
0.13 |
0.03 |
|||||||
3 |
0.10 |
0.00 |
|||||||
4 |
0.07 |
-0.03 |
|||||||
5th |
1 |
0.04 |
0.14 |
0.08 |
0.05 |
0.002 |
0.10 |
0.04 |
|
2 |
0.11 |
0.70 |
|||||||
3 |
0.04 |
0.00 |
|||||||
4 |
0.03 |
-0.01 |
|||||||
3rd |
1 |
0.09 |
0.07 |
0.07 |
0.01 |
0.000 |
-0.02 |
-0.02 |
|
2 |
0.07 |
-0.02 |
|||||||
3 |
0.07 |
-0.02 |
|||||||
4 |
0.06 |
-0.03 |
|||||||
Table 3 shows the difference of harmonic levels produced as a result of induction cookers operation in the prototype house. Voltage THD increased in absolute value of 0.14% and maximum of 0.33%. For voltage analysis, 5th order harmonic had the highest values, in a range similar to THD. On the other hand, current THD presented an average growth of around 0.17% and a maximum of 0.24%. In this case, 3rd order harmonic grows an average of 0.07%, and 5th order harmonic increases in 0.15%.
Moreover, statistical results show that covariance between voltage and current THD is 0.007, which confirms a slight relation between these values. In the same way, the standard deviation of voltage THD varied between 0.14 and 0.15, while in the case of current THD, standard deviation ranged among 0.06 and 0.08. Ultimately, variance for voltage THD was equal to 1.6%, and current THD variance was below 1%.
It should be stressed that current THD had a significant increment because it ranges from 170%, initial average value without induction cooker, to 240% in the last tests. However, voltage and current THD accomplished the limits proposed by the power quality standards assumed in this paper.
Table 3
Results of voltage and current harmonic levels for tested
induction stoves during cooking processes and off mode.
# |
Stove off mode |
Stove on mode |
Average |
Standard deviation |
Variance |
Diference |
Average |
||
Voltage harmonic distortion (%) |
THD |
1 |
2.83 |
3.16 |
2.97 |
0.14 |
0.015 |
0.33 |
0.14 |
2 |
2.99 |
0.16 |
|||||||
3 |
2.91 |
0.08 |
|||||||
4 |
2.82 |
-0.01 |
|||||||
5th |
1 |
2.8 |
3.14 |
2.89 |
0.15 |
0.016 |
0.34 |
0.15 |
|
2 |
2.96 |
0.16 |
|||||||
3 |
2.89 |
0.09 |
|||||||
4 |
2.79 |
-0.01 |
|||||||
Current harmonic distortion (%) |
THD |
1 |
0.1 |
0.34 |
0.27 |
0.08 |
0.005 |
0.24 |
0.17 |
2 |
0.32 |
0.22 |
|||||||
3 |
0.16 |
0.06 |
|||||||
4 |
0.27 |
0.17 |
|||||||
5th |
1 |
0.04 |
0.24 |
0.19 |
0.06 |
0.002 |
0.20 |
0.15 |
|
2 |
0.19 |
0.15 |
|||||||
3 |
0.11 |
0.07 |
|||||||
1 |
0.21 |
0.17 |
|||||||
3rd |
2 |
0.09 |
0.20 |
0.16 |
0.07 |
0.004 |
0.11 |
0.07 |
|
3 |
0.24 |
0.15 |
|||||||
4 |
0.09 |
0.00 |
|||||||
1 |
0.11 |
0.02 |
|||||||
This research presents a comprehensive analysis regarding induction stoves penetration due to the Ecuadorian program called EPC, which wants to introduce approximately 3 million of induction stoves. In order to analyze power quality issues, voltage and current harmonic levels were measured in four different models of induction cookers available in the Ecuadorian market at the moment. The achieving results show that the induction stoves generate more voltage harmonic distortion during its “ON” mode than in a standby mode. In cases, none measure exceed the limits established in the standards IEC 61000-3-6 (2012), EN 50160 (2011), and CONELEC 004/01 (2001) regulation, especially designed for power quality in distribution networks by Ecuadorian authorities. The average percentage of THD growth without an induction cooker is 3%, while this value rises up to 5% for induction cookers in the standby and operation modes.
In a similar way, current harmonic distortion is higher during induction stoves operation than the standby mode. The growth in absolute value is relatively low and fulfills the limits established in the adopted standards. In fact, measured values are extremely lower than the limits. The average percentage of THD is 20% when induction cookers were not included, whereas this value is 170% with induction cookers in standby and operation. At this point, it should be emphasized that although the limits established in the regulations are not exceeded, there is a possibility that current THD increases around 170% during peak hours affecting distribution networks, mainly 5th order harmonic grows 375% and 3rd order harmonic reaches a value around 78%.
The achieving results are also in concordance with those obtained within the research "Analysis of the Frontiers Plan for Clean Cooking in Ecuador" (Goldemberg et al. 2018), in which the harmonic distortion effects because of induction stoves connection in an entire town, at northern Ecuador, were analyzed. Additionally, these results are related to the previous research named “Analysis of the harmonic distortion and the effects of attenuation and diversity in residential areas" (Suárez et al. 2005), where an analysis related to harmonic distortion was carried out, but it did not consider a mass penetration of home appliances over electric networks. In this sense, voltage and current harmonic distortion values were very similar in both papers. Besides that, the topic and the results of this article are also related to the research "A study on the effects of voltage distortion on current harmonics generated by modern SMPS driven home appliances in Smart Grid network" (Kit et al. 2012), which presents results within the margins of the current paper.
This paper enhances the existing literature regarding harmonic distortion in households and distribution networks. In addition, this research serves as reliable information to Ecuadorian government in order to regulate power quality in end users’ homes besides strengthening the EPC program. Furthermore, the research helps to know the behavior of the electrical network before a massive introduction of induction stoves. Finally, it can also boost clean and electricity-based cooking programs worldwide.
This paper analyzes the induction stoves penetration in Ecuador within the EPC program, which incorporates non-linear loads, current harmonic injection sources, distorting voltage and current waveforms. In this way, we have examined how these loads interact with the impedance of the residential sector and their effect over distribution networks.
The obtained results confirm that the proposed change in technology for cooking process is not going to generate technical issues on electric circuits of Ecuadorian homes. Additionally, it is estimated that there is not going to be major impact on the THD of distribution networks. Nonetheless, it is expected that current THD increases during the hours on which residential users cook their food, especially in breakfast, lunch, and dinner time, could be equal to 170%, which is a considerable value, but it does not exceed the limits defined by the standards.
Finally, this paper intends to help future studies to provide useful information about the power quality due to electrical devices irruption, which are featured by adding waveform distortion on electrical systems. In this sense, it could also help to establish programs for access to clean cooking systems based on electricity because of the fact that induction stoves show low levels of harmonic affectation over distribution networks.
CONELEC, 004-01. Calidad del Servicio Eléctrico de Distribución (2001). Retrieved from: https://www.google.com/url?sa=t&rct=j&q=&esrc=s&source=web&cd=1&cad=rja&uact=8&ved=2ahUKEwiAtMnF9YvfAhXhmeAKHSgDC5IQFjAAegQICRAC&url=http%3A%2F%2Fwww.regulacionelectrica.gob.ec%2Fwp-content%2Fuploads%2Fdownloads%2F2016%2F02%2FRegulacion-No.-CONELEC-004-01.pdf&usg=AOvVaw1pykaVtKYLjkAJXUAaDRG-
Espinoza, V.S., Guayanlema, V. & Martínez-Gómez, J. (2018). Energy Efficiency Plan Benefits in Ecuador: Long-range Energy Alternative Planning Model. International Journal of Energy Economics and Policy. 8(4):52-64.
Retrieved from: http://www.econjournals.com/index.php/ijeep/article/view/6503/3784
Goldemberg, J., Martínez-Gómez, J., Sagar, A. & Smith, K.R. (2018). Household air pollution, health, and climate change: cleaning the air. Environmental Research Letters13(3): 030201.
Retrieved from: http://iopscience.iop.org/article/10.1088/1748-9326/aaa49d/meta
Kastillo, J. P., Martínez-Gómez, J., Villacis, S. P., & Riofrio, A. J. Thermal Natural Convection Analysis of Olive Oil in Different Cookware Materials for Induction Stoves. International Journal of Food Engineering, Vol. 13, year 2017, number 3. Retrieved from: https://www.degruyter.com/view/j/ijfe.ahead-of-print/ijfe-2016-0065/www.degruyter.com/view/j/ijfe.ahead-of-print/ijfe-2016-0065/ijfe-2016-0065.xml
Kit, M. Y., Tse, C. F., & Lau, W. H. A study on the effects of voltage distortion on current harmonics generated by modern SMPS driven home appliances in Smart Grid network. In Advances in Power System Control, Operation and Management (APSCOM 2012). year 2012, pages 1-6. Retrieved from: https://digital-library.theiet.org/content/conferences/10.1049/cp.2012.2136
Martínez, J., Martí-Herrero, J., Villacis, S., Riofrio, A. J., & Vaca, D. Analysis of energy, CO2 emissions and economy of the technological migration for clean cooking in Ecuador. Energy Policy. Vol. 107, year 2017, pages 182-187. Retrieved from: https://doi.org/10.1016/j.enpol.2017.04.033
Martínez-Gomez, J., Guerron, G., & Riofrio, A. J. Analysis of the" Plan Fronteras" for Clean Cooking in Ecuador. International Journal of Energy Economics and Policy. Vol. 7, Year 2017, Number 1, pages 135-146. Retrieved from: http://www.econjournals.com/index.php/ijeep/article/view/3574
Martínez-Gómez, J. ANALYSIS OF PHYSICOCHEMICAL AND MICROBIOLOGICAL MEASUREMENTS OF FOOD PREPARED USING DIFFERENT STOVES. Carpathian Journal of Food Science & Technology. Vol. 9, year 2017, number 1, pages 68-79. Retrieved from: https://web.b.ebscohost.com/abstract?direct=true&profile=ehost&scope=site&authtype=crawler&jrnl=20666845&AN=124942598&h=Yx6G1HCjYZWz68UkzG7c1bj1SswW2xkhD9MnIzWFYJ5jBzJVpTXHKpar8OCyCHYsFAhUzDnUgC0YS2mnR67HLg%3d%3d&crl=c&resultNs=AdminWebAuth&resultLocal=ErrCrlNotAuth&crlhashurl=login.aspx%3fdirect%3dtrue%26profile%3dehost%26scope%3dsite%26authtype%3dcrawler%26jrnl%3d20666845%26AN%3d124942598
Martínez-Gómez, J., Ibarra, D., Villacis, S., Cuji, P., & Cruz, P. R. Analysis of LPG, electric and induction cookers during cooking typical Ecuadorian dishes into the national efficient cooking program. Food Policy. Vol. 59, year 2016, pages 88-102. Retrieved from: https://doi.org/10.1016/j.foodpol.2015.12.010
Norma, U. N. E. E. N. 50160. Características de la tensión suministrada por las redes de distribución. AENOR. Year 2011. Retrieved from: https://www.une.org/encuentra-tu-norma/busca-tu-norma/norma/?c=N0046945
Riofrio, A. Modelización de una micro red fotovoltaica aplicada a equipos de cocción por inducción para el reemplazo de GLP. Quito, Pichincha, Ecuador: Universidad Politécnica Salesiana. Year 2015, pages 1-112. Retrieved from: https://dspace.ups.edu.ec/handle/123456789/8218
Standard, I. E. C. 61000-4-30. Testing and Measurement Techniques–Power Quality Measurement Methods. Year 2012. Retrieved from: https://www.atecorp.com/compliance-standards/iec-standards/iec-61000-4-30
Suárez, J., Mauro, G., Anault, D., & Agüero, C. Análisis de la distorsión armónica y los efectos de atenuación y diversidad en áreas residenciales. Revista del IEEE América Latina, Vol. 3, year 2005, number 5, pages 71-77. Retrieved from: www.academia.edu/download/41315132/Analisis_de_la_distorsion_armonica_y_los_efectos_de_atenuacion_y_diversidad_en_areas_residenciale.pdf
Villacis, S., Martínez, J., Riofrío, A. J., Carrión, D. F., Orozco, M. A., & Vaca, D. Energy efficiency analysis of different materials for cookware commonly used in induction cookers. Energy Procedia, Vol. 75, year 2015, pages 925-930. Retrieved from: https://doi.org/10.1016/j.egypro.2015.07.252
Wagner, V. E. (1993). Effects of harmonics on equipment. IEEE Transactions on Power Delivery 8(2):672-680. Retrieved from: https://ieeexplore.ieee.org/abstract/document/216874/
1. Ingeneer on Mechatronics. Researcher at Instituto de Investigación Geológico y Energético (IIGE), Technology Transfer Exper. Unit – Quito. Contact e-mail: dario.rodriguez@geoenergia.gob.ec
2. Ph. D on Material Science and Engineering. Academic staff at Universidad Internacional SEK – UISEK – Quito, Ecuador. Contact e-mail: javier.martinez@uisek.edu.ec
3. MSc. on Renewable Energy. Academic staff at UTE. Contact e-mail: gonzalo.guerron@geoenergia.gob.ec
4. B.Sc. on Electrical Engineering. Researcher at the National Research and Development Department of Corporación Eléctrica del Ecuador (CELEC EP), Coca Codo Sinclair Business Unit – Quito. Contact e-mail: augusto.riofrio@celec.gob.ec
5. Ph. D. Researcher on Electronics and Electrical Engineering. Deputy Technical Director at Instituto de Investigación Geológico y Energético (IIGE), Quito. Academic staff at Universidad Central del Ecuador, Facultad de Ingeniería Química – UCE – Quito, Ecuador. Academic staff at Universidad Internacional SEK – UISEK – Quito, Ecuador. Contact e-mail: ricardo.narvaez@geoenergia.gob.ec