![]() ISSN 0798 1015
ISSN 0798 1015

![]() ISSN 0798 1015
ISSN 0798 1015
Vol. 40 (Number 20) Year 2019. Page 13
CAZALLO ANTÚNEZ, Ana María 1; MEÑACA GUERRERO, Indira 2; LECHUGA CARDOZO, Jorge Isaac 3; MEDINA CARRASCAL, Héctor José 4; URIBE URÁN, Carlos Mario 5 y BARRAGÁN MORALES, Camilo Enrique 6
Received: 07/03/2019 • Approved: 28/05/2019 • Published 17/06/2019
ABSTRACT: Foreign direct investment received in the oil sector in Colombia is a dependent variable, based on percentages with respect to GDP of exports of goods and services, and gross capital formation as independent. This work highlights the oil sector within the Colombian economy and the important role that foreign investors have had in this sector. The link between this variable and another macroeconomic variable was identify within the parameters marked within the model of multiple linear regression. This research is quantitative, of an explanatory type and is framed within the paradigm of structuralism. In this research work, the SPSS statistical program for modeling is implemented and the econometric model of direct foreign investment of the Colombian oil sector between 1996 and 2016 is sought. |
RESUMEN: La inversión extranjera directa recibida en el sector petrolero en Colombia es una variable dependiente, basada en porcentajes en relación al PIB de las exportaciones de bienes y servicios, y la formación bruta de capital como variable independiente. Este trabajo destaca el sector petrolero en la economía colombiana y el importante papel que los inversores extranjeros tuvieron en ese sector. La conexión entre esta variable y otra variable macroeconómica se identificaron dentro de los parámetros marcados en el modelo de regresión lineal múltiple. Esta investigación es cuantitativa, de tipo explicativo y está encuadrada en el paradigma del estructuralismo. En este trabajo de investigación, el programa estadístico SPSS para modelado es implementado y el modelo econométrico de la inversión extranjera directa del sector petrolero colombiano entre 1996 y 2016 es buscado. |

The economic development of Colombia in the 20th century was linked to the behavior of foreign trade, where fluctuations in the exchange rate and the behavior of export volumes were decisive in the activity cycles and the productive structure of the country. It is from the last decade of the last century when Colombia is committed to a model of economic opening based on the fall in transport and communications costs, and the reduction of tariff and non-tariff protection (Villar & Esguerra, 2005).
For the specific case of Colombia, the Colombian economic opening process has favored the economic growth development of the country and has also contributed to the modernization of the economy promoting investment and national and international trade (Rodriguez, Meñaca, Cazallo, Lechuga, Bascón y Meñaca, 2018). All this has been thanks to the implementation of a series of reforms aimed at achieving greater macroeconomic stability and the optimization of the business climate in general. Additionally, at the international level, the implementation of an open trade and investment policy has been transcendental, resulting in the signing of Free Trade Agreements and bilateral investment treaties (OECD, 2014).
In this same line, Ronderos-Torres (2010) states that within the process of economic opening, FDI has become an instrument for developing countries, which allows them to improve their economic and social performance, since these investments directly affect growth and competitiveness. Foreign direct investment (FDI) in Colombia is a key factor in the economic development of the Latin American country because it is considered a source of external financing that has large effects on the balance of payments, long-term economic growth and productivity of the country. country (Garavito, Iregui, & Ramírez, 2012; Cazallo & Salazar, 2018).
Likewise, the OECD (2011) affirms that FDI is transcendental for international economic integration so that for countries that have an adequate political framework, FDI can be a tool that allows them to offer financial stability, promote economic development and therefore, improve the welfare of companies, being considered one of the main impulses of the globalization process.
Along with the above, Ramírez (2010) confirms the need to have a framework that does not have that kind of foreign investment, direct and portfolio investment, the first is the one that has a greater weight in Colombia and that from 2004, the numbers have been increasing thanks to the increase of the confidence of the foreign countries in the Latin country and the advances provoked in the matter of security. Completing the above and, as in most developing countries, having a commercial policy aimed at inclusion in global markets and the generation of incentives prone to attract foreign capital, causes variables such as FDI. Assume an important role in the growth and economic development of the country (Reina, Ospina, Macías, & Cortés, 2016).
This article presents the modeling of foreign direct investment (FDI) received in the Colombian oil sector during the 1996-2016 period in relation to gross capital formation (FBK) and exports. Colombia undergoes a change of model in the nineties, changing from a protectionist model to a neoliberal one, with the effects that this entails for the economy in general and the industrial and agrarian sector, especially affecting foreign trade (Nájar, 2006). This change in model affected most of the Latin American countries where the industrialization model was exhausted through substitution, giving rise to a model with greater economic openness within the international paradigm (Becerril & Minguía, 2013).
On the other hand, for the Colombian case it is necessary to know the importance of the oil sector in the economy and the existing relationships with other sectors. It is necessary to mention the fact that the oil sector is directly linked to the public sector since it generates income through the taxes, royalties and profit sharing of the state oil companies. In the same way, the external sector is also closely linked to the oil sector due to external economic transactions that influence the current account balance, the exchange rate or the foreign exchange market. Within this group, transactions in foreign investment, exports of crude oil and derivatives, imports of machinery, inputs and specialized technical services or the payment of benefits to foreign investors are highlighted (López, Montes, Garavito & Collazos, 2013).
Completing the above and for the specific case of this study, the FDI received in the oil sector is taken as a dependent variable and it is necessary to analyze the importance of the sector within the Colombian economy. In this regard, in 2011, 5% of the country's GDP corresponded to the oil sector and growth for the period 2000-2011 was 38% for all hydrocarbons (Colombian Oil Association, 2012). Completing the above, it is proven that the increase of private participation in the oil sector and the promotion of FDI have been key in the growth of the sector. In this sense, FDI in the oil sector increased by 14% during the period 2003-2013, reaching a maximum value in 2010 equivalent to 48% of total FDI (Fedesarrollo, 2014).
Following is the evolution of the FDI received in the oil sector in Colombia during the study period (see illustration 1). There was a significant increase from 2005 to 2014, reaching the maximum figure of 5,471 million dollars in 2012, however as of 2015 it is reduced by half (Banco de la República de Colombia, 2018). These facts are justified due to the favorable external context as well as some national events that contributed to the growth of Colombian mining-energy production.
Figure 1
Evolution of the FDI received in Colombia in the oil sector
during the period 1996-2016 (data in millions of USD)
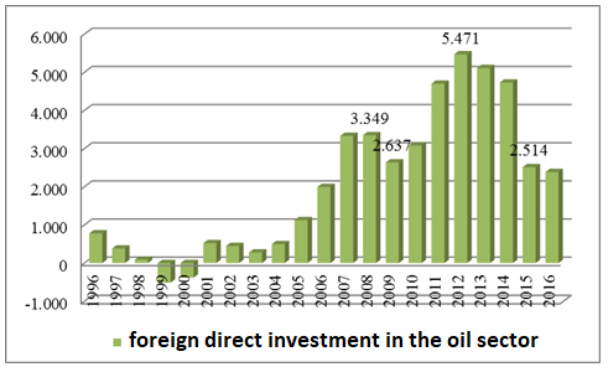
Source: own elaboration based on data from the Bank of the Republic (2018)
It should be mentioned that the evolution of FDI received in the oil sector in Colombia is closely related to the price of the barrel. Specifically, during the 2002-2008 period, the spot price of Brent's barrel went from 19.42 dollars in January 2002 to 132.2 dollars in June 2008, which favored the increase in FDI received. Likewise, the fall in barrel prices from the second half of 2008 to June 2009, where a minimum value was recorded, caused the FDI received to reach very low values with respect to previous years. However, as of that date the price of the barrel begins to recover exceeding the figure of one hundred dollars from April 2011 to June 2014. Finally, in 2015 there is a sharp fall and the price reaches the value of 37 dollars in December of that year accumulating a fall of 41% compared to the same date of the previous year (Martínez, 2016; Lechuga, et al., 2018).
In this line, Toro, Garavito, López & Montes (2015) affirm that the Colombian economy was affected abruptly due to the drop in the price of oil at the international level, a fact that occurred in a surprising and accelerated manner. They also stated that according to the analysts, the shock could last for several years, which would prevent an early economic recovery and affect the production volume of hydrocarbons because of lower investment in the sector due to low prices.
Next, the importance and behavior of the independent variables are described: exports and gross capital formation. The first one, exports are defined in Royal Decree 390/2016 as:
The exit of merchandise of the National Customs Territory fulfilling the customs formalities provided for in this decree. Export is also considered as the exit of merchandise to a free warehouse, under the conditions established in this decree (Colombian Ministry of Finance and Public Credit, 2016, pp. 9).
Regarding exports, González (2014) analyzes the trade balance by sectors during the opening period and shows the predominant weight of crude oil, coal, nickel and gold in Colombian exports. Likewise, it affirms that without the resources derived from these, the country could not import industrial goods that it does not produce and that are necessary to develop capacities and acquire technological knowledge. Expanding on this information, Olmos and Medina (2008) concluded that despite the existence of a framework of economic openness, Colombian international trade was not diverse in relation to the destination of its exports, and there was a strong dependence on the Latin American and US market that included more than 60% of the total.
Cárdenas & Solano (2014) describe the changes that have occurred in the productive structure of the Colombian economy because of trade liberalization, the fluctuation of the exchange rate, changes within monetary and fiscal policy have reduced the vulnerability of the economy Colombian as explained above, FDI has grown, thus boosting gross fixed capital formation, reaching in 2012 to contribute to 28% of GDP.
Despite the existence of other theories such as structuralist theory or cephalism, many authors have defended the neoclassical theory or theory of endogenous growth based on the direct and positive relationship of FDI received in a country with respect to its economic growth. Among the proponents of the theory, it is worth highlighting Solow (1956), Swan (1956) and Rubini and Naranjo (1997) cited by Plazas (2016) that defend the open economic model where there is free mobility of economic factors. Completing the above, Rendón (2006) states that not only does FDI contribute to economic growth, but it also accelerates the processes of convergence towards the economic development of countries.
In addition, according to Chenery and Srinivasan (1989) cited by Garavito, Gaitán, Sandoval and Martínez (2014), developing economies are characterized by infrastructure and capital deficit so that FDI becomes an important source of financing that allows to expand its productive frontier. In this way, international savings are channeled towards productive projects in developing countries to contribute positively to economic growth, employment, gross capital formation and tax collection in the destination countries of FDI (Fedesarrollo, 2007).
On the other hand, Rodríguez & Morar (2001) show that by means of this analysis, the relationship between a dependent variable (Y) can be established, in the case studied, the foreign direct investment received in Colombia in the oil sector, and a set of independent variables (X1, X2, X3, ..., Xn). In this way, through this analysis can be explained more precisely the phenomena, facts and social processes that are desired because they are complex and must be explained by a series of variables that directly or indirectly participate in its realization.
The econometric modeling through linear regression can be simple or multiple. Thus, in the review of the literature Cardona, González, Rivera and Cárdenas (2013) show in their article the benefits of differential statistics in relation to simple linear regression analysis using as examples different situations applied to the Colombian economy within from the area of administration or engineering. In this sense, the authors affirm that the regression analysis allows to establish the functional relationship or mathematical equation that expresses the relationship between the variables and the strength of said relationship. On the other hand, the multiple regression model is related to the simple regression model but in this case the facts are explained by more than one independent variable. The linear regression equation for the case of two independent variables, as is the case of this study, is:
Y = β0 + β1 * X1 + β2 * X2 + ε.
It should also be mentioned that, for the case of multiple regression, the line of best fit is a hyperplane in the n-dimensional space, so for the case study of two independent variables, it would be three-dimensional (Kazmier and Mata, 1991). However, all linear regression must fulfill a series of assumptions such as: linearity of the variables, linearity in the parameters, zero mathematical expectation, homoscedasticity or constant variance of the error term, absence of self-correlation, temporal stability, unidirectional causality and that the explanatory variables are deterministic (Novales, 2010).
In line with the above, Hair, Anderson, Tatham & Black, (1999) determine that all multiple regression must comply with a series of assumptions where the theoretical value and the relation with the dependent variable are examined. It should also be mentioned that "The main measure of the prediction error of the theoretical value is the residual - the difference between the observed values and the predictions of the criterion variable" (Ibid., P.166). Therefore, the testing of the assumptions should be made once the model is estimated, these being: the linearity of the phenomenon measured, the constant variance of the error term, the independence of the error terms and the normality of the distribution of the error term. In this way, through the analysis of the residuals, either with graphs or statistical tests, it provides a series of analytical instruments that examine the suitability of the estimated regression model.
Deepening a little more, Martínez (s.f.) presents a series of hypotheses that must be met by regression models based on the assumptions described above. In this way:
• “j” v.v.a.a. they are variables with zero mean and independent of the Xj.
• Homoscedasticity: j has equal variances.
• “j” is normal and independent.
• Non-multicollinearity: The columns of X are linearly independent (range (X) = k + 1).
The research in which this article originates has become a quantitative approach, with a quantitative, analytical, explanatory level and an experimental, and transectional, method. The variables studied were analyzed in an economic model in Colombia with statistics from 1996-2016.
An econometric model was designed with three variables (foreign direct investment received in the oil sector in Colombia, GDP of exports of goods and services, and gross capital formation), which analyzed official statistics of the oil sector in Colombia in 1996 -2016. This model is summarized in a matrix of ten entries that include correlation statistics and variances. The instrument was built based on structuralist theory or cepalism.
Once the research protocol was initiated, the approach and the formulation of the problem, the objectives and the justification were worked on. During the second phase, a review of the background and the theoretical bases was carried out, which constituted chapter two. The third phase was oriented to the establishment of the methodological framework, in which the approach, the type and the design of the research, the techniques and the econometric model were discussed. The fourth phase included the analysis and discussion of the results, the conclusions, the recommendations and, finally, the bibliographic references that support the work.
After this phase, the final report was prepared, as well as the product article of the work carried out (El Kadi, Pelekais, Robles & Leal, 2014, p. 79).
The results of this article are presented below, where the FDI received (dependent variable) in Colombia is modeled in the oil sector based on the percentage share in GDP of exports and gross capital formation and (independent variables). In this way it is established that:
- Y: Dependent variable àIED received in Colombia in the oil sector.
- X1: Independent variable 1 à Exports of Goods and Services (% of GDP).
- X2: Independent variable 2 à Gross capital formation (% of GDP).
First, the existing correlations between the independent variables with respect to the dependent one is analyzed to corroborate the existing relationship between the variables. According to the data in Table 1, the direct relation of the independent variables with respect to the independent one is observed, being the relation for the case of exports of goods and services (% GDP) equal to 57.3% while for the FBK (% GDP)) is 60.9%.
Table 1
Correlations between the variables.
|
DFI in Colombia in the oil sector |
Exports of Goods and Services (% of GDP) |
Gross capital formation (% of GDP) |
|
DFI in Colombia in the oil sector |
Pearson correlation |
1 |
0,573** |
0,609** |
Sig. (bilateral) |
0,007 |
0,003 |
||
N |
21 |
21 |
21 |
|
** The correlation is significant at the 0.01 level (2 tails).
Source: own elaboration (2018).
Below is the adjusted model estimated from the data derived from the coefficients table (see table 2):
Y = 18579,501 + 853,434 * X1 - 311,637 * X2 + ε
Then, the summary of the estimated model is presented, see table 2, observing that the adjusted R2 is equal to 0.669, which implies that the independent variables are explained to the variable at 66.9%. With what can be said that the FDI received in Colombia in the oil sector can be explained from exports of goods and services (% of GDP) and gross capital formation (% of GDP).
Table 2
Summary of the estimated model.
Model |
R |
R |
R |
|
Change statistics |
Durbin-Watson |
||||
square |
square squared |
Standard error of the estimate |
Change of R square |
Change in F |
df1 |
df2 |
Sig. Change in F |
|||
1 |
0, 838 |
0,702 |
0,669 |
1094,31628 |
0,702 |
21,222 |
2 |
18 |
0 |
1,349 |
Source: own elaboration (2018).
Next, the pertinent tests are carried out on the linear regression model proposed to verify that it complies with the assumptions of normality, not self-correlation, homoscedasticity, linearity and non-collinearity. Thus, if the model complies with the assumptions, it can be affirmed that the significant explanatory variables were used when estimating the FDI received in Colombia in the oil sector and that the inferences made enjoy statistical validity. That is, the model is adequate and fits perfectly with the information collected.
Firstly, the hypothesis test of the coefficients represented in Table 3 is performed and it shows that the two explanatory variables used in the time series are significant and useful when explaining the behavior of the FDI received in Colombia. in the oil sector during the period 1996-2016.
The analysis of the variances (ANOVA) is then performed, represented in table 4, and from which it can be affirmed that the estimated model is good or significant because the null hypothesis (H0) is rejected since the level is observed of significance of F is 0.000 and therefore less than 0.05. In addition, the calculated F is greater than the critical F, that is, 21,222> 3.55.
- H0 reg: The adjusted linear regression model is not significant.
- H1 reg: The adjusted linear regression model is significant.
Table 3
Hypothesis test for the coefficients.
Explanatory variables |
Hypothesis testing |
Contrast (t) |
Statistical relationship |
p-value vs level of significance |
|||
Exports of Goods and Services (% of GDP) |
H0: β1 = 0 |
0.000 < 0.05 |
Significant |
H1: β1 ≠ 0 |
|||
H0 is rejected |
|||
Gross capital formation (% of GDP) |
H0: β2 = 0 |
0.000< 0.05 |
Significant |
H1: β2 ≠ 0 |
|||
H0 is rejected |
Source: own elaboration, (2018)
-------
Table 4
Analysis of variances (ANOVA).
Model |
Sum of squares |
gl |
Half quadratic |
F |
Sig. |
|
1 |
Regression |
50827704,7 |
2 |
25413852,3 |
21,222 |
,000 (b) |
Residue |
21555506,3 |
18 |
1197528,13 |
|
|
|
Total |
72383211 |
20 |
|
|
|
|
Dependent variable: FDI in Colombia in the oil sector
(b) Predictors: (Constant), Gross capital formation (% of GDP), Exports of Goods and Services (% of GDP).
Source: own elaboration, (2018).
a) Normality. Figure 2 shows that the variable direct foreign investment received in the oil sector has a normal behavior. In addition, the test of parameters is performed to check the assumption of normality by means of the Shapiro-Wilk test or test since the sample size is less than 30 observations. In this sense, the following hypothesis test is carried out:
H0: ε is normal.
H1: ε is not normal.
From the data reported in Table 5, the significance of all model variables greater than 0.05 so that we can say that the variables are normal. That is, the variables are considered normal and the null hypothesis (H0) is accepted, from which it is assumed that the errors have a normal distribution.
Figure 2
Normality graph of the IED variable received in Colombia in the oil sector
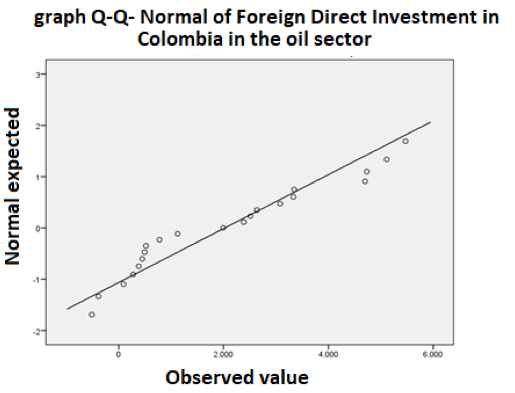
Source: own elaboration, (2018).
-----
Table 5. Normality test.
|
Shapiro-Wilk |
||
Statistical |
gl |
Sig. |
|
FDI in Colombia in the oil sector. |
0,918 |
21 |
0,078 |
FDI in Colombia in the petroleum sector Exports of goods and services (% of GDP) |
0,943 |
21 |
0,253 |
Gross capital formation (% of GDP) |
0,955 |
21 |
0,417 |
*. This is a lower limit of the true significance.
a. Significance correction of Lilliefors
Source: own elaboration (2018).
b) Self-correlation. The second test is called self-correlation, by which the existence or not of self-correlation in the errors of the regression is studied. To carry out this test, the recruitment test is carried out using the Durbin-Watson statistic with a significance level of α = 0.05. In the specific case of this investigation, since it is a model with two independent variables (k = 2), the values of dL and dU must be considered, so that dL <dα <dU is satisfied for 21 observations and where dα is the number such that P (d <dα) = α, where α = 0,05. Also and since dL for k = 2 and 21 observations is equal to 1,125 while dU is equal to 1,530; therefore if the Durbin-Watson statistic in the model is equal to 1,349, see table 6, and therefore belong to the interval [1,125; 1,530] it can be affirmed that there is no self-correlation between the perturbations (errors) of the variables studied, that is, the non-relation between the perturbations corresponding to the different observations is revealed.
Table 6
Self-correlation test: Durbin-Watson statistic.
Model |
Durbin-Watson |
1 |
1,349 |
a. Predictors: (Constant), Gross capital formation (% of GDP),
Exports of Goods and Services (% of GDP)
b. Dependent variable: FDI in Colombia in the oil sector
Source: own elaboration, (2018).
c) Homocedasticity. It refers to the degree of dispersion of the points. As shown in figure 3, there is no uniform dispersion in the points, so the variance of the errors or residuals is constant and does not vary in the different levels of the factors.
d) Linearity. The existence of linearity is analyzed by means of the consistency method of graphs with the objective of establishing the expected value of the dependent variable (FDI received in Colombia in the oil sector) with respect to independent variables. That is, the expected impact of a unitary change in the explanatory variables, ceteris paribus the rest of the variables, will always be the same (see figure 4).
Figure 3
Homocedasticity test
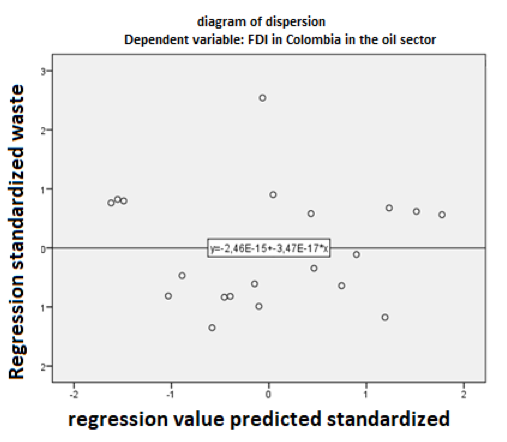
Source: own elaboration, (2018)
-----
Figure 4
Linearity test
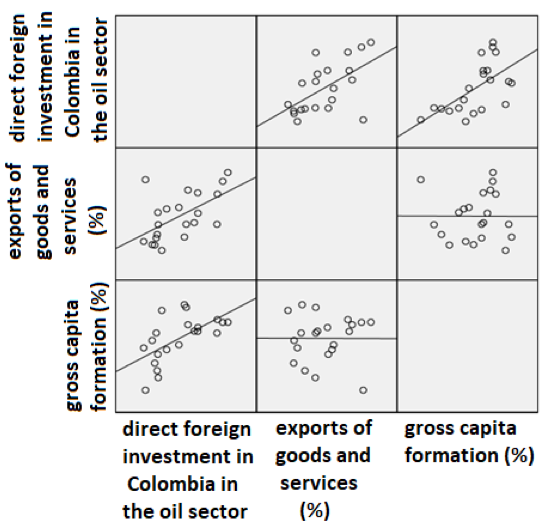
Source: own elaboration (2018)
e) Collinearity. The last place is the collinearity test of the variables using the variance inflation factor (IVF) method defined as: FIVj = 1 / (1-R2j), where R2j is the coefficient of determination of the estimated regression of the j-ésimoregresor on the rest. It should be remembered that, the minimum value is 1 and an FIV> 3 indicates the existence of collinearity. Therefore, as shown in Table 7, the FIV value of the variables is equal to 1,000, so it can be said that the model does not present collinearity.
Table 7
Coefficients
Model |
Coefficients no standardizes |
Coefficients standardizes |
|
t |
Sig. |
95,0% interval of trust for B |
Correlations |
Statistics of collinearity |
|||||||
B |
Error standard |
Beta |
Limit inferior |
Limit superior |
Orden cero |
Partial |
Part |
Tolerance |
VIF |
||||||
1 |
(Constant) |
-18579,501 |
3434,909 |
|
-5,409 |
,000 |
-25795,978 |
-11363,024 |
|
|
|
|
|
||
Exports of Goods and Services (% of GDP) |
853,434 |
190,814 |
,575 |
4,473 |
,000 |
452,549 |
1254,319 |
,573 |
,726 |
,575 |
1,000 |
1,000 |
|||
Gross capital formation (% of GDP) |
311,637 |
65,579 |
,611 |
4,752 |
,000 |
173,861 |
449,414 |
,609 |
,746 |
,611 |
1,000 |
1,000 |
|||
(a) |
(b) Dependent variable: FDI in Colombia in the oil sector |
||||||||||||||
Source: own elaboration (2018).
There is a direct relationship between direct foreign investment in the oil sector in Colombia and exports of goods and services and gross capital formation.
The above is supported by Alvarez, Barraza and Legato (2009) who found that FDI has a positive relationship on economic growth (GDP per capita) and on capital formation (Private capital per capita). He also concluded that the quality of institutions, the protection of private property and human capital are determinants for growth.
On the other hand, the null hypothesis is rejected, which is why the adjusted linear regression model is significant, as well as the indicators of normality, autocorrelation, homoscedasticity, linearity and collinearity.
However, FDI to Colombia has been concentrated in the extractive sectors since the early twentieth century; however, since 1970, FDI has been promoted to second-tier sectors such as manufacturers. Explained in the model of import substitution until the decade of the 80s that contrasts with greater liberalization of the flow of capital in the early 90s to this day.
It is concluded that there is a lack of promotion of FDI towards sectors that generate high added value, since the majority of FDI presents the exploitation of oil and other energy resources as a destination, therefore, the determinants of FDI must be deepened towards high-income sectors. value added.
Finally, improve the country's competitive capacity to attract foreign investment, and public policies and the incentives provided to investors will greatly affect the decision of multinationals to invest in Colombia.
Álvarez, A.; Barraza, J. & Legato, A. (2009). Foreign Direct Investment and Growth in Latin America. Información Tecnológica, vol. 20, (6), 115-124. https://scielo.conicyt.cl/pdf/infotec/v20n6/art14.pdf
Banco de la República Colombia (2018). Flujos de inversión extranjera directa en Colombia según actividad económica. Retrieved from http://www.banrep.gov.co/es/inversion-directa
Becerril, O. & Minguía, G. (2013). Efecto de la globalización sobre la eficiencia técnica en el contexto regional de Colombia. AD-minister. 22, 9-31. Retrieved from https://www.redalyc.org/html/3223/322327380002/index.html
Cárdenas, C. & Solano, N. (2014). Caracterización de la formación bruta de capital fijo en Colombia: comportamiento y dinámica en los años recientes. Reportes del emisor, 78, 1-4. Retrieved from
https://publicaciones.banrepcultural.org/index.php/emisor/article/view/7887/8267
Cáceres, W. (2013). Las exportaciones y el crecimiento económico en Colombia 1994-2010. Apuntes del Cenes. 32, (56), 53-80. Retrieved from http://www.scielo.org.co/pdf/cenes/v32n56/v32n56a04.pdf
Cardona, D., González, J., Rivera, M. & Cárdenas, E. (2013). Aplicación de la regresión lineal en un problema de pobreza. Revista Interacción. 12, 73-84. Retrieved from http://www.unilibre.edu.co/revistainteraccion/volumen12/art4.pdf
El Kadi, O., Pelekais, C., Robles, M. & Leal, M. (2015). Autotomía caudal como estrategia gerencial para el cambio organizacional en empresas familiares. Desarrollo Gerencial, 7, (1), 68-84. Retrieved fromhttps://doi.org/10.17081/dege.7.1.453
Fedesarrollo (2007). Impacto de la inversión extranjera en Colombia: situación actual y perspectivas (informe final). Bogotá: Proyecto elaborado por Fedesarrollo para Proexport. Retrieved from http://www.repository.fedesarrollo.org.co/bitstream/handle/11445/979/Repor_Diciembre_2007_Fedesarrollo.pdf?sequence=1&isAllowed=y
Fedesarrollo, (2014). Evaluación de la contribución económica del sector de hidrocarburos colombiano frente a diversos escenarios de producción. Bogotá: Unidad de Planeación Minero Energética – UPME. Retrieved from http://www.repository.fedesarrollo.org.co/bitstream/handle/11445/1688/Repor_Diciembre_2014_Villar_et_al.pdf?sequence=1
Garavito, A., Gaitán, C., Sandoval, D. & Martínez, A. (2014). Recuadro 1. Evolución y perspectivas de la inversión extranjera directa en Colombia. Recuadros del Informe sobre Inflación, 1, 26-29. Retrieved from http://www.banrep.gov.co/docum/Lectura_finanzas/pdf/isi_mar_2014_recuadro1.pdf
González, J. (2014). Colombia: logros en dos décadas de modelo de desarrollo aperturista – análisis según resultados de balanza comercial. Análisis Político, 27, (82), 212-235. Retrieved from https://search.proquest.com/central/docview/1681906352/5D18053A79084865PQ/2?accountid=45648
Hair, J., Anderson, R., Tatham, R. & Black, W. (1999). Análisis Multivariante. (5th ed.). Spain: Prentice Hall.
Kazmier, L. & Díaz, M. (1991). Estadística aplicada a administración y economía. (2a. ed.). Mexico: McGraw-Hill.
LECHUGA, Jorge, I., CAZALLO, Ana, M., MEÑACA, Indira, MARTÍNEZ, Hugo, R., OLIVERO, Enohemit, GARCÍA, Jesús, E. Análisis del comportamiento de las exportaciones del Departamento del Atlántico (Colombia) entre 2012–2016. Revistas Espacios. Vol. 39 (Nº22) Año 2018. Pág. 22. Retrieved from http://www.revistaespacios.com/a18v39n22/a18v39n22p22.pdf
López, E., Montes, E., Garavito, A. & Collazos, M. (2013). La economía petrolera en Colombia (Part II). Relaciones intersectoriales e importancia en la economía nacional. Borradores de economía. 748, 1-57. Retrieved from http://www.banrep.gov.co/sites/default/files/publicaciones/archivos/be_748.pdf
Martínez, A. (2016). Impacto de un nuevo panorama de los precios del petróleo en las diferentes regiones de Colombia. Cuadernos PNUD. Retrieved from http://www.co.undp.org/content/dam/colombia/docs/MedioAmbiente/undp-co-Impacto%20de%20un%20nuevo%20panorama%20de%20los%20precios%20del%20petr%C3%B3leo%20en%20las%
20diferentes%20regiones%20de%20Colombia-2016.pdf.
Ministerio de Hacienda & Crédito Público. (2016). Decreto número 390 de 2016, por el cual se establece la regulación aduanera. Retrieved fromhttps://www.mintic.gov.co/portal/604/articles-14747_documento.pdf
Nájar, A. (2006). Apertura económica en Colombia y sector externo (1990-2004). Apuntes del Cenes. 26 (41), 77-98. Retrieved from http://revistas.uptc.edu.co/index.php/cenes/article/view/192/196
OCDE (2011). OCDE Definición Marco de Inversión Extranjera Directa: 4th Ed., Éditions OCDE. DOI: http://dx.doi.org/10.1787/9789264094475-es
Olmos, J., & Medina, E. (2008). Incrementando las relaciones comerciales entre Colombia y China. Estudios Gerenciales. 24, (109), 127-165. Retrieved from https://search.proquest.com/docview/214395056?accountid=45648
Plazas, F. (2016). Análisis de la evolución de la inversión extranjera directa en el sector minero del carbón en Colombia de 2004 a 2013. Apuntes del Cenes. 35, (61), 51-84. Retrieved from http://www.scielo.org.co/pdf/cenes/v35n61/v35n61a03.pdf
Ramírez, C. (2010). La inversión extranjera directa en Colombia. Años 1990-2009. Saber, ciencia y libertad. 5, (2), 173-183. Retrieved from http://www.sabercienciaylibertad.org/ojs/index.php/scyl/article/view/153/124
Rendón, J. (2006). Los impactos de la inversión extranjera directa en la economía colombiana. El caso de la industria de bebidas. Semestre Económico, 9, (18), 11-37. Retrieved from http://www.redalyc.org/html/1650/165013669001/
Rodríguez, M. & Morar, J. (2001). Estadística informática. Casos y ejemplos con el SPSS. Alicante: Universidad de Alicante, Servicio de publicaciones.
RODRÍGUEZ, José. M., MEÑACA, I., CAZALLO, Ana, M., LECHUGA, Jorge. I., BASCÓN, M., & MEÑACA, Sor, A. Hermanamiento entre Barranquilla (Colombia) y Bilbao (España) como instrumento de cooperación internacional descentralizado. Revista Espacios. Vol. 39 (Nº22) Año 2018. Pág. 26. Retrieved from http://www.revistaespacios.com/a18v39n22/a18v39n22p26.pdf
Ronderos-Torres, C. (2010). Inversión extranjera y competitividad. Gcg Georgetown University - Universia, 4 (2), 72-87. Retrieved from https://gcg.universia.net/article/download/385/511.
Toro, J., Garavito, A., López, D. & Montes, E. (2015). El choque petrolero y sus implicaciones en la economía colombiana. Borradores de economía, 906. Retrieved from http://www.banrep.org/docum/Lectura_finanzas/pdf/be_906.pdf
Villar, L. & Esguerra, P. (2005). El comercio exterior colombiano en el siglo XX. Borradores de Economía – Banco de la República de Colombia. 358, 1-53. Retrieved from http://www.banrep.gov.co/docum/ftp/borra358.pdf.
1. PhD in Methodology, Techniques and Analysis of Regional Development. Professor Researcher. Corresponding author. Faculty of Administration and Business, University Simón Bolívar, Avenue 59 No. 59-65 Street, Barranquilla, Atlántico, 080001, Colombia. E-mail addresses: ana.cazallo@unisimonbolivar.edu.co
2. Master in Business Administration. Professor Researcher, University Simón Bolívar. E-mail addresses: Indira.menaca@unisimonbolivar.edu.co
3. Master in Business Administration. Doctoral student in International Relations, Business & Diplomacy, Universidad Autónoma de Nuevo León. E-mail addresses: jorge.lechugacrd@uanl.edu.mx
4. Master in Business Administration. Professor Researcher, University Simón Bolívar. E-mail addresses: hmedina1@unisimonbolivar.edu.co
5. Mg.en Sustainable Development and Environment, University of Manizales; Professor of the Faculty of Business Administration and Business of the Simón Bolívar University (Department of Commerce and International Business). E-mail: curibe5@unisimonbolivar.edu.co
6. Business Administrator. Specialist in Management and Innovation, University Simón Bolívar. Researcher. E-mail addresses: cbarraganm93@gmail.com