![]() ISSN 0798 1015
ISSN 0798 1015

![]() ISSN 0798 1015
ISSN 0798 1015
Vol. 40 (Number 30) Year 2019. Page 30
REMACHE, Abel P. 1; ARROYO, Flavio R. 2 & GANCINO, Grace 3
Received: 10/03/2019 • Aprobado: 03/09/2019 • Publicado 09/09/2019
ABSTRACT: The industrial sector represents 19% of the total final energy demand of Ecuador, being the second sector with the highest consumption. A model based on systems dynamics was developed to visualize the trends of final energy consumption by each industrial sub-sector, based on the energy sources they consume. International policies and trends are safe scenarios towards reducing energy consumption, mitigating CO2 emissions and industrial competitiveness. |
RESUMEN: El sector industrial representa el 19% del total de la demanda final energética del Ecuador, siendo el segundo sector con mayor consumo. Se desarrolló un modelo basado en dinámica de sistemas para visualizar las tendencias del consumo de energía final por cada subsector industrial, basados en las fuentes de energía que estos consumen. Las políticas y tendencias internacionales son escenarios seguros hacia la reducción del consumo de energía, la mitigación de emisiones de CO2 y la competitividad industrial. |

The Ecuadorian manufacturing industry according to the INEC (INEC, 2016) consumes approximately 3408 GWh, which corresponds to 53.13% of the 6413.54 GWh consumed nationwide according to the Senplades (Secretaria Nacional de Planificación y Desarrollo, 2015). At the end of 2017, 41% of the country's industries are located in Guayas, housing 32,866 companies, followed by the province of Pichincha with 25,995 companies. This means that 27% of the industries are located in the rest of the country (El Telégrafo, 2018), the ones that provoke important modifications caused by the imbalance of ecosystems, diverse forms of contamination and other environmental problems. A way to counter this situation through energy optimization mechanisms is sought.
Manufacturing is one of the most important sectors for the economic development of a country because it contributes significant figures to the GDP, in the case of Ecuador it is estimated that by 2018 it will reach 17.3% of contributions to the GDP, according to a study of the magazine (Ekos, 2018), and according to INEC figures, 11% of employment in the country, generating value-added products with greater capacity of differentiation and lower cost.
Although, the excessive consumption of energy in the manufacturing industry of Ecuador is part of an irreparable accumulation of environmental problems in the country, the industrial processes necessary for the production of goods are not managed with the adequate and necessary norms to repair the damage. A 13% of CO2 emissions is caused by the industrial sector of the country.
The demand for energy comes from different economic sectors of the country; however, the industrial sector is an inexhaustible source of production of goods as large amounts of energy are required for the industrialization and production of goods and services. This is how industrial expansion becomes one of the main engines of energy growth. While in 2012, the industrial sector contributed 31% of the national energy demand, specifically in the Sierra and Oriente (East) regions, 85,034 kWh / year were consumed (CONELEC, 2013).
As a result, Ecuador's energy demand grew 2.74% in the period 1980-2006, more than the world average of 1.6% and more than the region average of 2%, according to the figures from the Ecuadorian Center for Environmental Law (CEDA, 2011).
Moreover, according to the same source, in 2008 a change in the country's energy matrix occurs, since in the past the three sources of energy were concentrated in petroleum, hydroelectricity in lower percentage and high biomass yield. The energy that has increased the most according to the energy matrix is petroleum: from 50% to 81%.
Regarding the country's energy demand, it increased by 71% from 2005 to 2015, when it consumed 94 million BOE (barrels of oil equivalent), with a 19% share of the industry (Ministerio Coordinador de Sectores Estratégicos, 2016).
A 33% of electricity consumption is concentrated in the food, beverage and tobacco sector, followed by the non-metallic minerals, metals and metal products sector with a 31% [8], two industrial fields with greater consumption of electrical energy. In fig. 1, total energy consumption levels are specified, according to economic activity.
Figure 1
Energy consumption in each branch of industry
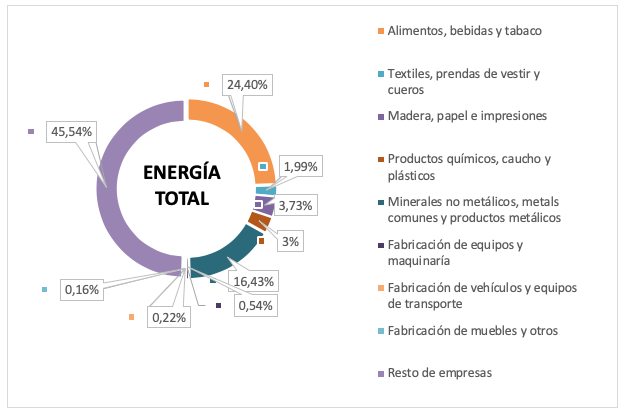
Source: (Ministerio Cordinador de Sectores Estratégicos, 2013)
The values recorded in fig. 1, were taken from the base year 2012, when the rest of the companies have a percentage of 49.54%, and refer to the companies or industries that are formed by less than 10 workers. Previously it was stated that the industry consumes large quantities of secondary sources for its industrial processes: diesel, electricity, in addition to liquefied petroleum gas, gasolines and fuel oil.
Human activities emit a series of gases, such is the case of carbon dioxide that prevents heat from leaving space, and causes excessive global warming. This process little by little destroys the balance of the ecosystem and the place where these masses inhabit. In Quito, for example, 5.1 million tons are emitted each year, including sectors such as transportation, industry, solid waste and commerce (El Comercio , 2014). And in 2006, 410.01 Mton of CO2 were reported in all sectors of the country, including energy in industrial processes and other sectors.
In 2012, the industrial processes sector generated 4,577.72 Gg of CO2 eq (Giga grams of carbon dioxide equivalent) from the minerals industry (Ministerio del Ambiente del Ecuador, 2016).
This research is exploratory, because it studies a problem that has previously been a topic of study both at an international and national level, based on the method of analysis that begins with the identification of each of the parts that characterize the reality of excessive energy consumption in the industry.
In order to analyze the future consumption of energy in the Ecuadorian industry and therefore the production of CO2 emissions, the research had several phases, in each of them different types of resources were used, at first we proceeded to collect and process information regarding the energy balance and economic evolution of the country, focused on the industrial sector according to the statistical bases of the Coordinating Ministry of Strategic Sectors, with the submitted National Energy Balances of 2013, 2014 and 2016.
In the second stage, historical series from 2005 to 2015 were analyzed, as well as consumption and energy indicators of the same period, and at the end of this stage, projections to 2040 were developed, for which historical growth rates and linear regressions were used directly to calculate the trend in each type of energy source.
The third stage includes the entry of collected information and all the projections of energy sources used in the Ecuadorian industry and the energy consumption by industrial sector till 2040 was modeled, based on the energy model of Arroyo and Bravo (Arroyo & Bravo, 2017), used in their article Future scenarios of CO2 emissions produced by the final energy consumption in Ecuador. As well as in the model used in Arroyo's doctoral thesis (Arroyo, 2019).
The main tool used in the research was the VENSIM Simulation and Analysis Model, since this software provides a simple and flexible way of constructing simulation models using system dynamics theory.
The "Business as Usual" scenario is exploratory, its main condition is to maintain the trends of consumption and production as historically have been handled, without making modifications that result in potential benefit or harm (Rosero Clavijo, 2017). The "Everything remains the same" scenario represents the growth of the country's emissions, if the productive and economic sectors behave in the same way as they have been in the past.
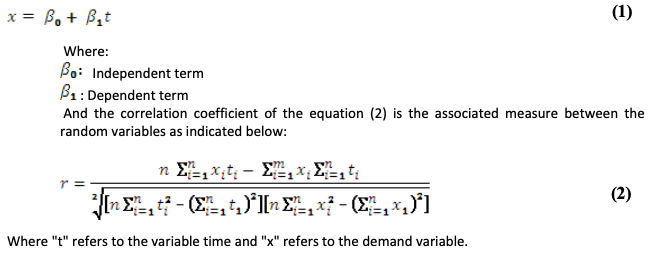
To elaborate the projections in each scenario, a linear regression has been used. Molina and Rodrigo, explain that a linear regression is a “relationship between two or more variables through a formal model that supposes to have a logical-mathematical expression that, apart from summarizing how this relationship is, will allow making predictions of the values that one of the two variables will take from the values of the other” (Molina & Rodrigo, 2010). According to the same source, one of the variables is considered as a predicting variable (t) and the other one is considered as a response variable (x) is represented by the equation (1):
On the other hand, the historical energy consumption of the Ecuadorian industry has increased a 64.65% in a period of 10 years, from 2005 to 2015, due to the growth of small and medium industries during these years. In fig. 2, this growth is observed.
Figure 2
Growth of energy consumption in the industrial sector
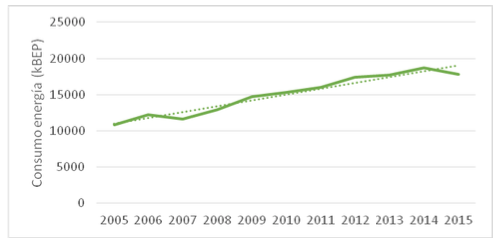
Energy consumption (kBEP)
Although, the consumption of energy is strictly necessary in the production of goods and services of the country, the increase of this resource is expected; however, in the period of one year 2014-2015, it drops 4.5%, being an encouraging panorama to create or optimize the use of energy in industrial processes. The projection till 2040 of the total energy consumption of the industry involves variables from all the sources that are used in it. The Coordinating Ministry of Strategic Sectors indicates in its report which are the sources of energy of the industry illustrated in the Table 1.
Table 1
Energy sources of the industrial sector
|
2014 |
2015 |
Var % 2015/2014 |
NATURAL GAS |
269 |
99 |
63,2 |
FIREWOOD |
324 |
331 |
2 |
CANE PRODUCTS |
1.767 |
2.302 |
30,3 |
TOTAL, PRIMARY |
2.360 |
2.732 |
15,7 |
ELECTRICITY |
5.399 |
5.517 |
2,2 |
LIQUEFIED GAS |
632 |
726 |
15 |
GASOLINES |
6 |
4 |
-38,3 |
KEROSENE/JET FUEL |
157 |
175 |
11,5 |
DIESEL OIL |
7.526 |
6.853 |
-8,9 |
FUEL OIL |
2.594 |
1.834 |
-29,3 |
TOTAL, SECONDARY |
16.313 |
15.108 |
-7,4 |
TOTAL |
18.673 |
17.840 |
-4,5 |
Source: (Ministerio Coordinador de Sectores Estratégicos, 2016)
A lot of effort has been made to have a sustainable country; however, the results are scarce, energy consumption in all economic sectors has increased, the industry is still the second field with the highest use of energy; the events that occurred cannot be denied either, if it were not for them, energy consumption would be increasingly enhanced.
The verification and compliance system of Ecuadorian energy policies and guidelines has not become efficient enough, for this reason and according to the INER (INER, 2016) the growth in this scenario for each type of energy source is specified in the Table 2 taken from Cristian Moya's report (Moya, 2017). These values were used in the elaboration of the energy model.
Table 2
Growth rate of the scenario 1
|
Natural Gas |
Fire-wood |
Cane Products |
Electricity |
Liquefied Gas |
Gasolines |
Jet Fuel |
Diesel Oil |
Fuel Oil |
Growth (%) |
1,6 |
0,5 |
0,6 |
4,1 |
3,5 |
0,6 |
1,6 |
3,6 |
0,1 |
Source: (Moya, 2017)
This scenario has been present throughout the whole research, due to the importance of comparing the growth of industrialized countries and their policies, in order to understand what we can do. According to historical data, the growth rates for different types of energy are represented in table 3.
Table 3
Growth rate of the scenario 2
|
Natural Gas |
Fire-wood |
Cane Products |
Electricity |
Liquefied Gas |
Gasolines |
Jet Fuel |
Diesel Oil |
Fuel Oil |
Growth (%) |
1,2 |
0 |
0,3 |
3 |
3 |
0,1 |
1 |
2 |
-0,1 |
Source: (Moya, 2017)
The International Energy Agency (IEA) mentions that energy consumption will rise by 30% worldwide by 2040. It also mentions that the energy sector will undergo profound changes with new production powers and meet the challenge of preventing GHG emissions grow exponentially, because according to the IEA the world is not prepared to comply with the Paris Agreement (El país, 2017).
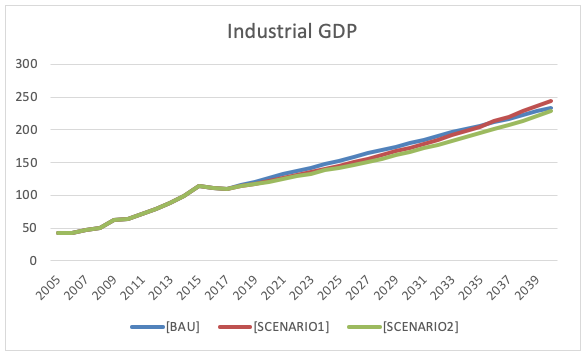
From the point of view of the industry, the concept of being efficient translates into being competitive within the market, since own energy consumption is one of the key factors of competitiveness between companies (Sevilleja, 2011). The industrial analysis is carried out taking into account the consumption of each subsector in the period 2005-2015. Said period has a stage that marks a difference, and according to the article published by the Economists Association of Pichincha (Colegio de Economistas, 2017), in 2007-2016 the Gross Domestic Product (GDP) of the sector grew 34%, below of international GDP growth of 38%. In fig. 3 and fig. 4, the model and projections of the Industrial GDP are observed.
Figure 3
Industrial GDP Projection Mode
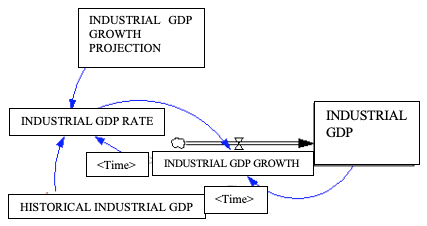
From the simulation carried out, the scenario of greatest growth is the scenario 1, in 2040 the economic growth is encouraging by 3.5%, based on energy policies focused on the industry through environmental reforms where Moreno's Government raises the self-generation of energy by the companies, reduction of tariffs, and a series of plans in favor of economic growth. The BAU scenario and the scenario 2 indicate the same growth trend.
Figure 4
Industrial GDP projection till 2040 (USD 2007)
Energy intensity is the main indicator used as a measure of energy efficiency, is the relationship between energy use and production, this correspondence should be decreasing regardless of the development of the Gross Domestic Product.
The manufacturing sector now accounts for almost 30% of global energy consumption. The demand for energy goods has skyrocketed, which has pushed energy prices to a much higher level. To be competitive internationally, the industry has to reduce the cost of energy by reducing its consumption rate per unit of production, and thus reduce the energy consumed in relation to the economic product (Montes, Ponce de León & Moreno, Carrasco, 2004). In developing countries, such as Ecuador, energy consumption and emissions are growing rapidly, and there is an urgent need for measures aimed at the efficient use of energy.
In this research, we intend to calculate the energy efficiency of Ecuador through the application of the equation (3) of the energy intensity of the country in the period 2005 - 2040 (See Fig. 5), the research is based on the data obtained from the Central Bank of Ecuador (Statistical Information - Bulletin of Annual National Accounts) for GDP values and energy consumption based on the information taken from the 2016 National Energy Balance (Base Year 2015) of the Coordinating Ministry of Strategic Sectors.

IE: Energy intensity of the country
CEkBEP: Energy consumption in KBEP (Kilo barrels of oil equivalent)
PIBt: Gross Domestic Product (Millions of dollars)
Figure 5
Projection of the Energy Intensity of the industrial sector
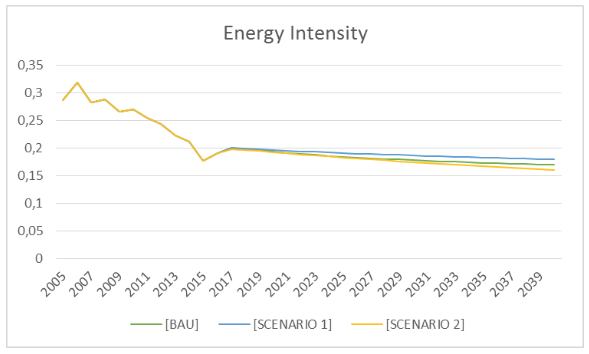
In the figure 5, a decrease in energy intensity is observed, providing an encouraging outlook till 2040, the scenario with the lowest index is the scenario 2, because in the main industrialized countries, a very sharp increase in the added value of manufacturing is obtained, as well due to their technological progress and optimization of industrial processes, i.e., according to a report by the Ministry of Electricity and Renewable Energy (MEER, 2014), they are producing the same amount of wealth consuming less energy, highlighting a great experience in the implementation of energy efficiency programs, in the case of Ecuador, the trend line is well above the industrialized countries, with a value that doubles the index of the developed countries such as the EU and the USA, which shows the poor verification system of compliance with regulations regarding EE in the Ecuadorian industries.
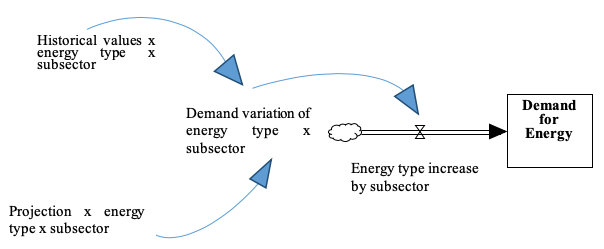
Based on the analysis of the three scenarios and using the aforementioned methodology, and by means of a system dynamics model, a projection till 2040 was made, based on the historical values by type of energy and by subsector of the industry. The energy model is specified in the fig. 6.
Figure 6
Energetic Model of the Ecuadorian Industry
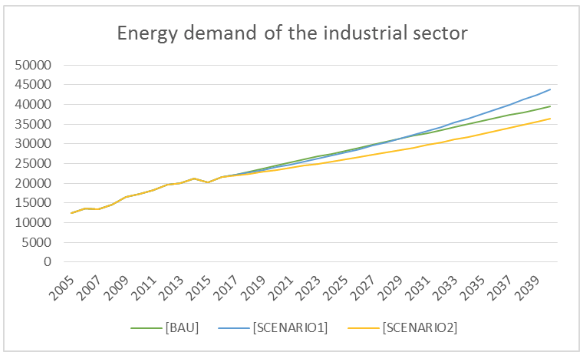
From the projections made, it is observed in the fig. 7 that in 2040, the Ecuadorian industry will increase its energy consumption by approximately 70% starting this year, consuming 43,857 kBEP in the scenario 1; this indicates the poor fulfillment of energy policies directed to the different subsectors of the industry, or lack of government support in the coming years, as well as excessive and inefficient energy consumption by the industries. Meanwhile in the BAU scenario and the scenario 2, the values are lower 39,546 kBEP and 36,449 kBEP respectively, but they follow the same trend. Although renewable energies are the way to a less polluted planet, Ecuador opens the way to hydropower with the aim of producing 90% by 2040; however, the dependence on fossil fuels will remain at least until 2020.
Figure 7
Projection of the total energy demand of the industrial sector (KBEP)
The reaction to this is to implement an Energy Management System; if it is properly implemented and actively used, it will allow companies to use their full potential for energy savings. Furthermore, energy audits offer a rational and cost-effective way to comply with legislation and identify savings in energy consumption by approximately 7%. However, within the companies that have opted for and implemented energy consumption saving strategies introduced by government institutions, there have been very few very few in the country, while the other industries have forgotten that one of the best allies is technology because it helps optimize industrial processes.
The analysis of the projections until 2040 for each subsector is given below. It should be noted that for this research purposes, the data of 2013 data has been taken and a relation or proportion has been developed for the following years. The table 4 shows the consumption of the three scenarios in 2015 and the projected consumption by 2040 in the different industrial subsectors of the country.
Table 4
Energy consumption of each industrial subsector
|
Scenarios |
|||||
2015 |
2040 |
|||||
INDUSTRIAL SUBSECTOR |
BAU |
ESC 1 |
ESC 2 |
BAU |
ESC 1 |
ESC 2 |
Food, beverages and tobacco |
8723,28 |
8723,28 |
8723,28 |
16794,19 |
16304,42 |
14374,15 |
Textiles, clothing and leather |
997,55 |
997,55 |
997,55 |
2118,08 |
2467,07 |
1943,10 |
Wood, paper and prints s |
1669,41 |
1669,41 |
1669,41 |
3133,19 |
4099,28 |
3264,28 |
Chemicals, plastic and rubber |
1893,58 |
1893,58 |
1893,58 |
4401,11 |
5344,38 |
4151,54 |
Non-metallic minerals, common metals and metallic products |
6329,47 |
6329,47 |
6329,47 |
11791,86 |
14082,32 |
11515,05 |
Manufacture of equipment and machinery |
284,50 |
284,50 |
284,50 |
627,03 |
770,16 |
592,85 |
Manufacture of vehicles and transport equipment |
154,74 |
154,74 |
154,74 |
350,15 |
414,51 |
315,94 |
Manufacture of furniture and others |
150,60 |
150,60 |
150,60 |
330,33 |
374,86 |
292,17 |
The energy model of the industry gives the guidelines to know if the emissions will grow or decrease according to the total consumption and the emission factors for each type of energy source. By means of these values, the corresponding calculation was made, where the emissions generated before 2040 would be generated by the diesel basically, increasing a 68.33% and generating 6730572 KTCO2, mainly due to the low involvement of clean energies in the industries.
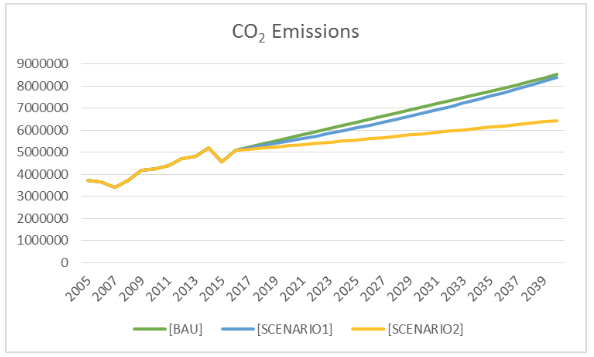
The BAU scenario maintains a growth rate of CO2emissions of 2.23% per year, because it is based on the increase in oil, meanwhile, the scenario 1 increases the emissions a 2.19% per year by 2040; and finally, the scenario 2: based on international policies, the growth is a 1.52% per year. The industrialized countries are totally committed to renewable energies. They also emphasize the optimization of industrial processes through the transformation of technologies. In the fig. 8, the growth of emissions caused by the Ecuadorian industry is observed.
Figure 8
Projection of CO2 emission caused by industry (KTCO2)
By increasing the participation of energies from natural sources, the production of CO2 emissions is significantly reduced, also taking into account the great hydroelectric potential which Ecuador currently has and mentioning several hydropower projects and other renewable sources. As well as the replacement of fossil fuels in industry, allowing friendly to the environment and at the same time efficient mechanisms to emerge.
This research analyzes the energy efficiency of industries by calculating energy intensity because it has a direct relationship between energy demand and industrial production, which has reduced 37.40% in recent years and in the near 25-year period, will follow the same trend, that is, the projection indicates a decrease of 1.49% per annum in the best case. However, the value of the energy intensity of the industrial sector of Ecuador is well above the indicators of industrialized countries due to its great experience in the development and implementation of energy efficiency plans and programs, being the scenario 2 the most encouraging one for the country, so more attention should be given to international policies and joining efforts with institutions around the world to mitigate environmental pollution and give the industries an opportunity to obtain better technological progress with some economic gains and become much more competitive.
The research analyzed historical energy consumption by type of source, and concluded that electricity and diesel are the main sources of energy for the industries; in order to project energy consumption in the Ecuadorian industry for the period 2005-2040, an integrated system dynamics model based on a Vensim software framework was developed; the projection till 2040 indicates that from 2025 there will be a considerable increase in energy, based on 3 scenarios, where the most convenient one is the scenario 2 and where energy policies must be elaborated and improved so they could allow a reduction in energy consumption. Due to this and taking into account the hydroelectric potential of Ecuador, we must bet on a cleaner energy where the energy mix has greater participation of hydropower and other renewable sources, projecting a direct involvement of 70% of hydropower by 2040. Meanwhile, the solution for diesel reduction is focused on a gradual withdrawal of the subsidy and its replacement with biodiesel or natural gas, depending on their use in the industries.
Another strategy to decrease these trend lines is the total implementation of the ISO 50001 standard by all companies in the country, since they are the ones that contribute most to achieve a reduction of approximately 6% in the scenario 2: energy policies, but they need funding, so the current government took a 70 million dollars loan from Japan to fund a project aimed at transforming the energy matrix, where it desires to increase the use of renewable energies such as geothermal and others.
On the other hand, when analyzing each industrial subsector, it is observed that in the following 25 years, the demand for electricity and diesel in all the industries will accelerate its consumption, but the primary energy will decrease totally, the BAU scenario has a 71,80% growth trend, which demonstrates the total dependence on fossil fuels during the next two decades, while the scenario of greatest growth in all industrial sectors is the scenario 1 with 92.66%, evidencing in this way that the intended plans and programs are not yet demanding and deep enough, so there is a need for the regulations focused on technological optimization, training and an improved compliance system of the companies. In addition, it is important to join efforts with foreign contacts to amplify projects that directly target energy efficiency.
Ecuador has maintained an energy mix based on sources of fossil origin, the increase in the consumption of fuel oil, liquefied gas and diesel has produced an increase from 2018 in CO2 emissions of a 79.39% in diesel; on the other, electricity has also contributed to the production of emissions, since in recent years, hydropower has been 49% and thermal energy, 47%. The increase in hydroenergy use in recent years plays a fundamental role in the mitigation of emissions, betting for the renewable energy sources that are important for the development of the industry, and although these technologies are not very well developed, it is expected that the hydroelectric power plants and the wind, solar and biomass energy projects of great capacity can have a greater participation in the future energy mix.
Arroyo, F. (2019). Análisis de escenarios de la demanda de energía en el Ecuador: Perspectivas políticas gubernamentales nacionales y tendencia mundial para reducción de emisiones de CO2. España: Trabajo tesis doctoral.
Arroyo, F., & Bravo, L. (2017). Escenarios futuros de emisiones de CO2 producidas por el consumo de energía final en el Ecuador. Energía Mecánica Innovación y futuro VI Edición, 1-9.
CEDA. (2011). Hacia una Matriz Energética Diversificada en Ecuador. Quito-Ecudor: Integraf.
Colegio de Economistas. (14 de Junio de 2017). Colegio de Economistas. Obtenido de Boletín 146: El desarrollo Industrial del Ecuador: http://colegiodeeconomistas.org.ec/noticias/boletin-146-el-desarrollo-industrial-del-ecuador/
CONELEC. (2013). PLAN MASTRO DE ELECTRIFICACIÓN 2013-2022: Aspectos de Sustentabilidad y sostenibilidad social y ambiental. Quito-Ecuador.
Ekos. (2018). Industria Manufacturera: Industria de mayor aporte al PIB. Revista EKOS, http://www.ekosnegocios.com/negocios/verArticuloContenido.aspx?idArt=10182.
El Comercio . (6 de Agosto de 2014). 5,1 millones de toneladas de CO2, en el año. pág. 1.
El país. (14 de Noviembre de 2017). Obtenido de El mundo consumirá un 30% más de energía en 2040 y se aleja de cumplir el Acuerdo de París: https://elpais.com/economia/2017/11/14/actualidad/1510661591_352717.html
El Telégrafo. (28 de Mayo de 2018). El 41% de las industrias del país se desarrolla en Guayas. El Telégrafo, págs. https://www.eltelegrafo.com.ec/noticias/economia/4/industrias-desarrollo-guayas-ecuador.
INEC. (2016). Módulo de Información Ambiental Económica en Empresas. Quito: http://www.ecuadorencifras.gob.ec/documentos/web-inec/Encuestas_Ambientales/EMPRESAS/Empresas_2016/PRIN_RESUL_MOD_AMB_EMP_2016.pdf.
INER. (2016). ESCENARIOS DE PROSPECTICA ENERGÉICA PARA ECUADOR A 2050. Quito: ISBN: 978-9942-8620-4-4.
MEER. (2014). Energy Intensity Assesment in Ecuador. Quito.
Ministerio Coordinador de Sectores Estratégicos. (2016). Balance Energético Nacional. Quito-Ecuador.
Ministerio Cordinador de Sectores Estratégicos. (2013). Balance Energético Nacional 2013. Quito-Ecuador.
Ministerio del Ambiente del Ecuador. (2016). Inventario Nacional de Gases de Efecto Invernadero del Ecuador. Quito-Ecuador: Serie Temporal 1994-2012.
Molina, G., & Rodrigo, M. F. (2010). El modelo de regresión lineal. Valencia.
Montes, Ponce de León, M., & Moreno, Carrasco, R. (2004). La Efeiciencia Energética en la Industria Española y las Energías Renovables. Economía Industrial, 143-163.
Moya, C. (2017). Obtención e interpretación de indicadores energéticos del desarrollo sostenible para el Ecuador. Ambato - Ecuador.
Rosero Clavijo, M. A. (2017). Analisis del servicio ecosistémico de producción de agua paa generación hidroeléctrica en la cuenca del Río Coca mediante el uso del software Invest como sustento para la gestión del recurso hídrico. Quito.
Secretaria Nacional de Planificación y Desarrollo. (2015). Agenda zonal Zona 2 Centro Norte. Quito: Senplades.
Sevilleja, D. (2011). Eficiencia Energética en el sector industrial. Leganés.
1. Faculty of Engineering, Physical Sciences and Mathematics, Central University of Ecuador; Master in Renewable Energy and Energy Sustainability. abelbelo@hotmail.com
2. Faculty of Engineering, Physical Sciences and Mathematics, Central University of Ecuador. Systems Engineering and Automatic Control, University of Valladolid; Master in Quality and Productivity Management. Master in Renewable Energy and Energy Sustainability. frarroyo@uce.edu.ec
3. Faculty of Engineering, Physical Sciences and Mathematics, Central University of Ecuador; Industrial Design Engineer. gracegb_17@hotmail.com