![]() ISSN 0798 1015
ISSN 0798 1015

![]() ISSN 0798 1015
ISSN 0798 1015
Vol. 40 (Issue 37) Year 2019. Page 12
HERRRERA, Jorge E. 1; MEDINA, Byron 2 & CAMARGO, Luis L. 3
Received: 22/06/2019 • Approved: 20/10/2019 • Published 28/10/2019
ABSTRACT: There is the possibility of measuring the reception power by means of a mobile device to determine the coverage area of a mobile cell, with experimental type research in the field is carried out the installation of an application on mobile devices. The methodology is made up of the following stages: measurement campaigns, equipment configuration, connectivity tests, data capture and processing, mathematical formulation of an empirical model and statistical analysis of results on outdoor environments. |
RESUMEN: Existe la posibilidad de medir la potencia de recepción por medio de un dispositivo móvil para determinar el área de cobertura de una celda móvil, con la investigación de tipo experimental en campo se realiza la instalación de una aplicación en los dispositivos móviles. La metodología la conforman las etapas de: campañas de medidas, configuración de equipos, pruebas de conectividad, captura y procesamiento de datos, formulación matemática de un modelo empírico y análisis estadísticos de resultados sobre entornos en exteriores. |

The characteristics of the power measurement levels (Salvadè, A., Guggiari P., & Lanini, 2004) can be determined by the execution of different measurement instruments and measurement typologies. The measurement devices for UMTS / HSPA signals are classified into three categories for the capture of the data: a) spectrum analyzer (where only the power spectrum is analyzed), b) test driver and c) instruments dedicated only to UMTS. For this purpose many monitoring stations require knowing the input power in the reception equipment from the results of the measurement (Bureau, 2011).
In the case of the measurement of the power reception level for UMTS (ETSI, 2017), the received signal strength indicator (RSSI) determines the received broadband power, including the thermal noise and the noise generated in the receiver within the band defined by the receiver's pulse shaping filter. The reference point for the measurement will be the antenna connector of the UE (user equipment).
The power level values received for a specific reception site can be obtained using prediction methods and computer models (Bureau, 2011). But it is important to mention the presence of many unknown factors that require measurements at the site itself in order to verify the data under real propagation conditions, because the radio waves have a deterministic behavior with random spatial and temporal dependencies superimposed on each other under line of sight (LOS) and under no line of sight (NLOS) conditions.
In the case of mobile applications, they have the ability to measure performance indicators of the network, such as power received, latency and performance. The data obtained is useful for researchers and operators, but unfortunately the accuracy of the applications is rarely verified, in this case (Lauridsen, Rodriguez, Mikkelsen, Gimenez, & Mogensen, 2016), they made the verification with an Android application measuring the power received from the LTE reference signal analyzing the root mean squared error and the cross correlation coefficient in different scenarios, including interior, urban and motorways.
According to (Neidhardt, Uzun, Bareth, & Kupper, 2013) there are Android crowdsourcing applications available to measure the performance of the network on the parameters of: received power, latency and performance. The data is useful for end users, researchers and mobile network operators, but unfortunately, the accuracy of the applications is rarely verified, in this case the research focused on verifying the NetMap application to measure the LTE and 3G reference signals received in different scenarios.
Also (Calderon, 2012) performs coverage estimation tests through a conduction test that presents a new form of calculation to obtain propagation losses in outdoor environments in the frequency of 1800 MHz, which allows providers to improve coverage services by controlling power levels by comparing the power obtained in the measurements, considering the losses caused by the buildings.
In the case of irregular conditions in outdoor environments (Ambroziak & Katulski, 2014) they propose three ways to model route losses. The investigated environment is characterized in the measurement campaigns and contrasts the investigation with the models: COST231 Walfisch-Ikegami, the modified model COST231 Walfisch-Ikegami tuned on the empirical data base where the tests were executed.
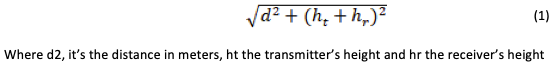
The measurements are made in an area of the city of Cúcuta using a mobile device as a measurement probe, the experiment is performed in an external environment in the presence of real physical conditions for mixed links LOS and NLOS, for this purpose point locations are established of measurements of the intensity of power on four mobile simultaneously located in a route every 50 meters in each of the four cardinal points, on an arbitrary cell with a transmitter located at a height of 22 meters; the distance through reflection on the ground with line of sight is given by (Report ITU-R SM2057, 2005) equation 1:
In mobile devices the application is installed and configured to perform the measurement taking into account in the capture the parameters of: cell identification (CID), radio controller number (RNC), technology type (TYPE), network (NET), Received Signal Strength Indicator (RSSI), date and time. In transmitter cells (3GPP, 2016), the power level is considered to range between 30.5dBm (1.14W) up to 43dBm (20W), according to the regulation defined by 3GPP and its technical specifications.
The measurements are made on foot with the mobile located at a height of 1.5 m above the floor level, the application is activated and the registration is verified on the RSSI level screen according to (Specification TS 25.225, 2016) of both the usable signal and noise.
The average power level received for HSPA is -90dBm on foot in outdoor environments from a user equipment (UE), with a cell edge location percentage of 90% and for nearby high interference limits and high load is -120dBm when the edge of the cell reaches 95% (ETSI, 2017), taking into account the technical recommendations starts the process of capturing the data. In practice the captured signal measurement is generally expressed as the power value of the pilot signal, (received signal code power) RSCP in case of 3G or RSRP (Reference Signal Received Power) in case of 4G (3GPP specification., 2008).
The weight determined by the intensity of the signal received is the average power outside the data channel, if the available measurements are not distributed equally, the estimated position moves closer to denser concentrations of points (Neidhardt et al., 2013). The above, enables the use of comparable RSSI, RSCP and RSRP values between the different radio access technologies (HSPA, LTE, etc.), independently of the definitions of reference signals.
The measurements are executed for 4 routes and 4 different mobile devices: North, South, East and West, the measurement sites should be selected so that there are no objects that produce reflections or are the least possible in a radius equivalent to 10 times the wavelength (10λ) (Bureau, 2011), to obtain a confidence interval of 3 dB around the real mean value.
It is complex to confine the space due to the changes that occur in real time, however, according to the recommendation (Bureau, 2011) the receiver of measurement must have inherent stability with respect to gain, frequency, bandwidth and attenuation in order of avoiding the masking of weak signals.
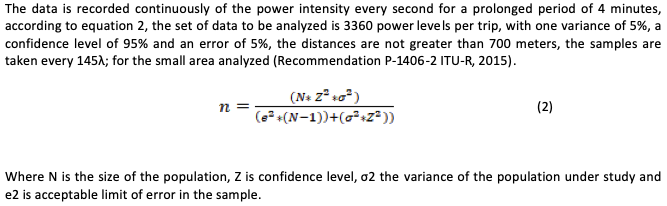
Recommendation (Bureau, 2011) states that, except where there are limitations due to the noise level of the receiver, atmospheric noise or external interference, the accuracy that can be expected in field strength measurements is less than ± 3dB for frequencies above 30MHz , for the above, a number of 240 samples is obtained to ensure a certain degree of reliability with an average power level, processing and selecting a standard deviation (σ), the variance (σ2) and standard error of each of the measurement points.
The result of a single measurement can coincide with the minimum or maximum reflection value, being also influenced by the height of the receiving antenna, the season of the year, the climatology, the vegetation, the humidity of the surroundings, the equipment of measurement and capture of the data, which leads to errors (Bureau, 2011), in order to preserve the precision of the measurements, they are executed continuously by route in normal environmental conditions and in similar time periods, to perform the appropriate statistical processing of the same.
In the analysis of cellular networks with dynamic allocation of channels it is possible to determine the behavior of a cell as a whole (Bureau, 2011), calculating the average value of the power that the mobile receives depending on the amount of resources used in the cell, as an example is shown in table 1 of the statistical processing specifically for the north route of the mobile 1.
Table 1
Obtaining the processing statistics
for the north route of the mobile 1
North route |
Distance (m) |
Average power (mobile 1) |
Deviation (mobile 1) |
Variance (mobile 1) |
Min. Power (mobile 1) |
Max. Power (mobile 1) |
Median (mobile 1) |
Standard error (mobile 1) |
Point 0 |
22 |
-59.2 |
1.99 |
3.30 |
-67 |
-55 |
-61 |
0.146 |
Point 1 |
55 |
-62.9 |
4.57 |
8.94 |
-67 |
-55 |
-61 |
0.369 |
Point 2 |
103 |
-67.7 |
2.90 |
11.25 |
-67 |
-55 |
-61 |
0.204 |
Point 3 |
152 |
-67.2 |
2.52 |
7.33 |
-69 |
-57 |
-63 |
0.191 |
Point 4 |
201 |
-59.1 |
2.04 |
3.06 |
-63 |
-51 |
-57 |
0.153 |
Point 5 |
251 |
-60.1 |
4.09 |
16.82 |
-75 |
-55 |
-63 |
0.323 |
Point 6 |
301 |
-61.2 |
3.69 |
15.32 |
-75 |
-57 |
-65 |
0.303 |
Point 7 |
351 |
-66.7 |
3.11 |
12.77 |
-67 |
-59 |
-63 |
0.369 |
Point 8 |
401 |
-63.3 |
3.82 |
19.04 |
-67 |
-55 |
-61 |
0.294 |
Point 9 |
451 |
-64.6 |
2.67 |
6.02 |
-73 |
-57 |
-65 |
0.210 |
Point 10 |
501 |
-71.3 |
2.81 |
8.92 |
-75 |
-61 |
-69 |
0.231 |
Point 11 |
550 |
-74.2 |
2.84 |
9.32 |
-74 |
-59 |
-67 |
0.242 |
Point 12 |
600 |
-77.1 |
3.04 |
9.92 |
-67 |
-57 |
-62 |
0.228 |
Point 13 |
651 |
-74.3 |
3.74 |
17.67 |
-70 |
-56 |
-63 |
0.286 |
Point 14 |
700 |
-78.5 |
3.07 |
10.59 |
-74 |
-59 |
-67 |
0.247 |
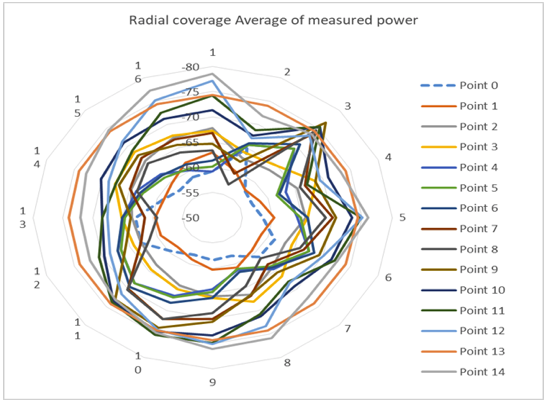
The data stored independently in each fixed point of measurement is converted into a database to which the filtering of the average power captured in each point is made, to obtain the basic statistics previously stated; the information allows to graph the approximate radial coverage of the average of measured powers as seen in the figure 1.
Figure 1
Radial coverage of power levels
For the case study only general information about the environment is available, therefore, an estimate of the path losses can be made from measurements made in similar situations [12], such estimation must be of a statistical nature.
Since there are rapid fading due to the multi-path that occurs in the scale of a few wavelengths, it can be represented by the Rayleigh or Rice distribution; in the case of a typical channel in a narrowband cellular mobile service operating in an urban environment with a high rate of traffic without direct visibility in the transmitter; if it is the case of general fading, the signal can be modeled by the Nakagami-Rice distribution (Recommendation P-1057-4, 2007).
It is possible to determine the slow fade by measuring the distribution of the signal intensity, so that the variability will be much greater in a large area than in a small area, therefore, the standard deviation (σ) for the path of a confined length can be estimated for flat urban areas with the equation 3 (Recommendation P-1406-2 ITU-R, 2015):
For the case study, only general information about the environment is available, therefore, an estimate.
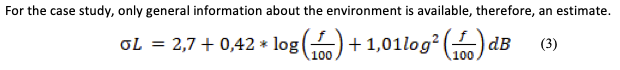
The final objective of any empirical propagation model is to predict the power intensity level in a statistical way for the estimated coverage area, considering the most significant physical factors, when making a global consolidation of all the measures according to the area of influence. The research takes as a reference example the powers obtained only for the eastern route taken by 4 mobiles simultaneously, as shown in Table 2.
Table 2
Power measurements Eastern route
Average power East (dBm) |
Distance (m)
|
Total average east (dBm) |
Mobile average 1 (dBm)
|
Mobile average 2 (dBm)
|
Mobile average 3 (dBm)
|
Mobile average 4 (dBm) |
Point 0 |
6.05 |
-57.61 |
-57.77 |
-61.13 |
-57.00 |
-54.54 |
Point 1 |
54.6260011 |
-57.70 |
-60.54 |
-64.39 |
-53.22 |
-52.66 |
Point 2 |
102.391406 |
-63.43 |
-67.72 |
-60.71 |
-57.71 |
-67.57 |
Point 3 |
151.604749 |
-64.70 |
-64.37 |
-54.03 |
-75.25 |
-65.14 |
Point 4 |
201.206362 |
-69.33 |
-69.90 |
-74.54 |
-70.30 |
-62.57 |
Point 5 |
250.966133 |
-69.37 |
-74.49 |
-84.48 |
-61.44 |
-57.06 |
Point 6 |
300.805585 |
-70.63 |
-71.59 |
-78.77 |
-56.27 |
-75.87 |
Point 7 |
350.690747 |
-73.49 |
-68.56 |
-71.90 |
-69.46 |
-84.04 |
Point 8 |
400.604543 |
-74.51 |
-78.02 |
-70.76 |
-65.99 |
-83.29 |
Point 9 |
450.537457 |
-76.69 |
-75.43 |
-75.50 |
-74.89 |
-80.94 |
Point 10 |
500.483766 |
-75.43 |
-72.96 |
-68.42 |
-83.26 |
-77.07 |
Point 11 |
550.439824 |
-75.45 |
-73.29 |
-64.93 |
-87.40 |
-76.18 |
Point 12 |
600.403198 |
-73.02 |
-76.73 |
-73.13 |
-70.44 |
-71.79 |
Point 13 |
650.372201 |
-74.16 |
-74.19 |
-71.96 |
-79.08 |
-71.39 |
Point 14 |
700.345629 |
-73.44 |
-73.13 |
-66.68 |
-85.33 |
-68.63 |
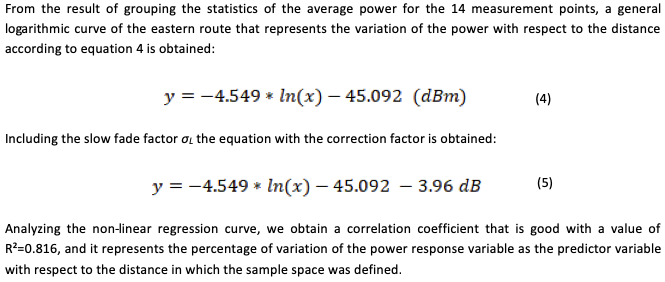
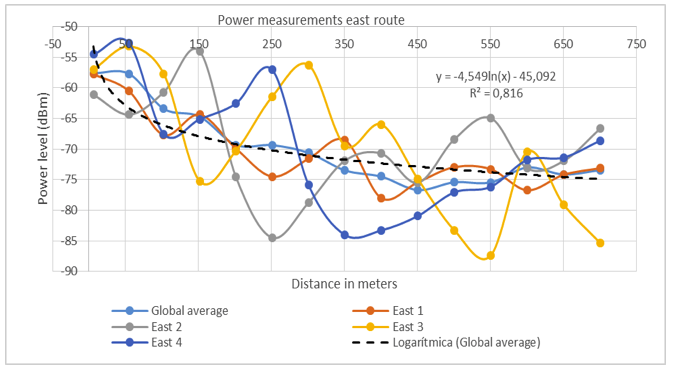
Figure 2 shows the average power obtained by each of the mobile phones and the global average with which the respective curve of equation 4 was obtained.
Figure 2
Average non-linear regression
curve for the eastern route
By performing the tests of the distance values in equation 5, standard deviation values ranging between 4 dB and 6 dB are observed for each of the data of the respective mobiles, and if it is compared with the value of the standard deviation obtained in Equation 3 for the frequency of 850 MHz the value oscillates around 3.96dB. In the same way, the experiment was carried out for the other routes and the expressions represented in equations 6, 7 and 8 were obtained:
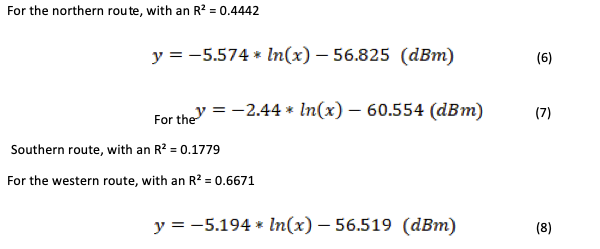
It is appreciated that the interpretation of R squared is the proportion of the power variance that is attributed to the distance and that reflects a direct dependence with the received power in a very regular way. However, its level of adjustment varies significantly and may be deficient; according to the data obtained for the aforementioned equations the confidence level of 44.42%, 17.79% and 66.71% respectively. In these cases, the sample must be taken or, failing that, look for an adjustment that at least indicates a confidence level above 90%.
Finally it is executed a global comparison between: the measured data, the obtained analytical representation, the propagation models Okumura-Hata, COST 231-Hata and COST 231 Walfisch-Ikegami.
The loss model defines expressions for four different environments, dense urban and medium, suburban and rural. The general equation (9) is used for calculation of losses, for urban environment is calculated with (Alonso, Bordón L., & Montejo, 2013):
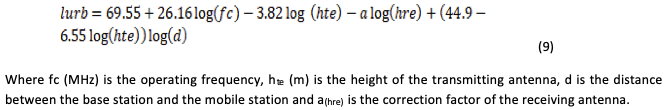
The calculation of this factor depends on the density of the environment, for which it is calculated with equation (10):

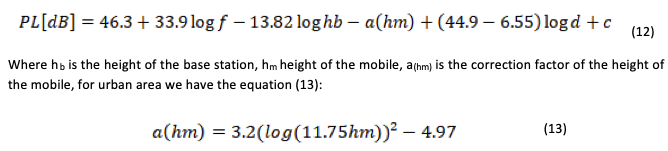
For the study case, we have an average urban environment and it is calculated with equation (11):

It is an extension of the Okumura-Hata model (Elsheikh, Islam, Habaebi, Ismail, & Zyoud, 2017) uses equation 12 to represent the model's losses.
The resulting basic losses are represented by equation (12):
This model is a combination of the models of J. Walfisch and F. Ikegami (Kumar, P., Patil, B., & Ram, 2015), developed mainly to operate in the urban area, in situation of LOS between the transmitter and receiver the basic losses (Vera Rivera et al., 2015), are represented by the equation (14):
![]()
The calculations were checked for low transmitter power of 30.5 dBm, transmitting antenna gain of 15dBi and receiver of 3 dBi, as shown in Table 3.
Table 3
Comparison of powers received for East route according to the models
Average power East (dBm) |
Distance (m) |
Okumura-Hata |
COST 231 Hata |
COST231 -Wal-Ikega. |
Losses in free space |
Measured Avera |
Estimation model obtained |
Calculated with correction factor |
Point 0 |
6.05 |
-16.02 |
-113.13 |
-85.30 |
-70.58 |
-57.61 |
-77.71 |
-81.67 |
Point 1 |
54.626 |
-91.85 |
-116.39 |
-87.64 |
-72.39 |
-57.70 |
-79.29 |
-83.25 |
Point 2 |
102.3914 |
-99.27 |
-121.24 |
-91.13 |
-75.07 |
-63.43 |
-81.64 |
-85.60 |
Point 3 |
151.6047 |
-105.59 |
-125.37 |
-94.11 |
-77.36 |
-64.70 |
-83.64 |
-87.60 |
Point 4 |
201.2064 |
-115.21 |
-131.66 |
-98.64 |
-80.84 |
-69.33 |
-86.69 |
-90.65 |
Point 5 |
250.9661 |
-123.02 |
-136.77 |
-102.32 |
-83.67 |
-69.37 |
-89.16 |
-93.12 |
Point 6 |
300.8056 |
-129.18 |
-140.79 |
-105.21 |
-85.90 |
-70.63 |
-91.11 |
-95.07 |
Point 7 |
350.6907 |
-134.17 |
-144.05 |
-107.56 |
-87.71 |
-73.49 |
-92.69 |
-96.65 |
Point 8 |
400.6045 |
-138.34 |
-146.78 |
-109.53 |
-89.22 |
-74.51 |
-94.01 |
-97.97 |
Point 9 |
450.5375 |
-141.91 |
-149.12 |
-111.21 |
-90.51 |
-76.69 |
-95.15 |
-99.11 |
Point 10 |
500.4838 |
-145.03 |
-151.16 |
-112.68 |
-91.65 |
-75.43 |
-96.14 |
-100.10 |
Point 11 |
550.4398 |
-147.80 |
-152.97 |
-113.98 |
-92.65 |
-75.45 |
-97.01 |
-100.97 |
Point 12 |
600.4032 |
-150.29 |
-154.60 |
-115.16 |
-93.55 |
-73.02 |
-97.80 |
-101.76 |
Point 13 |
650.3722 |
-152.55 |
-156.07 |
-116.22 |
-94.37 |
-74.16 |
-98.52 |
-102.48 |
Point 14 |
700.3456 |
-154.61 |
-157.42 |
-117.19 |
-95.11 |
-73.44 |
-99.17 |
-103.13 |
According to Table 3, the COST 231-Walfisch-Ikegami, Okumura-Hata and Cost231-Hata models do not represent the best conditions in theoretical prediction terms, but the estimation model obtained is the one that best fits the real external conditions of a mixed environment of LOS / NLOS, likewise when the correction factor is included, the RSSI level is more realistic and the power levels do not exceed the threshold of the edge of the cell and the link is maintained.
In the field investigation it can be observed that power measurements with mobile applications allow to predict in an experimental way the power levels for coverage tests in a practical way, but it is difficult to measure the thermal noise, the carrier noise ratio and other parameters that if they have other more precise laboratory instruments, however, these tools are an approximation of the measurements according to the technical specifications of the spectrum manual of the International Telecommunication Union.
It was observed that, due to the effect of objects and obstacles each time the mobile moves away from the transmitter, possible power outages occur under LOS/NLOS conditions, such received power fluctuations generate a standard deviation obtained from the statistics and make it possible to check that the values range between 1.09 and 4.09; and when purchased with the result of equation 3, this can be used as a predictor of slow fading in the estimation of urban areas when included in the proposed semi-empirical model.
In order to maintain the maximum load levels the RF signal within a limit of -100dBm, it was perceived that distance close to which the handover is presented is around 700 meters for the selected cell, which is why the measurements were confined to that distance for all paths so that an average power level between -76 dBm and -99 dBm can be maintained.
The probability of success of the proposed empirical model allows the comparison of four simultaneous measurements at each point to consider references of power with similar averages, however, it is preferable to increase the number of measurement points and estimate the locations where there are changes in mixed terrestrial paths (NLOS/LOS) to reduce prediction errors, it is also essential to include adjustment parameters such as: the height of the receiver, the height of the transmitting station, shielding effects, angle corrections over terrain obstacles, the variability of the locations in the measurements, tropospheric dispersion, among others, to achieve a more accurate loss estimation model.
When comparing the loss estimation model obtained according to table 3, power values are presented with a better fit and close to the measurements made in the field. If the correction factor is included, it is more precise because slow fading is included; the opposite situation occurs with reference models where the power loss data are very high and oscillate between 10% and 30% above the value of the measured power.
Finally, a thorough analysis and interpretation of the correlation coefficients should be performed because the level of certainty of their value depends on the number of measurements and the environmental conditions, which can generate inaccuracies in the adjustment and observation of the statisticians.
3GPP, specification T. 25. 22. (2016). LTE; Evolved Universal Terrestrial Radio Access (E-UTRA); Physical layer; Measurements (Release 13). 3rd Generation Partnership Project TS 136 214, 13.0.0, 0–15.
3GPP specification., 36214-CR0006. (2008). 36214_CR0006_(Rel-8)_R1-082608. http://www.3gpp.org/DynaReport/36214-CRs.htm.
Alonso, R., Bordón L., R., & Montejo, S. (2013). Estudio comparativo de los modelos de propagación de canal inalámbrico. Retrieved from http://scielo.sld.cu/pdf/eac/v34n1/eac02113.pdf
Ambroziak, S. J., & Katulski, R. J. (2014). Path loss modelling in the untypical outdoor propagation environments. 2014 31th URSI General Assembly and Scientific Symposium, URSI GASS 2014, 3–6. https://doi.org/10.1109/URSIGASS.2014.6929655
Bureau, R. (2011). HANDBOOK Spectrum Monitoring. International Telecommunication Union (ITU), 168.
Calderon, J. (2012). Estimación de comunicaciones móviles 2G / 3G en interiores a partir de medidas drive test.
Elsheikh, E. A. A., Islam, M. R., Habaebi, M. H., Ismail, A. F., & Zyoud, A. (2017). Dust Storm Attenuation Modeling Based on Measurements in Sudan. IEEE Transactions on Antennas and Propagation, 65(8), 4200–4208. https://doi.org/10.1109/TAP.2017.2715369
ETSI, 3GPP TS 25.215 version 14.0.0 Release. (2017). Universal Mobile Telecommunications System (UMTS). Communication Systems for the Mobile Information Society, 0, 121–215. https://doi.org/10.1002/9780470033210.ch3
Kumar, P., Patil, B., & Ram, S. (2015). Selection of Radio Propagation Model for Long Term Evolution ( LTE ) Network. International Journal of Engineering Research and General Science, 3(1), 373–379. Retrieved from www.ijergs.org
Lauridsen, M., Rodriguez, I., Mikkelsen, L. M., Gimenez, L. C., & Mogensen, P. (2016). Verification of 3G and 4G received power measurements in a crowdsourcing Android app. IEEE Wireless Communications and Networking Conference, WCNC, 2016-Septe(Wcnc), 0–5. https://doi.org/10.1109/WCNC.2016.7564930
Neidhardt, E., Uzun, A., Bareth, U., & Kupper, A. (2013). Estimating locations and coverage areas of mobile network cells based on crowdsourced data. Proceedings of 2013 6th Joint IFIP Wireless and Mobile Networking Conference, WMNC 2013. https://doi.org/10.1109/WMNC.2013.6549010
Recommendation P-1057-4, I. (2007). Anexo 1 Distribuciones de probabilidad para establecer modelos de la propagación de las ondas radioeléctricas 1, 4, 1–18.
Recommendation P-1406-2 ITU-R. (2015). RECOMMENDATION P.1406-2 Propagation effects relating to terrestrial land mobile and broadcasting services in the VHF and UHF bands. Electronic Publication, P-series. Retrieved from https://www.itu.int/rec/R-REC-P.1406-2-201507-I/en
Report ITU-R SM2057, 2057. (2005). Studies related to the impact of devices using ultra-wideband technology on radiocommunication services. R-REP-SM.2057-2005-PDF-E.
Salvadè, A., Guggiari P., & Lanini, M. (2004). Basis for a UMTS measurement recommendation. SUPSI–DTI Alta Frequenza Phone.
Specification TS 25.225, 3GPP. (2016). Measurement Ranges and Mappings. Http://Www.3gpp.Org/Specifications/, 16, http://www.3gpp.org/specifications/.
Vera Rivera, Á., Núñez Unda, A., Ramos, B., Macías, E., Suárez, Á., & Gómez, J. (2015). Lee Microcell Propagation Model: A Complex Case Empirical Study, 14(1), 33–42.
1. Ph.D. in sciences, Magister in electronics, Professor, Engineering Department. Universidad de Pamplona, Pamplona- Norte de Santander -Colombia. E-mail: jherrera@unipamplona.edu.co
2. Ph.D. in sciences, Magister in electronics, Professor, Engineering Department. Universidad Francisco de Paula Santander, Cúcuta – Norte de Santander-Colombia. E-mail: byronmedina@ufps.edu.co
3. Ph.D. in sciences, Magister in electronics, Professor, Engineering Department. Universidad de Magdalena, Santa Marta – Magdalena -Colombia. E-mail: lcamargoa@unimagdalena.edu.co