![]() ISSN 0798 1015
ISSN 0798 1015

![]() ISSN 0798 1015
ISSN 0798 1015
Vol. 41 (Issue 05) Year 2020. Page 24
GARCÍA-RAMÍREZ, Yasmany D. 1; DUQUE, Edwin P. 2; ROJAS-ASUERO, Henrry V. 3; ROMÁN, Rolando J. 4 & ÍÑIGUEZ, Cristian A. 5
Received: 05/11/2019 • Approved:31/01/2020 • Published 20/02/2020
ABSTRACT: This study investigates the position and speed errors of two models of a smartphone brand and their relationship with variables that can block or reflect GPS signal in urban environments. The Brand Samsung, models Galaxy S6 and A5, were used in two experiments: static and dynamic. Results suggest that location and speed errors are related to the day of the week, smartphone device, the smartphone application, and location technology. This study extends previous research by offering new clues about errors of smartphones in urban environments. |
RESUMEN: Este estudio investiga los errores de posición y velocidad de dos modelos de una marca de teléfonos inteligentes y su relación con variables que pueden bloquear o reflejar la señal de GPS en entornos urbanos. Los modelos Galaxy S6 y A5 de la marca Samsung se usaron en dos experimentos: estático y dinámico. Los resultados sugieren que éstos errores están relacionados con el día de la semana, el teléfono inteligente, la aplicación y la tecnología de ubicación. Este estudio ofrece nuevas pistas sobre los errores de los teléfonos inteligentes en entornos urbanos. |

Traditionally in transportation, loop detectors were the most widely employed technique for traffic volume detection (Steenbruggen, Borzacchiello, Nijkamp, & Scholten, 2013). Limitations of this fixed equipment are well known (Jiang & Li, 2001), that may be overcome using smartphones. Smartphones have several sensors such as GPS, Wi-Fi, accelerometer, digital compass, gyroscope, microphone, and camera (Lane et al., 2010; Miluzzo et al., 2008; Thiagarajan, Ravindranath, Lacurts, & Eriksson, 2009). Are employed each day for several activities (Jones, Marzen, & Chappelka, 2015), wich represents a priceless opportunity to collect human behavior and population daily patterns (Lane et al., 2010; Miluzzo et al., 2008; Steenbruggen et al., 2013; Thiagarajan et al., 2009); without the need for intrusive data collection devices (Garnett & Stewart, 2014).
Whereas since 2007, the number of smartphones in use has climbed to over 1 billion worldwide (Jones et al., 2015), these devices revolutionized transportation (Lane et al., 2010). Are used for several purposes: traffic management (Steenbruggen et al., 2013; Tao, Manolopoulos, Rodriguez, & Rusu, 2012; Thiagarajan et al., 2009), traffic monitoring (Bar-Gera, 2007; Beyeler & Pheanis, 2012; Herrera et al., 2010; Steenbruggen et al., 2013; Work & Bayen, 2008), travel time estimation (Wunnava et al., 2007), pedestrian movements (Zhu, Li, & Chen, 2013), traffic crash location (Building, Green, & Agent, 2004), detection of potholes, bumps, braking, and honking (Mohan, Padmanabhan, & Ramjee, 2008). Despite this whole range of applications in transportation, the scientific community is concerned about data privacy (Steenbruggen et al., 2013) and the accuracy of these devices (Khadka, 2015; Lallie & Benford, 2011; Steenbruggen et al., 2013). This last issue is a complex one, especially in “urban canyons” where tall buildings or narrow streets can block direct line-of-sight (LOS) satellite signals (Gallagher, Li, Kealy, & Dempster, 2009; Jones et al., 2015; Lachapelle, Kuusniemi, Dao, Macgougan, & Cannon, 2004; Ma, 2003; MacGougan et al., 2002; Modsching, Kramer, & ten Hagen, 2006; Thiagarajan et al., 2009; Wang, Groves, & Ziebart, 2015). When GPS signals are blocked, called non-line-of-sight (NLOS) signals (Wang et al., 2015), they may be reflected by buildings or vehicles, causing a degraded position solution called multipath signal (Lachapelle et al., 2004; MacGougan et al., 2002). This leads to an inaccurate location. In the field of transportation a wrong information can cause wasted resources or put at risk the smartphone users and those around them.
For a wide range of practical measurements, accurate speed and position are needed, such as reducing traffic delays and congestion (Bar-Gera, 2007; Thiagarajan et al., 2009), which is the principal source of inefficiency, wasted fuel, and increased commuter time which causes peoples´ frustration (Thiagarajan et al., 2009), heart disease, stress, among others related. Smartphones are located using Global Position System (GPS). The most popular Global Position System (GPS) is the Global Navigation Satellite System (GNSS) (Gallagher et al., 2009; Watzdorf & Michahelles, 2010). This system assists GPS receivers find any location in almost any place in the world. GPS receivers work well in clear weather and precipitation-free, clear sky, and no obstructions such as tall buildings, tall trees (Jones et al., 2015; Ma, 2003). Therefore, in urban areas, for GPS receivers is more complicated to get accurate position due to limited satellite visibility (Zandbergen, 2009). This limitation has led manufacturers to develop better devices and better location correction processes. Nowadays, many smartphones employ Assisted GPS (A-GPS) to speed up the process of receiving information from GPS satellites (Zandbergen, 2009). GPS receivers in smartphones use four or more satellites to calculate position using trilateration (Kuseler & Lami, 2012). Also, many GPS systems employ the location data of cellular network towers for acquiring the GPS receiver position (Jones et al., 2015). This system is based on trilateration (Khadka, 2015), and is usually limited to urban areas because of high coverage of cellular network towers. Wi-Fi positioning technique has also been used to determine locations through terrestrial-based Wi-Fi access points (Zandbergen, 2009), which are becoming more popular among researchers (Khadka, 2015), especially in urban places due to its coverage. However, Wi-Fi positioning error varies among cities (Gallagher et al., 2009; Zandbergen, 2009, 2012). Relying on Wi-Fi signals, two positioning techniques have been developed (signal propagation model and trilateration) (Gallagher et al., 2009).
Today, three location technologies: Assisted GPS (A-GPS), Wi-Fi and cellular network positioning -alone or combined are used in smartphones, helping to get the best location accuracy. Thus, several studies have been conducted on position of smartphones and tablets, with different results among them, for example position errors were up to 3000 m in urban and rural areas (Khadka, 2015). Also, in indoor places, error using A-GPS was between 8.3 m (Zandbergen, 2009) and 133.78 m (Jones et al., 2015), while errors of devices using Wi-Fi was between 2.67 m (Gallagher et al., 2009) and 962 m (Zandbergen, 2009) and using cellular trilateration was between 129 m (Watzdorf & Michahelles, 2010) and 655 m (Watzdorf & Michahelles, 2010). On the other hand, in urban or outdoor places, the error was up to 500 m (Khadka, 2015). Those values are referential, because of several scenarios and devices that researchers used. Additional, smartphones were used for estimate speed. Speed error was between 3.4 km/h (Mohan et al., 2008) and 8.0 km/h (Herrera et al., 2010).
Base on above, more research is needed, especially in the accuracy that these technological devices can offer, since even the same equipment can give ranged results at different times or places, or with a different type of location technology. Furthermore, most of these studies have been focused on the error values; while relatively little research on variables that can cause those errors, has been conducted.
In this context, the purpose of this article(study) is to investigate the position and speed errors of two smartphones models and their relationship with variables that can block or reflect GPS signals (such as building and trees) Tests under static and dynamic conditions were conducted outdoors in an urban area in Loja (Ecuador). Loja is a medium "typical" city in Latinamerica, with a historic downtown, medium buildings (from 1 to 15 floors), and small streets, that are enough to create urban canyons. Also, this city is located in the Andean region, where the mountains can block or reflect GPS signals The first experiment included position data from two smartphones and an accurate benchmark. Then, the second experiment compared the position and speed from the same smartphones with a GPS receiver called Video VBOX Lite. Position and speed errors were calculated based on that data, and their relationships with variables that can block or reflect GPS signal were analyzed. This study extends previous research by offering new clues about errors of smartphones in urban environments.
The rest of the article is organized as follows. Section 2 gives an overview of both experiments detailing materials and methods used in this research. Next sections describe the static and dynamic tests. Also, in those sections will be analyzed location and speed errors from smartphones. Finally, the main conclusions, obtained from the experiments, are presented in section 5.
The outline of the two experiments is described.
In the first place, the Samsung Galaxy S6 and Samsung Galaxy A5 were selected, because it is an affordable brand, and in this brand, S6 was considered the new generation (better options and features) and A5 was the "old" technology (basic options and features). These devices (S6 and A5), that employs the Android operating system, have three location technologies: A-GPS, Wi-Fi, and cellular. Samsung Galaxy smartphones were also employed by other researchers, for instance: 3 (Jones et al., 2015), S3 (Wang et al., 2015), S4 (Jones et al., 2015; Khadka, 2015), and S5 (Humphreys, Murrian, Van Diggelen, Podshivalov, & Pesyna, 2016).
Likewise, for record position and speed of the smartphones in both experiments, the GPSLogger and GPSSpeed applications were selected. These are simple and free applications that display the device’s current latitude and longitude, and instantaneous speed.
Also, in the dynamic experiment, the Video VBOX Lite was used. It has an accuracy of 0.05% for distance traveled and 0.2 km/h for speeds; also, it receives information every 0.1 s from 8 satellites. This device in other studies, related to vehicle speed, was already used (García-Ramírez, 2014). Devices can obtain position and instantaneous velocity readings with a high accuracy, which can be used in traffic (Herrera et al., 2010).
Weather conditions such as sky conditions, temperature, relative humidity, and barometric pressure, did not have any significant impact on the relative accuracy of GPS devices (Garnett & Stewart, 2014), in the present research, collecting data process was performed in clear sky weather condition so as not to include too many variables to analyze.
In the first experiment, as a reference, an accurate benchmark was used. Benchmark at 9558918.616 m N, 699976.824 m E is located in the WGS84 coordinate system. Geographic Military Institute from Ecuador gives the benchmark location. This point locates in an open area in “Universidad Técnica Particular de Loja” (UTPL) Campus for its Wi-Fi connection coverage.
In data collection, three location modes: GPS, Wi-Fi, and cellular location technology; with both smartphones and both applications, were used independently. In March 2017, from Monday to Saturday data were collected, during mornings and between 09:00 and 12:00. This time was selected since other study found no significant impact on relative accuracy in data collection from 08:00 and 13:00 (Garnett & Stewart, 2014).
Smartphones were placed horizontally on the benchmark and collected every 1-2 second for 20 minutes. By other researchers, this data collection time was also used (Garnett & Stewart, 2014; Zandbergen, 2009). Errors between the benchmark and every collected data were calculated using Euclidian distance equation, which other researchers also used (Garnett & Stewart, 2014; Zandbergen, 2012).
After data collection, errors between days and locations modes were analyzed to draw the main conclusions. Several position errors minimum, maximum, average error and Root Mean Square Error (RMSE) were calculated. In the next test, results of this experiment were used.
Two routes from Loja’s city downtown were selected (See Figure 1). The main route aimed to analyze the relationship between errors and variables that can affect those errors, and the second route of validation helped to validate the relations found in the main route analysis. Both routes had approximately 6.4 km and 1.0 km, respectively. The main route had 51 blocks, and the validation route had 6, both with several urban environments.
Figure 1
Main and validation route for the dynamic experiment
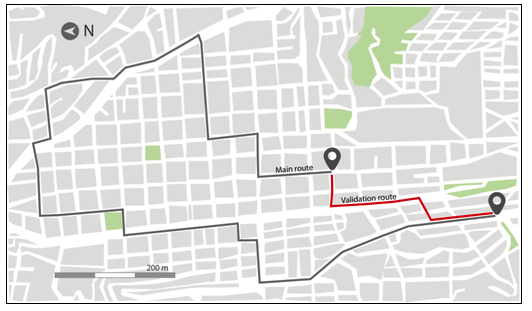
Source: the authors
In both routes, on Tuesday, April 25, 2017, data was collected. This day was selected considering that has the less horizontal error from the static experiment. From 21:11 to 23:14 data collection was performed to ensure free-flow traffic condition because a good accuracy of speed and travel time were observed, in that condition (Wunnava et al., 2007).
Smartphones were set on car dashboard using A-GPS and cellular location. It did not use Wi-Fi location technology considering that city does not have enough Wi-Fi coverage. Simultaneously, inside the vehicle, Video VBOX device was placed. This device allows collecting, among others, speed and position; and it has GPS antenna to get better accuracy and is placed on the car’s roof. In order to analyze variation between smartphones, location modes, and applications, position and speed errors were calculated (minimum, maximum, average error and RMSE).
Variables that can block or reflect GPS signal were also collected such as building density with several stories (1 to 7 stories), buildings height (up to 11 m), trees and bushes density (up to 14 per 100 m), utility poles density (up to 6 per 100 m), street, road or avenue width (3.1-13.0 m), sidewalk width (1.2-7.5 m), sidewalk presence (0=no, 1=yes), median width (up to 7 m), median presence (0=no, 1=yes), trees height (6.0-14.6 m), bushes height (up to 4), building area that block the satellite signal (up to 994.3 m2), vehicle speed (up to 51.9 km/h), and street azimuth (0.3-337.5). In table 4 and 6 the detailed list is shown. Since they affected the GPS relative accuracy in another study (Garnett & Stewart, 2014), the first two variables were selected. The variables, related to the width, were considered because with the same GPS elevation mask angle, broader spaces can receive more satellite signals than narrow ones. The vehicle speed variable was selected because it affects the time that the smartphone is receiving to GPS signal. That is to say, higher speeds would allow shorter reception time of the GPS satellite signal that lower speeds. Also, street azimuth was taken in consideration since GPS signals with lines of sight going across the street are much more likely to block or reflect by for example buildings than GPS signals with lines of sight going along the street (Wang et al., 2015).
With average error position of every block and all speed errors, a regression analysis was performed using statistic software Minitab (Minitab 14.2 Statistical Software, 2005). Those errors were related to collected variables that can block or reflect GPS signal, using regression analysis at 95% of confidence. Equations were calibrated using the variables that were statistically more significant. Finally, a mathematical model was calibrated based on speeds from smartphones and Video VBOX Lite. With data collection from validation route, the calibrated equations were validated using statistical analysis.
The first experiment analyzed the position between smartphones and benchmark, while, the second; it interpreted the position and speed between smartphones and Video VBOX Lite. Position and speed errors were calculated, in both tests. In order to identify the variables that can explain the position or speed error, also regression analysis was performed in the dynamic test.
In this experiment, with the GPSSpeed application, around 1200 point were collected (~1 sample per second), while with GPSLogger application it was obtained around 600 points (~2 data per second). Three location modes: A-GPS, cellular and Wi-Fi, were used for almost a week. During collecting data, Samsung Galaxy S6, with both applications, took up a minute until it became stabilized, that is the value after a minute remains the same. In contrasts, Samsung Galaxy A5 permanently gave different values independently of the applications or the localization mode. In table 1 and 2 position errors are summarized.
Table 1
Position errors using Samsung Galaxy S6 for different
localization modes and during the days of the week
Horizontal errors |
Location mode tech. |
GPSSPEED APPLICATION |
GPSLOGGER APPLICATION |
||||||||||||
N° |
Mon |
Tue |
Wed |
Thur |
Fri |
Sat |
N° |
Mon |
Tue |
Wed |
Thur |
Fri |
Sat |
||
Minimum error (m) |
A-GPS |
1201 |
14.7 |
1.4 |
1.1 |
4.4 |
11.0 |
7.5 |
616 |
0.9 |
1.0 |
0.6 |
0.9 |
2.2 |
1.1 |
Cellular |
1200 |
4.6 |
1.7 |
1.4 |
8.1 |
5.6 |
0.3 |
630 |
0.7 |
2.2 |
0.2 |
2.2 |
2.2 |
0.7 |
|
Wi-Fi |
1201 |
0.9 |
1.0 |
1.2 |
1.0 |
0.4 |
3.0 |
614 |
0.6 |
0.4 |
3.6 |
1.3 |
2.1 |
0.6 |
|
Maximum error (m) |
A-GPS |
1201 |
14.7 |
4.5 |
18.9 |
7.2 |
18.7 |
17.8 |
601 |
23.8 |
17.5 |
9.5 |
7.4 |
9.1 |
28.7 |
Cellular |
1201 |
6.4 |
6.1 |
6.4 |
41.3 |
18.9 |
19.4 |
617 |
28.7 |
8.1 |
23.8 |
17.8 |
17.5 |
10.4 |
|
Wi-Fi |
1200 |
4.7 |
19.9 |
3.6 |
1.0 |
5.1 |
44.2 |
623 |
40.7 |
23.8 |
23.8 |
9.5 |
28.7 |
28.7 |
|
Average error (m) |
A-GPS |
1200 |
14.7 |
1.4 |
3.1 |
5.1 |
11.2 |
8.4 |
627 |
1.6 |
1.4 |
2.7 |
0.9 |
2.8 |
2.8 |
Cellular |
1201 |
4.6 |
1.9 |
1.7 |
8.4 |
6.5 |
8.8 |
653 |
2.1 |
2.2 |
0.8 |
2.9 |
3.5 |
0.8 |
|
Wi-Fi |
1201 |
1.1 |
1.4 |
1.2 |
1.0 |
0.8 |
4.0 |
607 |
1.1 |
0.9 |
4.2 |
4.0 |
3.1 |
2.1 |
|
RMSE (m) |
A-GPS |
1200 |
14.7 |
1.4 |
3.3 |
5.1 |
11.2 |
8.8 |
617 |
2.2 |
1.5 |
2.7 |
1.0 |
2.8 |
3.2 |
Cellular |
1201 |
4.6 |
2.0 |
1.8 |
8.7 |
6.5 |
8.8 |
623 |
3.0 |
2.2 |
1.6 |
3.2 |
3.5 |
1.0 |
|
Wi-Fi |
1200 |
1.1 |
1.8 |
1.3 |
1.0 |
0.9 |
4.6 |
632 |
3.6 |
3.3 |
5.1 |
4.0 |
5.9 |
4.6 |
|
Source: the authors
-----
Table 2
Position errors using Samsung Galaxy A5 for different
localization modes and during the days of the week
Horizontal errors |
Location mode tech. |
GPSSPEED APPLICATION |
GPSLOGGER APPLICATION |
||||||||||||
N° |
Mon |
Tue |
Wed |
Thur |
Fri |
Sat |
N° |
Mon |
Tue |
Wed |
Thur |
Fri |
Sat |
||
Minimum error (m) |
A-GPS |
1200 |
3.0 |
0.2 |
3.5 |
1.9 |
4.6 |
6.9 |
523 |
0.9 |
0.7 |
0.0 |
0.2 |
0.4 |
0.8 |
Cellular |
1200 |
0.1 |
0.8 |
1.2 |
0.3 |
2.0 |
0.4 |
357 |
0.6 |
1.8 |
0.3 |
0.3 |
0.3 |
0.6 |
|
Wi-Fi |
1201 |
0.9 |
1.3 |
1.5 |
1.5 |
2.3 |
0.2 |
529 |
0.4 |
0.1 |
0.1 |
2.4 |
0.1 |
0.7 |
|
Maximum error (m) |
A-GPS |
1200 |
46.0 |
4.7 |
17.1 |
19.2 |
12.3 |
17.5 |
527 |
5.0 |
10.4 |
4.4 |
14.2 |
11.2 |
3.0 |
Cellular |
1201 |
5.3 |
13.9 |
4.8 |
23.9 |
8.1 |
14.6 |
527 |
9.6 |
5.4 |
12.0 |
24.1 |
15.8 |
13.2 |
|
Wi-Fi |
1200 |
2.0 |
2.7 |
2.9 |
14.5 |
3.2 |
3.8 |
527 |
7.8 |
3.0 |
62.3 |
9.8 |
16.1 |
3.7 |
|
Average error (m) |
A-GPS |
1200 |
4.1 |
2.7 |
4.0 |
4.9 |
7.3 |
8.0 |
318 |
1.1 |
0.8 |
1.0 |
4.4 |
3.2 |
0.9 |
Cellular |
1199 |
3.0 |
2.8 |
3.2 |
3.3 |
3.3 |
4.2 |
442 |
0.8 |
2.4 |
1.7 |
4.2 |
4.0 |
1.2 |
|
Wi-Fi |
1201 |
1.6 |
1.7 |
1.9 |
1.6 |
2.4 |
0.8 |
542 |
0.5 |
2.0 |
2.2 |
3.1 |
4.6 |
1.4 |
|
RMSE (m) |
A-GPS |
1200 |
5.6 |
2.8 |
4.0 |
5.4 |
7.5 |
8.0 |
529 |
1.1 |
0.9 |
1.1 |
5.0 |
3.6 |
0.9 |
Cellular |
1200 |
3.1 |
2.8 |
3.2 |
3.4 |
3.3 |
4.4 |
534 |
1.0 |
2.4 |
1.9 |
5.2 |
4.7 |
1.5 |
|
Wi-Fi |
1201 |
1.6 |
1.7 |
1.9 |
1.7 |
2.5 |
1.2 |
524 |
0.6 |
2.1 |
3.7 |
3.1 |
5.2 |
1.4 |
|
Source: the authors
In table 1 and 2 can be seen errors up to 62.3 m for both smartphones, both applications, all location modes, and all days. Considering the broad range of errors in these tables; it analyzed average error from whole data for understanding the position error variation due to smartphones, applications, locations modes and days of the week. The average error of the GPSSpeed application (all location modes, both smartphones and all days) was 4.1 m, while for GPSLogger was 2.2 m. Additionally, the average error of Samsung Galaxy S6 (all location modes, both applications and all days) was 3.5 m while for Samsung Galaxy A5 was 2.8 m. Also, average error for the days of the week (considering all location modes, both smartphones, and both applications), was 3.0 m for Monday, 1.8 m for Tuesday, 2.3 m for Thursday, 4.4 for Friday and 3.6 for Saturday. This result is maybe, since changes in satellite constellation (Wang et al., 2015), and that localization error of the same position varies significantly over time (Modsching et al., 2006). Furthermore, the average error for A-GPS (both smartphones, both applications and all days included) was 4.1 m, for the cellular location was 3.3 m and for Wi-Fi location was 2.0 m. In summary, it seems that more accuracy may be gotten using GPSLogger application, Samsung Galaxy A5, Wi-Fi location and on Tuesday day.
After the static experiment, with the purpose of analyzing position and speed data from smartphones and compare them with data from Video VBOX Lite, a dynamic test was conducted. On Tuesday data collection was performed, because it was the day with least position error in the static experiment. In spite of Samsung Galaxy A5 and GPSLogger application were obtained fewer positions errors in the static test, it was decided to use both smartphones and both applications for better understanding smartphones location. Wi-Fi was not used considering insufficient network coverage on the route and in the city. For showing the results of these experiments, this section is divided into two: position analysis and speed analysis. Considering Video VBOX Lite is more accurate than smartphones, as a control device, was used. Using Euclidian distance, in every block position errors were calculate (see table 3). A regression analysis was conducted (See table 4).
Table 3
Errors in smartphones position for several
conditions in the dynamic experiment
Condition device |
Minimum error (m) |
Maximum error (m) |
Average error (m) |
RMSE (m) |
||
Smartphone |
Location mode |
Application |
||||
Samsung Galaxy S6 |
A-GPS |
GPSspeed |
0.08 |
10.10 |
4.01 |
4.55 |
GPSLogger |
0.24 |
17.61 |
4.27 |
5.13 |
||
Cellular |
GPSspeed |
0.08 |
14.89 |
4.20 |
4.86 |
|
GPSLogger |
0.06 |
12.44 |
3.73 |
4.28 |
||
Samsung Galaxy A5 |
A-GPS |
GPSspeed |
0.06 |
25.15 |
5.02 |
6.35 |
GPSLogger |
0.42 |
27.93 |
6.02 |
7.24 |
||
Cellular |
GPSspeed |
0.20 |
42.90 |
4.18 |
5.40 |
|
GPSLogger |
0.25 |
17.77 |
5.54 |
6.40 |
||
Source: the authors
Samsung Galaxy S6 performed better than Samsung Galaxy A5 as shown in table 3. There is a little difference between smartphones, locations mode or application used, considering the average errors. Errors were between 0.06 and 42.96 m, which is quite less than previous studies in urban environments (up to 500 m). However, some of these values are enough to locate vehicles in the wrong location, affecting its use in transportation. A regression analysis was conducted to determine which variables can influence those errors. After that analysis, the maximum coefficient of determination between average error position and all variables was 0.22 for both smartphones, so none of the variables analyzed were statistically significant, as seen in table 4. Contrary to this, another study found that GPS units consistently deceased in relative accuracy with the increase in building height (Garnett & Stewart, 2014). This lack of correlation may be due the positional accuracy of GPS is influenced by several factors: ephemeris error, ionospheric and tropospheric delays, receiver noise, satellite geometry and multipath effect (Zandbergen & Barbeau, 2011) and not just for the variables considered.
Table 4
Coefficient of determination (R2) between location
average errors and analyzed variables
Variables |
Smartphones conditions |
|||||||
1 |
2 |
3 |
4 |
5 |
6 |
7 |
8 |
|
Building density with 1 story on the right side |
- |
- |
- |
- |
- |
- |
- |
- |
Building density with 2 stories on the right side |
- |
- |
- |
- |
- |
- |
- |
- |
Building density with 3 stories on the right side |
- |
- |
- |
- |
- |
- |
- |
- |
Building density with 4 stories on the right side |
- |
0.22 |
- |
- |
- |
0.22 |
- |
- |
Building density with 5 stories on the right side |
0.11 |
- |
- |
- |
- |
- |
- |
- |
Building density with 6 stories on the right side |
- |
- |
- |
- |
- |
- |
- |
- |
Building density with 7 stories on the right side |
- |
- |
- |
- |
- |
- |
- |
- |
Building density with 1 story on the left side |
- |
0.10 |
0.17 |
- |
- |
- |
- |
- |
Building density with 2 stories on the left side |
- |
0.12 |
- |
- |
- |
- |
0.11 |
0.10 |
Building density with 3 stories on the left side |
- |
0.21 |
- |
- |
- |
- |
- |
- |
Building density with 4 stories on the left side |
- |
0.15 |
- |
- |
- |
- |
- |
- |
Building density with 5 stories on the left side |
- |
0.12 |
- |
- |
- |
- |
- |
- |
Building density with 6 stories on the left side |
- |
- |
- |
- |
- |
- |
- |
- |
Building density with 7 stories on the left side |
- |
- |
- |
- |
- |
- |
- |
- |
Trees density on the right side |
- |
- |
- |
- |
- |
0.18 |
- |
- |
Trees density on the left side |
- |
- |
- |
0.10 |
- |
- |
- |
- |
Bushes density on the right side |
- |
- |
- |
- |
- |
- |
- |
- |
Bushes density on the left side |
- |
- |
- |
- |
- |
- |
- |
- |
Utility poles density on the right side |
- |
- |
- |
- |
- |
- |
- |
- |
Utility poles density on the right side |
- |
- |
- |
- |
- |
- |
- |
- |
Road width |
- |
- |
0.13 |
- |
- |
0.10 |
- |
- |
Sidewalk width on the right side |
- |
- |
- |
- |
- |
- |
0.11 |
- |
Sidewalk width on the left side |
- |
- |
- |
- |
- |
0.10 |
- |
- |
Median width |
- |
- |
- |
0.22 |
- |
- |
- |
- |
Trees average height on the right side |
- |
- |
- |
- |
- |
- |
- |
- |
Trees average height on the left side |
- |
- |
- |
- |
- |
- |
0.10 |
- |
Bushes average height on the right side |
- |
- |
- |
- |
- |
- |
- |
- |
Bushes average height on the left side |
- |
- |
- |
- |
- |
- |
- |
- |
Building average height on the right side |
0.12 |
- |
- |
- |
- |
- |
- |
- |
Building average height on the left side |
- |
- |
- |
- |
- |
- |
- |
- |
Building area that block signal on the right side |
- |
- |
- |
- |
- |
- |
- |
- |
Building area that block signal on the left side |
- |
- |
- |
- |
- |
- |
- |
- |
Average vehicle speed |
0.12 |
- |
- |
- |
- |
- |
- |
- |
Relationship of obstruction height and section width* |
- |
- |
- |
- |
- |
- |
- |
- |
Street azimuth |
- |
- |
- |
- |
- |
- |
0.22 |
- |
1: Samsung S6 + A-GPS + GPSSpeed app, 2: Samsung S6 + A-GPS + GPSLogger app, 3: Samsung S6 + cellular + GPSSpeed app, 4: Samsung A6 + cellular + GPSLogger app, 5: Samsung A5 + A-GPS + GPSSpeed app, 6: Samsung A5 + A-GPS + GPSLogger app, 7: Samsung A5 + cellular + GPSSpeed app, 8: Samsung A5 + cellular + GPSLogger app -: R² < 0.1 *: Obstruction height is considered as average height of all features that can block or reflect GPS signal such as: buildings, trees, utility poles, etc. And section width is the free transversal space that has the GPS receiver such as road width plus sidewalk width plus median, if exists. |
||||||||
Source: the authors
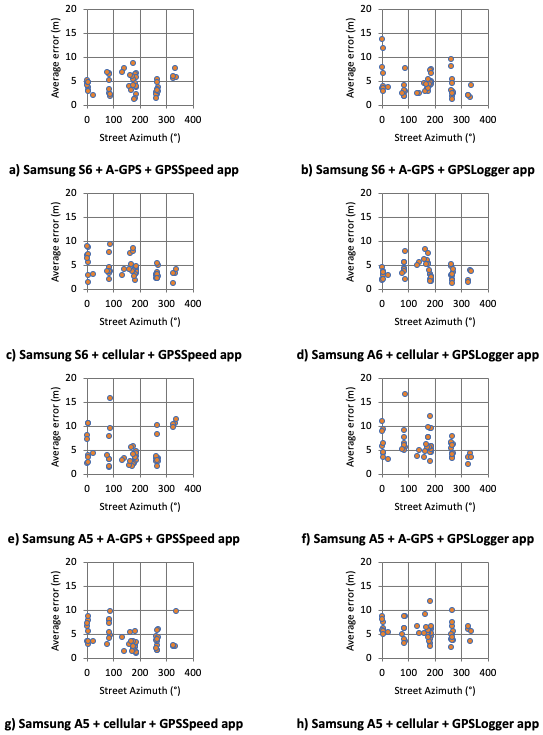
Despite these low coefficients of determination, the relationship between average errors and street azimuth showed some patterns (See Figure 2). It is interesting that, in almost all smartphones conditions, average errors are high in small street azimuths and it decreases with increasing azimuths. In Figure 2b, c, e, and f this trend can be seen. Another pattern is that average errors are smaller in small and in big street azimuths than medium street azimuths. Figure 2a, d, and h are examples of this trend. The only condition that does not match the patters, than the previous ones, are Figure 2g. However, if the point, with an average error of around 10 m between 300-400°, is removed, it will belong to the first trend.
Figure 2
Plot of average error and street azimuth for all
smartphones conditions. Source: the authors
These trends can be since street azimuth is related to satellite constellation geometry, building height, and street width; which may interfere with the line of sight of satellites (for more details see Wang et al., 2015). This trend could help to calculate maximum average errors. Street azimuth was indirectly used, with other variables and a 3D city model, in an algorithm called shadow-matching solution (Wang et al., 2015). This algorithm helped Samsung Galaxy S3 to differentiate between weak and strong satellite signals, and also decreases position error. This algorithm needs a 3D city model, which for small cities may not be affordable.
Also, errors from speeds from Video VBOX Lite and smartphones were calculated (see table 5). Of all data, Samsung Galaxy A5 + A-GPS + GPSSpeed application had the highest error. Errors for both smartphones, both applications, and both location modes, are between 2.21 and 11.81 km/h which are similar than those found in preview literature (3.4 – 8.0 km/h). This wide range of errors may be since smartphones did not have a clear view of the sky, because of a typical urban environment or the structure of the vehicle itself. Also, it is challenging to get data when the device is moving, especially when the vehicle is changing direction (Beyeler & Pheanis, 2012). These errors are acceptable based on what it will be used to speed data. For example, in traffic macro-simulation, this accuracy may be acceptable, while for micro-simulation or speed management more exactitude is needed.
Table 5
Errors in smartphones speed for several
conditions in the dynamic experiment
Condition device |
Minimum error (m) |
Maximum error (m) |
Average error (m) |
RMSE (m) |
||
Smartphone |
Location mode |
Application |
||||
Samsung Galaxy S6 |
A-GPS |
GPSspeed |
-2.21 |
8.40 |
0.36 |
1.61 |
GPSLogger |
-2.36 |
4.52 |
0.06 |
1.13 |
||
Cellular |
GPSspeed |
-5.47 |
9.36 |
0.33 |
2.35 |
|
GPSLogger |
-3.65 |
2.53 |
0.03 |
1.14 |
||
Samsung Galaxy A5 |
A-GPS |
GPSspeed |
-11.81 |
8.08 |
-0.03 |
4.25 |
GPSLogger |
-2.38 |
6.82 |
0.37 |
1.53 |
||
Cellular |
GPSspeed |
-5.33 |
7.02 |
-0.05 |
1.88 |
|
GPSLogger |
-4.85 |
6.62 |
0.47 |
2.07 |
||
Source: the authors
A regression analysis was performed using the collected variables and all speed errors (See table 6). Street azimuth was the variable statistically more significant (R2 = 0.7); however, it was just for Samsung Galaxy A5 smartphone + A-GPS + GPSSpeed application, so it eliminated as a possible variable of explanation of the speed error. For almost all the cases, average vehicle speed was consistently significant. However, because it had a low coefficient of determination, was also discarded.
Table 6
Coefficient of determination (R2) between
speed average errors and analyzed variables
Analyzed variables |
Smartphones conditions |
|||||||
1 |
2 |
3 |
4 |
5 |
6 |
7 |
8 |
|
Building density with 1 story on the right side |
- |
- |
- |
- |
- |
- |
- |
- |
Building density with 2 stories on the right side |
- |
- |
- |
- |
- |
- |
- |
- |
Building density with 3 stories on the right side |
- |
- |
- |
- |
- |
- |
- |
- |
Building density with 4 stories on the right side |
- |
- |
- |
- |
- |
- |
- |
- |
Building density with 5 stories on the right side |
- |
- |
0.32 |
- |
- |
- |
0.15 |
0.40 |
Building density with 6 stories on the right side |
- |
- |
- |
- |
- |
- |
- |
- |
Building density with 7 stories on the right side |
- |
- |
- |
- |
- |
- |
- |
- |
Building density with 1 story on the left side |
- |
- |
- |
- |
- |
- |
- |
- |
Building density with 2 stories on the left side |
- |
0.12 |
0.12 |
- |
- |
- |
- |
0.12 |
Building density with 3 stories on the left side |
- |
0.14 |
- |
- |
- |
- |
- |
- |
Building density with 4 stories on the left side |
- |
- |
- |
- |
- |
- |
- |
- |
Building density with 5 stories on the left side |
- |
- |
- |
- |
- |
- |
- |
- |
Building density with 6 stories on the left side |
- |
- |
- |
0.12 |
- |
- |
- |
- |
Building density with 7 stories on the left side |
- |
- |
- |
- |
- |
- |
- |
0.60 |
Trees density on the right side |
- |
- |
- |
- |
- |
- |
- |
- |
Trees density on the left side |
- |
0.13 |
- |
- |
- |
- |
- |
0.12 |
Bushes density on the right side |
- |
- |
- |
- |
- |
- |
- |
- |
Bushes density on the left side |
- |
- |
- |
- |
- |
- |
- |
- |
Utility poles density on the right side |
- |
- |
- |
0.20 |
0.15 |
- |
0.20 |
- |
Utility poles density on the right side |
- |
- |
- |
- |
- |
- |
- |
- |
Road width |
- |
- |
- |
- |
- |
- |
- |
- |
Sidewalk width on the right side |
- |
- |
- |
- |
- |
- |
- |
- |
Sidewalk width on the left side |
- |
- |
- |
- |
- |
- |
- |
- |
Median width |
- |
- |
- |
- |
- |
- |
- |
- |
Trees average height on the right side |
- |
- |
- |
- |
- |
- |
- |
- |
Trees average height on the left side |
- |
- |
- |
- |
- |
- |
- |
0.11 |
Bushes average height on the right side |
- |
- |
- |
- |
- |
- |
- |
- |
Bushes average height on the left side |
- |
- |
- |
- |
- |
- |
- |
- |
Building average height on the right side |
- |
- |
0.14 |
- |
- |
- |
- |
0.12 |
Building average height on the left side |
- |
0.16 |
- |
- |
- |
- |
0.17 |
0.18 |
Building area that block signal on the right side |
- |
- |
- |
- |
- |
- |
- |
- |
Building area that block signal on the left side |
- |
0.14 |
- |
- |
- |
- |
- |
0.16 |
Average vehicle speed |
- |
0.20 |
0.19 |
0.21 |
0.21 |
0.12 |
0.18 |
0.10 |
Relationship of obstruction height and section width* |
0.12 |
0.17 |
0.23 |
- |
- |
- |
0.21 |
- |
Street azimuth |
- |
0.21 |
0.15 |
- |
0.70 |
- |
- |
- |
1: Samsung S6 + A-GPS + GPSSpeed app, 2: Samsung S6 + A-GPS + GPSLogger app, 3: Samsung S6 + cellular + GPSSpeed app, 4: Samsung A6 + cellular + GPSLogger app, 5: Samsung A5 + A-GPS + GPSSpeed app, 6: Samsung A5 + A-GPS + GPSLogger app, 7: Samsung A5 + cellular + GPSSpeed app, 8: Samsung A5 + cellular + GPSLogger app -: R² < 0.1 *: Obstruction height is considered as average height of all features that can block or reflect GPS signal such as: buildings, trees, utility poles, etc. And section width is the free transversal space that has the GPS receiver such as road width plus sidewalk width plus median, if exists. |
||||||||
Source: the authors
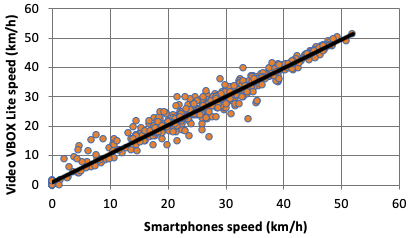
On the other hand, speeds from Video VBOX Lite and smartphones also were analyzed. For the eight smartphone conditions, linear regression was calibrated with an R2 value between 0.93 and 0.99. All speed data were plotted considering these results (See Figure 3), for see general data tendency. It is interesting that over 40 km/h, there is less dispersion than in lower speeds; maybe because smartphones have less time to hear more GPS signals (NLOS and LOS) than in speed less than 40 km/h. A single equation can be calibrated including both smartphones, both application, and both location modes, observing data distribution in Figure 3. A single model is easy and economical to maintain. The model has an R2 = 0.97, is applied up to 51.9 km/h and has the following form:

Where,
S = Video VBOX Lite speed (km/h),
Ss = smartphones speed (Galaxy S6 and A5, GPSspeed and GPSLogger apps, and A-GPS and cellular location)
Figure 3
Video VBOX Lite speeds versus smartphones speeds
(both smartphones + both application + both location modes)
Source: the authors
Equation 2 was validated using: the graphs between observed and estimated values for each equation and the following errors: mean square error (MSE=5.7 (km/h)2), mean absolute error (MAE = 1.43 km/h), mean absolute percentage error (MAPE=13.74%) and Chi-square test calculation (χ2 calculated = 0.36 < χ25% critical). It is worth mentioning that the equation is valid within established ranges.
This article investigated the position and speed errors of two smartphones and their relationship with variables that can block or reflect GPS signal in an urban environment. Two experiments were conducted to achieve it: static (position) and dynamic (position and speed), using three devices, two smartphones application, and three location technologies. After results, the main conclusions are:
In the static experiment, smartphones position was significantly changing between days, smartphones devices, smartphones applications, and locations technology. Furthermore, it seems that location is more accurate on Tuesday; due to the constant changes of the satellite constellation (Modsching et al., 2006). However, it is necessary to collect data from more weeks in different seasons. A-GPS technology was the least accurate of the three studied location modes; maybe it was because of the high cellular coverage, unlike other studies where the cellular was the least accurate (Garnett & Stewart, 2014; Watzdorf & Michahelles, 2010; Zandbergen, 2009). On the other hand, Wi-Fi was the location technology that had most accurate data.
In the dynamic experiment, smartphones position was significantly changing among smartphones devices, smartphones applications, and locations technology. Nevertheless, in smartphones speed, smaller variations were found. Then an equation was possible to calibrate, which can be used up to 51.9 km/h. Additionally, thirty-five variables, that can block or reflect GPS signal, were collected, to find equations that would improve accuracy in smartphones. However, all those variables were no statistically significant at 95% of confidence.
After concluding the study, authors found the following limitations: data was collected using just two applications and two devices, while in the market there are many other options and with different operating systems. Also, data was collected during a week, which cannot be enough to generalize to other periods of the year. Additionally, this study did not analyze standard errors that affect the accuracy of GPS such as atmospheric changes, satellite errors, bias atomic clock, and multipath or position dilution of precision. It is recommended to conduct a repeatability and reproducibility analysis to check variability in measuring device and between operators, respectively. Also, a single benchmark is not enough to make a conclusive answer about smartphone location errors. And furthermore, in the dynamic experiment, Video VBOX Lite was used based on the assumption that it gives accurate data for traffic; which should be, in futures studies, researched.
Despite these limitations, the present study helps to understand smartphones location in an urban environment. It showed that variables, such as tall buildings, are not enough for statistically explaining position and speed errors in smartphones. Also, speed errors from smartphones are relative low, and they can be corrected using a linear regression equation. Street azimuth, combined with satellite constellation geometry and urban environment, may affect the position and speed error because it interferes with the lines of sight of satellites. Finally, considering the results of this investigation, position smartphones can be used as secondary information in transportation, while speed smartphones can be used as primary unless more accuracy is needed.
Position and speed errors in smartphones continue to be a critical issue that should be resolved before they can be used as accurate primary information in transportation to avoid waste resources (time or money) or put at risk the smartphone users (leading them to a wrong location) and to benefits with accurate traffic information (for example, get faster path in specific time of the day) or accurate locations (get to the place even for touristic purposes).
Bar-Gera, H. (2007). Evaluation of a Cellular phone-based System for measurements of traffic speeds and travel times: A case study from Israel. Transportation Research Part C: Emerging Technologies, 15(6), 380–391. http://doi.org/10.1016/j.trc.2007.06.003
Beyeler, B., & Pheanis, D. C. (2012). Vehicle Position Determination — Using Markers and Speed Reports. Journal of Transportation Technologies, 117–121.
Building, R., Green, E. R., & Agent, K. R. (2004). Evaluation of the accuracy of GPS as a method of locating traffic collisions. Kentucky Transportation Center Research Report, 1–67. http://doi.org/10.13023/KTC.RR.2004.08
Gallagher, T., Li, B., Kealy, A., & Dempster, A. (2009). Trials of commercial Wi-Fi positioning systems for indoor and urban canyons. In Proceedings of the symposium on GPS/GNSS (IGNSS). Retrieved from http://citeseerx.ist.psu.edu/
García-Ramírez, Y. (2014). Aceleraciones y desaceleraciones de vehículos livianos en caminos de montaña (Doctoral disertation). Universidad Nacional de San Juan. Retrieved from http://repositorio.educacionsuperior.gob.ec/
Garnett, R., & Stewart, R. (2014). Comparison of GPS units and mobile Apple GPS capabilities in an urban landscape. Cartography and Geographic Information Science, 42(1), 1–8. http://doi.org/10.1080/15230406.2014.974074
Herrera, J. C., Work, D. B., Herring, R., Ban, X. (Jeff), Jacobson, Q., & Bayen, A. M. (2010). Evaluation of traffic data obtained via GPS-enabled mobile phones: The Mobile Century field experiment. Transportation Research Part C: Emerging Technologies, 18(4), 568–583. http://doi.org/10.1016/j.trc.2009.10.006
Humphreys, T. E., Murrian, M., Van Diggelen, F., Podshivalov, S., & Pesyna, K. M. (2016). On the feasibility of cm-accurate positioning via a smartphone’s antenna and GNSS chip. Proceedings of the IEEE/ION Position, Location and Navigation Symposium, PLANS 2016, 232–242. http://doi.org/10.1109/PLANS.2016.7479707
Jiang, Y., & Li, S. (2001). Measuring and Analyzing Vehicle Position and Speed Data at Work Zones Using Global Positioning System. In Transportation Research Board 80th annual meeting.
Jones, T. W., Marzen, L., & Chappelka, A. (2015). Horizontal Accuracy Assessment of Global Positioning System Data from Common Smartphones. Papers in Applied Geography, 1(1), 59–64. http://doi.org/10.1080/23754931.2015.1009304
Khadka, I. (2015). The Accuracy of Location services and the potential impact on the admissibility of GPS Based evidence in court cases (Bsc (Hons) Computer Forensic and Security). University of Derby.
Kuseler, T., & Lami, I. (2012). Using Geographical Location as an Authentication Factor to Enhance mCommerce Applications on Smartphones. International Journal of Computer Science and Security, 6(4), 277–287.
Lachapelle, G., Kuusniemi, H., Dao, D. T. H., Macgougan, G., & Cannon, M. E. (2004). HSGPS Signal Analysis and Performance. Journal of the Institute of Navigation, (September 2003), 29–43.
Lallie, H., & Benford, D. (2011). Challenging the Reliability of iPhone - Geo-tags. The International Journal of Forensic Computer Science, 6(1), 59–67. http://doi.org/10.5769/J201101004
Lane, N. D., Miluzzo, E., Lu, H., Peebles, D., Choudhury, T., Campbell, A., & College, D. (2010). A Survey of Mobile Phone Sensing. IEEE Communications Magazine, 48(9), 140–150. http://doi.org/10.1109/MCOM.2010.5560598
Ma, C. (2003). Integration of GPS and Cellular Networks to Improve Wireless Location Performance. In Proceedings of GPS/GNSS 2003 Conference (Session C4) (pp. 9–12). Portland (OR): The Institute of Navigation.
MacGougan, G., Lachapelle, G., Klukas, R., Siu, K., Garin, L., Shewfelt, J., & Cox, G. (2002). Performance analysis of a stand-alone high-sensitivity receiver. GPS Solutions, 6(3), 179–195. http://doi.org/10.1007/s10291-002-0029-z
Miluzzo, E., Oakley, J. M. H., Lu, H., Lane, N. D., Peterson, R. A., & Campbell, A. T. (2008). Evaluating the iPhone as a mobile platform for people-centric sensing applications. In Proceedings in the International Workshop on Urban, Community, and Social Applications of Networked Sensing Systems (Vol. 8). Raleigh, NC. http://doi.org/10.1.1.147.824
Minitab 14.2 Statistical Software. (2005). State College. PA: Minitab, Inc. Retrieved from www.minitab.com
Modsching, M., Kramer, R., & ten Hagen, K. (2006). Field trial on GPS Accuracy in a medium size city: the influence of built-up. 3rd Workshop on Positioning, Navigation and Communication 2006, 2006, 1–10. Retrieved from http://modsching.com/
Mohan, P., Padmanabhan, V. N., & Ramjee, R. (2008). Nericell: Rich Monitoring of Road and Traffic Conditions using Mobile Smartphones. Proceedings of the 6th ACM Conference on Embedded Network Sensor Systems - SenSys ’08, 323. http://doi.org/10.1145/1460412.1460444
Steenbruggen, J., Borzacchiello, M. T., Nijkamp, P., & Scholten, H. (2013). Mobile phone data from GSM networks for traffic parameter and urban spatial pattern assessment: A review of applications and opportunities. GeoJournal, 78(2), 223–243. http://doi.org/10.1007/s10708-011-9413-y
Tao, S., Manolopoulos, V., Rodriguez, S., & Rusu, A. (2012). Real-Time Urban Traffic State Estimation with A-GPS Mobile Phones as Probes. GEOProcessing, 2012(January), 22–31. http://doi.org/10.4236/jtts.2012.21003
Thiagarajan, A., Ravindranath, L., Lacurts, K., & Eriksson, J. (2009). VTrack : Accurate, Energy-aware Road Traffic delay estimation using mobile phones. In Proc. 7th ACM SenSys. Berkeley, CA.
Wang, L., Groves, P. D., & Ziebart, M. K. (2015). Smartphone shadow matching for better cross-street GNSS positioning in urban environments. Journal of Navigation, 68(3), 411–433. http://doi.org/10.1017/S0373463314000836
Watzdorf, S. von, & Michahelles, F. (2010). Accuracy of positioning data on smartphones. Proceedings of the 3rd International Workshop on Location and the Web - LocWeb ’10, 1–4. http://doi.org/10.1145/1899662.1899664
Work, D., & Bayen, A. (2008). Impacts of the mobile internet on transportation cyberphysical systems: traffic monitoring using smartphones. In National Workshop for Research on High-Confidence Transportation Cyber-Physical Systems: Automotive, Aviation and Rail. Retrieved from http://bayen.eecs.berkeley.edu/
Wunnava, S. V, Yen, K., Babij, T., Zavaleta, R., Romero, R., & Archilla, C. (2007). Travel Time Estimation Using Cell Phones for Highways and Roadways. Florida International University.
Zandbergen, P. A. (2009). Accuracy of iPhone Locations: A Comparison of Assisted GPS, WiFi and Cellular Positioning. Transactions in GIS, 13(S1), 5–25. http://doi.org/10.1111/j.1467-9671.2009.01152.x
Zandbergen, P. A. (2012). Comparison of WiFi positioning on two mobile devices. Journal of Location Based Services, 6(1), 35–50. http://doi.org/10.1080/17489725.2011.630038
Zandbergen, P. A., & Barbeau, S. (2011). Positional Accuracy of Assisted GPS Data from High-Sensitivity GPS- enabled Mobile Phones Positional Accuracy of Assisted GPS Data from High-Sensitivity GPS-enabled Mobile Phones. Journal of Navigation, (March 2017). http://doi.org/10.1017/S0373463311000051
Zhu, X., Li, Q., & Chen, G. (2013). APT: Accurate outdoor pedestrian tracking with smartphones. In Proceedings - IEEE INFOCOM (pp. 2508–2516). http://doi.org/10.1109/INFCOM.2013.6567057
1. Teacher-Researcher. Civil Engineering Department. Universidad Técnica Particular de Loja (UTPL). E-mail: ydgarcia1@utpl.edu.ec
2. Teacher-Researcher. Civil Engineering Department. Universidad Técnica Particular de Loja (UTPL). E-mail: epduque@utpl.edu.ec
3. Teacher-Researcher. Civil Engineering Department. Universidad Técnica Particular de Loja (UTPL) E-mail: hvrojas@utpl.edu.ec
4. Civil engineer. Civil Engineering Department. Universidad Técnica Particular de Loja (UTPL). E-mail: rolandoromanromero@gmail.com
5. Civil engineer. Civil Engineering Department. Universidad Técnica Particular de Loja (UTPL). E-mail: cristianandres57@yahoo.com
[Index]
revistaespacios.com

This work is under a Creative Commons Attribution-
NonCommercial 4.0 International License