![]() ISSN 0798 1015
ISSN 0798 1015

![]() ISSN 0798 1015
ISSN 0798 1015
Vol. 41 (Issue 10) Year 2020. Page 27
MUNIZU, Musran 1; ALAM, Syamsu 2; ARMAYAH 3; ASDAR, Muhammad 4 & BRASIT, Nurdin 5
Received: 14/12/2019 • Approved: 08/03/2020 • Published 26/03/2020
ABSTRACT: The purpose of this study was to identify and analyze the effect of smart city implementation dimensions on public service quality especially in South Sulawesi Province, Indonesia. Target populations were residents or users of public services in field of education, health, population administration, licensing, and transportation. The numbers of samples were 108 people. Method of data analyses were both descriptive statistical analysis, and Structural Equation Modeling (SEM). The results showed that factors of smart government, smart living, and smart economy are three important factors that greatly influence the smart city implementation. Then, factors of service-type specification product, cost, and service speed are three important elements that greatly affect the public services quality. Variable of smart governance has a significant and dominant effect on the quality of public services. Additionally, dimensions of smart city implementation include smart branding, smart economy, smart society, smart living, and smart environment have a significant effect on quality of public services. The better implementation in dimensions overall can improve public services quality for community |
RESUMEN: El propósito de este estudio fue identificar y analizar el efecto de las dimensiones de implementación de ciudades inteligentes en la calidad del servicio público, especialmente en la provincia de Sulawesi del Sur, Indonesia. Las poblaciones objetivo eran residentes o usuarios de servicios públicos en el campo de la educación, la salud, la administración de la población, las licencias y el transporte. El número de muestras fue de 108 personas. El método de análisis de datos fue tanto el análisis estadístico descriptivo como el Modelo de ecuación estructural (SEM). Los resultados mostraron que los factores de gobierno inteligente, vida inteligente y economía inteligente son tres factores importantes que influyen en gran medida en la implementación de la ciudad inteligente. Entonces, los factores de la especificación del tipo de servicio, el costo y la velocidad del servicio son tres elementos importantes que afectan en gran medida la calidad de los servicios públicos. La variable de gobernanza inteligente tiene un efecto significativo y dominante en la calidad de los servicios públicos. Además, las dimensiones de la implementación de la ciudad inteligente incluyen la marca inteligente, la economía inteligente, la sociedad inteligente, la vida inteligente y el entorno inteligente tienen un efecto significativo en la calidad de los servicios públicos. La mejor implementación en dimensiones en general puede mejorar la calidad de los servicios públicos para la comunidad |

Human resources management function in the government bureaucracy is to provide services to the community. Human resource management is an important element in service activities including in the context of public services. The main focus in public service is the fulfillment of community needs, so it must be done optimally (Sedarmayanti, 2018). It relate to an activity or sequence of activities that occur in government interaction with the public where public service has identical meaning with the community service (Sinambela, 2006; Waluyo, 2007). Nowadays, advances in information technology have been used intensively both by private companies and government agencies to improve service quality for customers (Munizu et al, 2019; Okhrimenko et al, 2019)
According to Surjadi (2009), the nature of public services is the delivery of excellent service to the public as an embodiment of the government’s obligation as public servants. In line with the description, Sedarmayanti (2018) stressed that main objectives of public services consist of three important components, namely: (1) to improve the quality of implementation of tasks and functions of government agencies in the field of public services, (2) to improve the system of public service to be more efficient and effective, and (3) to support the growth of creativity, initiative and community participation in development for creating community welfare.
Furthermore, Zein (2009) states that public services are regulated by the State whose main problem lies in the model of vertical structure government, intervention bureaucracy. Public services relates to the community and service administrator or the government. If the community is not satisfied with the services provided by the government, then these public services cannot be said to be of good quality service. Public service provider organizations are work units of public service providers that are within the environment of State institutions, corporations, independent institutions established under the law for public service activities and other legal entities established solely for public service activities (Act No. 25/2009). Therefore, the essence of public service is the provision of the best service for the community. Ratminto & Winarsih (2005) state that service quality is an important factor in providing services for the community. Service standard related to operation procedure standard as guidance in servicing community.
The measurement of public service performance has 3 (three) main objectives, namely: (1) helping to improve government’s performance so that government activities are focused on the goals and objectives of work unit programs; (2) allocating resources and making decisions, and (3) realizing public accountability and improving institutional communication (Prasetijaningsih, 2014). Public services are carried out by governments and corporations that strengthen democracy and human rights, promote economic prosperity, social cohesion, reduce poverty, increase environmental protection, wisely utilize natural resources, and deepen trust in government and public administration. The quality of public services can be measured through 9 (nine) main indicators namely: requirements, procedures, service time, costs/tariffs, service-type specification product, implementing competencies, implementing behavior, service announcements, and handling complaints, suggestions and input (Act No. 16 / 2014).
Good public service always follows the principles as expressed by Sulistio (2009) that the principles of public service must meet the principles, namely: (1) rational, effective, efficient which is done through open management, scientific, (2) innovative, where reform performed continuously to deal with a dynamic, changing and developing environment, (3) productive, that oriented towards optimal work results, (4) professionalism, apparatus working at a place must adjust their work according to their competencies and workplace, and (5) the use of appropriate modern technology so that services can be done quickly and efficiently.
The use of modern technology in public services can be done through the implementation of smart city. Smart city is a concept of urban planning by utilizing technological developments that will make life easier and healthier with a high level of efficiency and effectiveness (Annisah, 2017). The intensive use of information technology can encourage competitiveness and create efficiency and effectiveness in organizations (Munizu, et al., 2019). Smart city is a broad and integrated approach in improving the efficiency of city operations, improving the quality of life of its inhabitants, and growing the economy of the region (Cohen, 2013). Furthermore, Cohen (2011) divides smart city into 6 (six) main dimensions namely, Smart People, Smart Environment, Smart Living, Smart Mobility, Smart Economy, and Smart Governance. Smart city implementation can be a solution to improve the quality of public services. In its implementation, the people can be connected in an information system to recognize and access their needs through the use of rapid information technology through mobile devices (Supangkat et al, 2015). Utilization of technology can improve the quality of life of people, because people can avoid traffic jams, reduce pollution due to burning gasoline, and avoid areas of high crime (Prasetijaningsih, 2014). Smart city is designed to improve the quality of life of citizens who live in cities, the smarter a city can generate the more efficient of bureaucracy and the more efficient the use of energy, cost, and people. Smart city of the world city is a modern city supported by information technology infrastructure, which aims to facilitate its citizens in accessing information and perform daily activities efficiently (Ahmadjayadi, et al, 2016).
Based on described above, this study was aimed to analyze the elements that have an important contribution in forming and influencing both variables of smart city implementation, and quality of public service. In addition, to analyze the effect of implementation of smart city that consist of smart government, smart branding, smart economy, smart living, smart society, and smart environment toward quality of public service.
Quantitative design is used for addressing issues and achieving research objectives. This study was conducted in South Sulawesi, precisely in Makassar city and ParePare city. Then, unit of analysis of this study include population or people who have received information technology-based services in the fields of education, health, transportation, permitting, and civil recorded. Determination of samples was done by using the Slovin formula at a level of α = 10%, so that obtain the minimum number of samples that can represent a population of 100 people. The sampling technique uses proportional random sampling. After data collection, the number of samples obtained was 108 respondents. The variable of this study consists of 2 (two) main variables namely smart city implementation, and public services quality. Measurement of respondents’ answers to variables and indicators using a Likert Scale (1 – 5), where value of 1 means strongly disagree to 5 means strongly agree (Hair et al., 2006; Sugiyono, 2012, Sekaran & Bougie, 2016).
Validity testing was done through item analysis by using a method of Pearson’s Product Moment Correlation. An indicator will be valid if it has a value of r > 0.30. Then, reliability testing was conducted by using Cronbach’s Alpha (α). A variable will be reliable, if it has an α value greater than 0.60 (Hair et al., 2006; Sekaran & Bougie, 2016). Furthermore, the method of data analysis that used for solving the problems were consists of both statistics descriptive, and structural equation modeling.
The validity test was conducted to test the level of validity of question items in the questionnaire, while the reliability test was used to determine the level of reliability of a variable or construct. In brief, a summary of the results of the validity and reliability test can be seen in the table 1 below.
Table 1
Result of Validity
and Reliability Test
Variables and Indicators |
Correlation Coefficient |
Cronbach Alpha (α) |
Conclusion |
Smart governance (X1): X1.1; X1.2; X1.3 |
0.803; 0.882; 0.870 |
0.923 |
Valid & Reliable |
Smart branding (X2): X2.1; X2.2; X2.3 |
0.744; 0.764; 0.666 |
0.852 |
Valid & Reliable |
Smart economy (X3): X3.1; X3.2; X3.3 |
0.462; 0667; 0.690 |
0.761 |
Valid & Reliable |
Smart living (X4): X4.1; X4.2; X4.3 |
0.551; 0.783; 0.819 |
0.844 |
Valid & Reliable |
Smart society (X5): X5.1; X5.2; X5.3 |
0.834; 0.811; 0.706 |
0.888 |
Valid & Reliable |
Smart environment (X6): X6.1; X6.2; X6.3 |
0.788; 0.706; 0.792 |
0.876 |
Valid & Reliable |
Public service quality (Y1): Y1.1; Y1.2; Y1.3; Y1.4; Y1.5; Y1.6; Y1.7; Y1.8; Y1.9 |
0.714; 0.691; 0.701; 0.325; 0.497; 0.352; 0.584; 0.581; 0.662 |
0.847 |
Valid & Reliable |
Source: Analysis Result, 2019
The instrument test results show that all indicators/ items have a correlation coefficient value > 0.30. Then, it can also be known that each variable has a Cronbach alpha value > 0.60. Therefore, it can be concluded that this research questionnaire has a good level of validity and high reliability. So this questionnaire instrument can be used for field data collection purposes.
The result of analysis shows that respondents of this study were dominated by males with a total of 78 people (72.2%), while female’s as many as 30 people (27.8%). Based on age, respondents in this study were dominated by ages 31-50 years, which were 83 people (76.8%), the rest were respondents who had 17-30 years of age (9.3%), and above 50 years (13, 9%). Then, based on the level of education dominated by respondents who graduated from senior high school or equivalent (46.3%), and Bachelor (27.8%), while the rest are respondents which were graduated Diploma and Postgraduate education. In addition, the data also illustrates the types of public services that are generally utilized by the community, namely services in the fields of education, health, population, and civil registration, licensing, and transportation services. In the past one month, factually respondents predominantly utilized population services and civil registration (29.6%), while the rest were transportation services (22.2%), health services (20.4%), licensing services/ permitted (18.5%), and education services (9.3%) from the total of respondents.
This study also uses confirmatory factor analysis to determine and analyze the factors that have the greatest contribution in shaping construct of smart city implementation, and the quality of public services. Based on the results of data processing by using Confirmatory Factor Analysis (CFA), it can be seen that the variable of smart city implementation has six main indicators, namely: (1) smart governance dimensions, (2) smart regional brand dimensions, (3) smart economic dimensions, (4) smart life dimension, (5) smart society dimension, and (6) smart environment dimension. Briefly, the results of study by using confirmatory factor analysis can be presented in the table 2.
Table 2
Result of CFA - Variable of smart
city implementation (X1)
Relationship Pattern |
Factor Loading |
C.R. |
Prob. |
Conclusion |
X1.1 <--- SmartCity_X1 |
0.726 |
Fix |
Significant |
|
X1.2 <--- SmartCity_X1 |
0.641 |
5.636 |
0.000 |
Significant |
X1.3 <--- SmartCity_X1 |
0.669 |
5.875 |
0.000 |
Significant |
X1.4 <--- SmartCity_X1 |
0.498 |
4.505 |
0.000 |
Significant |
X1.5 <--- SmartCity_X1 |
0.475 |
4.231 |
0.000 |
Significant |
X1.6 <--- SmartCity_X1 |
0.711 |
6.153 |
0.000 |
Significant |
t-table = 1.982 , n= 108, df=106, α = 0.05 |
||||
Source: Analysis Result, 2019
Based on table above, it can be known that indicators X1.1, X1.2, X1.3, X1.4, X1.5, and X1.6 are consistent indicators in shaping and explaining the construct of smart city implementation. This is supported by the probability value of each indicator which is smaller than the standard α value (prob. < 0.05), and value of critical ratio which is greater than value of t-table (C.R. > 1.982).
Factor loading reflects the level of importance of an indicator on latent variable or construct that formed. Therefore, it can be concluded that 3 (three) most important indicators that reflect the construct of smart city implementation sequentially are (1) smart governance dimension (0.726), (2) smart environment dimension (0.711), and (3) smart economy dimension (0.669).
Furthermore, the results of data processing by using Confirmatory Factor Analysis (CFA) also indicate that the variable of public services quality consists of nine main indicators, namely: (1) service requirements, (2) service procedures, (3) service speed, (4) costs/tariff service, (5) service-type specification product, (6) competence of implementing service, (7) implementing behavior, (8) services announcement, and (9) handling complaints, suggestions and input.
The results of the confirmatory factor analysis of the variable of public service quality are presented in the table 3.
Table 3
Result of CFA - Variable of public service quality
Relationship Pattern |
Factor Loading |
C.R. |
Prob. |
Conclusion |
Y1.1 <--- Pub.Serv.Quality_Y1 |
0.658 |
Fix |
Significant |
|
Y1.2 <--- Pub.Serv.Quality_Y1 |
0.833 |
7.470 |
0.000 |
Significant |
Y1.3 <--- Pub.Serv.Quality_Y1 |
0.833 |
7.647 |
0.000 |
Significant |
Y1.4 <--- Pub.Serv.Quality_Y1 |
0.848 |
7.753 |
0.000 |
Significant |
Y1.5 <--- Pub.Serv.Quality_Y1 |
0.893 |
7.925 |
0.000 |
Significant |
Y1.6 <--- Pub.Serv.Quality_Y1 |
0.557 |
5.390 |
0.000 |
Significant |
Y1.7 <--- Pub.Serv.Quality_Y1 |
0.527 |
5.124 |
0.000 |
Significant |
Y1.8 <--- Pub.Serv.Quality_Y1 |
0.463 |
4.540 |
0.000 |
Significant |
Y1.9 <--- Pub.Serv.Quality_Y1 |
0.508 |
4.956 |
0.000 |
Significant |
t-table = 1.982 , n= 108, df=106, α = 0.05 |
||||
Source: Analysis Result, 2019
Referring to the results in the table, it can be seen that indicators Y1.1, Y1.2, Y1.3, Y1.4, Y1.5, Y1.6, Y1.7, Y1.8, and Y1.9 consistently and valid in shaping and explaining the construct of public services quality. This is supported by the probability value of each indicator which is smaller than the standard α value (prob. < 0.05), and value of critical ratio which is more than value of t-table (C.R. > 1.982). Furthermore, the value of factor loading reflects the level of importance of an indicator of the latent variable or constructs that formed. Therefore, it can be concluded that the 3 (three) most important indicators that reflect the construct of public service quality sequentially are (1) service-type specification product (0.893), (2) service cost/tariff (0.848), and (3) service speed (0.833).
Analysis of structural equation models is used to test the research hypotheses. This analysis begins with testing of the resulting model based on the criteria of good of fit models which include CMIN / DF, GFI, RMSEA, CFI, and TLI. In brief, the results of testing the model can be seen in the table 4.
Table 4
Results of fit model testing
Criteria of fit model |
Cut-off value |
Result of model |
Conclusion |
CMIN/DF |
≤ 2.00 |
10.012 |
Good/ Fit |
GFI |
≥ 0.90 |
0.967 |
Good/ Fit |
RMSEA |
≤ 0.08 |
0.042 |
Good/ Fit |
CFI |
≥ 0.95 |
0.989 |
Good/ Fit |
TLI |
≥ 0.95 |
0.975 |
Good/ Fit |
Source: Analysis Result, 2019
The results of testing the model by referring to the five model fit criteria indicate that the resulting model has been met the criteria of a fit model. Therefore, the results of this model can be used to test research hypotheses. Results of structural model of smart city implementation effect toward public services quality can be seen in the figure 1 and table 5 below.
Figure 1
Empirical Model Result
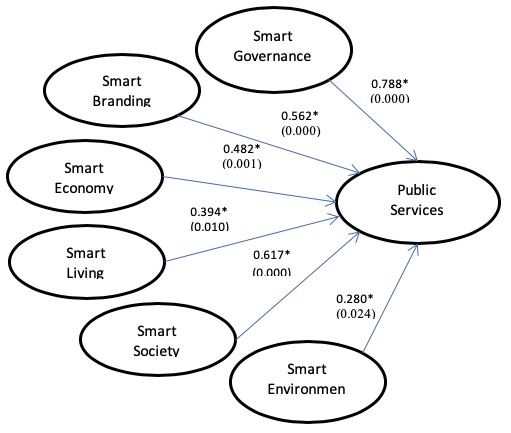
Noted: *) Significant Path at α ≤ 0.05
-----
Table 5
Result of structural model - Path
coefficient, t-value, and probability
Relationship Pattern |
Path Coefficient |
t-Value |
Prob. |
Conclusion |
Smart Governance Pub.Serv.Quality |
0.788 |
6.760 |
0.000*) |
Significant (H1, accepted) |
Smart Branding Pub.Serv.Quality |
0.562 |
4.117 |
0.000*) |
Significant (H2, accepted) |
Smart Economy Pub.Serv.Quality |
0.482 |
3.170 |
0.001*) |
Significant (H3, accepted) |
Smart Living Pub.Serv.Quality |
0.392 |
2.992 |
0.010*) |
Significant (H4, accepted) |
Smart Society Pub.Serv.Quality |
0.617 |
5.033 |
0.000*) |
Significant (H5, accepted) |
Smart Environment Pub.Serv.Quality |
0.280 |
2.684 |
0.024*) |
Significant (H6, accepted) |
t-table = 1.982; n= 108; df=106; α = 0.05 |
||||
Source: Analysis Result, 2019
The model result above illustrates the effect smart city implementation consisting of smart governance, smart branding, smart economy, smart living, smart society, and smart environment on quality of public services.
The results show that smart governance has a significant effect on quality of public services. This can be seen from the value of t-value > t-table (6.760> 1.982). Therefore, hypothesis I which states that the better implementation of smart city in terms of smart governance dimension will increase public services quality (hypothesis 1, accepted). The path coefficient value of 0.788 means that 78.8% improvement in public services quality is influenced by implementation of smart city in smart governance dimension.
Smart branding has a significant effect on quality of public services. This can be seen from the value of t-value > t-table (4.117> 1.982). Therefore, hypothesis II which states that the better implementation of smart city in terms of smart branding dimension will increase public services quality (hypothesis 2, accepted). The path coefficient value of 0.562 means that 56.2% improvement in public services quality is determined by implementation of smart city in smart branding dimension.
Smart economy has a significant effect on quality of public services. This can be seen from the value of t-value > t-table (3.170> 1.982). Therefore, hypothesis III which states that better implementation of smart city in terms of smart economy dimension will increase public services quality (hypothesis 3, accepted). The path coefficient value of 0.482 means that 48.2% improvement in public services quality is affected by the implementation of smart city in the smart economy dimension.
Furthermore, the data in the table above also show that smart living has a significant effect on quality of public services. This can be seen from the value of t-value > t-table (2.992> 1.982). Therefore, hypothesis IV which states that the better implementation of smart city in terms of smart living dimension will increase the public services quality (hypothesis 4, accepted). The path coefficient value of 0.392 means that 39.2% improvement in public services quality is influenced by the implementation of smart city in the smart living dimension.
Smart society has a significant effect on quality of public services. This can be seen from the value of t-value > t-table (5.033> 1.982). Therefore, hypothesis V which states that the better implementation of smart city in terms of smart society dimension will increase public services quality (hypothesis 5, accepted). The path coefficient value of 0.617 means that 61.7% improvement in public services quality is determined by the implementation of smart city in the smart society dimension.
This study also finds that smart environment has a significant effect on quality of public services. This can be seen from the value of t-value > t-table (2.684> 1.982). Therefore, hypothesis VI which states that the better implementation of smart city in terms of smart environment dimension will increase public services quality (hypothesis 6, accepted). The path coefficient value of 0.280 means that 28% improvement in the public services quality is influenced by the implementation of smart city in the smart environment dimension.
The results of this study are in line with Cohen (2013), Ahmadjayadi et al. (2016), and Annisah (2017) that the objective of smart cities is to provide a comfortable and safely city and also strengthen competitiveness in economy growth through clean and accountable governance. Smart cities are known for urban services performed by utilizing the role of information technology. Therefore, smart city development based on information technology advanced. Moreover, smart city as main pillars of good governance and other aspect in public services improvement (Munizu et al., 2019; Hasibuan & Sulaiman, 2019).
The findings of this study confirm the some of previous studies by Ratminto & Winarsih (2005), Hardiyansyah (2011), and Rahmayanty (2013) that public services include all services forms which is provided by government agencies in transparent and accountable manner for public satisfaction. Public satisfaction towards the service received is predominantly determined by service speed and service costs charged to the community. Related to results of this study Tjiptono (2014) asserts that excellent service quality occurs when local governments are able to meet the needs and desires of the community in accordance with their expectations. Furthermore, Okhrimenko et al. (2019) said that digitalization through smart city application in public services is one of the best solutions in enhancing public satisfaction.
Based on the results and analysis that has been presented earlier, it can be concluded that the construct of smart city implementation is shaped by six factors namely smart government, smart branding, smart economy, smart living, smart society, and smart environment. Factors of smart government, smart living, and smart economy are three important factors that greatly influence the smart city implementation. Furthermore, the construct of public service quality is shaped by nine indicators namely aspects of requirements, procedures, service time, costs/tariffs, service-type specifications product, implementing competencies, implementing behavior, service announcements, and handling complaints, suggestions and input. Factors of service-type specification product, cost/tariff, and service speed are three important factors that greatly affect the public services quality.
Smart governance has a significant effect on public services quality. Partially, smart governance also has a dominant influence on public services quality. Smart branding, smart economy, smart living, smart society, and smart environment have a direct effect and significant on public services quality. The better implementation in dimension of smart branding, smart economy, smart living, smart society, and smart environment will improve public services quality to community. The results of this study have implications for local governments to continuously strive to improve systems, facilities and services based on technology in all dimensions of community needs. In addition, local governments are also consistent in developing the human resources capacity and competency of service providers to support the successful implementation of the smart city system in South Sulawesi. Digital-based services such smart city became a necessity in the era of industrial revolution 4.0 to increase the speed of service to the community.
Ahmadjayadi, C., Farid, S.,& Wiradinata, M.R. (2016). Dashing or Crashing? New Indonesia from Smart City to Smart Nation. Jakarta: Elex Media Komputindo Publising.
Annisah. (2017). Proposed Smart City Planning: Smart Governance of MukoMuko District Government. Journal of the Telematics and Information Society, 8(1), 59-80.
Antikainen, M., Uusitalo, T., & Kivikytö-Reponen, P. (2018). Digitalisation as an enabler of circular economy. Procedia CIRP, 73, 45-49
Christianto, P.A., Nurhayati, S.,& Mujiyono et al. (2016). Pekalongan City Readiness Towards Smart City. Pekalongan City Research and Development Journal, 11, 107-116.
Cohen, B. (2011). The Top 10 Smart Cities on The Planet. USA: Fast Company Publishing.
Cohen, B. (2013). What exactly a smart city? http://www.boydcohen.com/ smartcities.html.
Government Regulation of the Minister of Administrative Reform and Bureaucratic Reform No. 16/ 2014. Guidelines for Surveying Public Satisfaction of Public Service Operations.
Government Regulation of the Republic of Indonesia Number 96/2012. The Implementation of Law Number 25/2009 concerning Public Services.
Hair Jr., Yoseph F., Rolph E. Anderson, Ronald L. Papham, & William Black. (2006). Multivariate Data Analysis. 5th edition. New Jersey: Prentice-Hall, Inc.,
Hardiyansyah. (2011). Quality of Public Services: Concepts, Dimensions, Indicators and Implementation. Yogyakarta: Media Press Style.
Hasibuan, A., & Sulaiman, O.K. (2019). Smart City, Smart City Concept as Alternative Solution for Regency / City Urban Problems in Big Cities in North Sumatra Province. Main Technical Bulletin, 14(2), 127-135.
Munizu, M., Pono, M., Alam, S. (2019). The Impact of Information Technology Application on Supply Chain Integration and Competitive Advantage: Indonesian Fishery Industry Context. QUALITY Access to Success, 20(169), 151-156.
Okhrimenko, I., Sovik, I., Pyankova, S., & Lukyanova, A. (2019). Digital transformation of the socioeconomic system: prospects for digitalization in society. Revista Espacios. 40(38), 26. Retrieved from: http://www.revistaespacios.com/a19v40n38/19403826.html
Prasetijaningsih, C.D. (2014). City Innovation. Yogyakarta: Graha Ilmu Publishing.
Rahmayanty, N. (2013). Excellent Service Management. Yogyakarta: Graha Ilmu Publishing.
Ratminto., & Winarsih. (2005). Service Management. Yogyakarta: Pustaka Pelajar Publishing.
Sedarmayanti. (2018). Human Resource Management; Bureaucratic Reform and Management of Civil Servants. Bandung: Reflika Aditama Publishing
Sekaran, U., & Bougie., R. (2016). Research Methods for Business. 7th Edition. United Kingdom: John Wiley & Sons.
Sinambela, L.P. (2006). Public Service Reform: Theory, Policy, and Implementation. Jakarta: Bumi Aksara Publishing.
Sugiyono (2012). Quantitative, Qualitative, and R&D Research Methods. Bandung: Alfabeta Publishing.
Sulistio, E.B. (2009). Public Bureaucracy. STISIPOL Dharma Wacana Metro: Badranaya Press.
Supangkat., Harso, S. et al. (2015). Introduction and Development of Smart City. Bandung: LPIK ITB and SII Smart City Initiatives Forum.
Surjadi, H. (2009). Development of Public Service Performance. Bandung: Reflika Aditama Publishing.
Tjiptono, F. (2014). Services Management. Yogyakarta: Andi Publishing
Waluyo. (2007). Public Management: Concept, Application and Implementation in the Implementation of Regional Autonomy. Bandung: Mandar Maju Publishing.
Zein, M.H. (2009). Bureaucratic Culture Spreads the Interests of Citizens. Jakarta: MELIBAS Publishing.
1. Lecturer. Department of Management. Hasanuddin University, Indonesia. e-mail: m3.feunhas@gmail.com
2. Lecturer. Department of Management. Hasanuddin University, Indonesia. e-mail: syamsu.alam60@yahoo.com
3. Lecturer. Department of Management. Hasanuddin University, Indonesia. e-mail: armayah@yahoo.com
4. Lecturer. Department of Management. Hasanuddin University, Indonesia. e-mail: masdar.mcri@gmail.com
5. Lecturer. Department of Management. Hasanuddin University, Indonesia. e-mail: nurdin.brasit@gmail.com
[Index]
revistaespacios.com

This work is under a Creative Commons Attribution-
NonCommercial 4.0 International License