![]() ISSN 0798 1015
ISSN 0798 1015

![]() ISSN 0798 1015
ISSN 0798 1015
Vol. 41 (Issue 12) Year 2020. Page 26
PINKOVETSKAIA, Iuliia 1; KRYUKOVA, Liudmila 2; LYUBOVTSEVA, Elena 3
Received: 15/01/2020 • Approved: 24/03/2020 • Published 09/04/2020
ABSTRACT: The objective of this research is to assess the prevailing demography of enterprises in Russia, creation rates and liquidation. In the process of research the following indicators were examined for 19 types of economic activity and 82 regions of Russia for the years 2017 and 2018: ratio of new enterprises in the total number of functioning enterprises, ratio of liquidated enterprises, as well as ratio of the number of new and liquidated enterprises. As the initial data we used official information. |
RESUMEN: El objetivo de esta investigación es evaluar la demografía predominante de las empresas en Rusia, las tasas de creación y la liquidación. En el proceso de investigación, se examinaron los siguientes indicadores para 19 tipos de actividad económica y 82 regiones de Rusia para los años 2017 y 2018: proporción de nuevas empresas en el número total de empresas en funcionamiento, proporción de empresas liquidadas, así como proporción de El número de empresas nuevas y liquidadas. Como datos iniciales utilizamos información oficial. |

Lately, researchers believed the enterprise as a developing facility that has a certain life cycle. In their opinion, all enterprises go through several phases from birth to termination of activity. There are well-known descriptions of cyclic models of enterprise development, which included only three stages (Downs, 1967; Lippitt & Schmidt, 1967; Scott, 1976; Katz & Kahn, 1978). Adizes (1999) presents ten stages of the life cycle. The paper presents a full and detailed list of steps on the appearance of the enterprises prior to the termination of their activities. The most logical approach is analyzed in the works (Hanks, et al, 1993; Miller & Friesen, 1984; Lester, Parnell & Carraher, 2003). They proposed theoretical and empirical justifications for the appropriateness of considering the five main stages of the life cycle of enterprises: formation, accumulation, maturity, diversification, decline. It should be noted that the majority of the studies pay most attention to the relationship between the phases of development, maturity, aging and their respective strategies. Moreover, in our opinion, the assessment of the prevailing levels of birth and death has still not been adequately reflected in the research.
The problem with the creation and liquidation of enterprises seem especially relevant for the analysis of trends and patterns of development in today`s Russian economy. Estimation of the number of enterprises created and those that ceased operations allows us to assess the direction of national economy transformation. This is from Strategy for development (2016) in which presented program of development entrepreneurship in Russia till 2030.
During the study, we ask the following questions, devoted to small in medium enterprises in Russia: how does industry specialization as well as their territorial location affect the creation of new enterprises and liquidation of other enterprises? At the same time we respond to recent calls in the literature for more systematic studies of the characteristics of the impact of industry and regional aspects on the birth and death of enterprises (Frolova, 2013). In the course of the study we assess the levels of creation and liquidation of enterprises that have developed in the Russian business.
The assessment of these indicators seems important in connection with the implementation of the Strategy for development (2016). The results of the carried out study are necessary for the public authorities of the Russian Federation and each of its regions.
The study will provide new information on industry and regional characteristics of the creation and liquidation of enterprises. The availability of such information is necessary for potential entrepreneurs to make substantiated decisions about starting a business. In addition, government agencies need relevant data to formulate development plans and programs for the business sector.
Our study makes an important contribution to the literature. With information on the relative density distribution as to the type of economic activity and regions of Russia regarding newly created and dead enterprises of the total number of existing enterprises.
The main part of the article is organized as follows. The second section presents literature review touching on the problems of birth and termination of enterprises. The third section presents the research methodology, its design, data source. The fourth section presents sectoral analysis of the proportion of newly birth and death enterprises according to the data for the years 2017 and 2018. The fifth section presents models that describe the regional analysis of the proportion of newly birth and death enterprises. The Conclusion completes the study.
The problems of creation and termination of enterprises have received some coverage in the previously carried out studies. Estimation of indicators characterizing the level of creation and liquidation of enterprises, according to the author of paper (Puhakka, 2007) is crucial to ensure the stability of the economy. Hong & Daly (2005) noted that new organizations stimulate competition and encourage older firms to improve their efficiency. Bruce et al (2009) assert that successful new organization can bring significant benefits to regional and national economy in the form of new products, new jobs and tax revenues.
The reasons for the companies liquidation are varied. Watson (2003), Gibson & Cassar (2005) considered the reasons for termination of the activities in enterprises as bankruptcy, intention to prevent further operation losses, the company owner's unwillingness to continue the company operation . Many organizations (Papaoikonomou & Segarra, 2012; Konstantinos & Triantafyllopoulos, 2014) come out of business due to the shock of the demand for goods and services because of economic crisis. In (Thornhill & Amit, 2003) systemic differences were identified in the reasons for death of enterprises , which indicate that failures among young firms can be explained by lack of managerial and technological knowledge, and failures of old firms are explained by their inability to adapt to environmental changes.
Among the works of (the Russian) authors dedicated to the birth and death of enterprises in the Russian cities the following works account for major interest. Sibirskaya, Oveshnikov & Makhova (2018) emphasize the need to improve the statistical tools for the formation of business demography indicators. Zaporogceva (2014) provides the analysis of the life cycles of enterprises. The number of enterprises died in connection with their merger or acquisition by other organizations (Karelina & Mkhitaryan, 2018). Vysotskaya (2018) indicates that the data on business in Russia over the past 10 years demonstrate the elimination of more small businesses , compared to the newly created. The reasons for this are complex and constantly reforming legislation; unstable ruble exchange rate; high interest rates on loans; high tax burden; large deductions to insurance funds. Kolmakov (2016) examines the indicators of institutional changes in the field of entrepreneurship, in particular the number of created and liquidated legal entities and individual entrepreneurs. Polyakova, Eremeeva & Polyakov (2018) offered economic models of probability of bankruptcy enterprises in real sector. Miroshnikova (2018) showed the reasons for the liquidation of enterprises in Primorsky Territory in 2017 were as follows - shortage of financial resources; lack of workers of required qualifications; high tax rates; ruble depreciation and inflation; decline in demand for products.
However, to date integrated assessment, achieved features birth and death of enterprises have not been given sufficient attention in Russia. In addition, we determine proportion of birth enterprises, proportion of dead enterprises as a share to whole quantity of small and medium enterprises in Russia. More over we offer ratio between the number of birth and dead enterprises.
This paper is devoted to one of the approaches to such an assessment.
The purpose of the study is to assess the prevailing demography of enterprises, namely, birth and death rates.
The studied indicators are the specific gravities of the number of new created and dead enterprises in the total number of enterprises operating in the studied periods.
To ensure a comparative analysis we considered the years 2017 and 2018.
An analytical assessment was based on two aspects of enterprise demography: industrial and regional. The industry aspect was based on the assessment of birth rates and death in 19 different types of economic activity.
The regional aspect was based on the assessment of birth rates and death of enterprises located in each of 82 regions of Russia.
The following indicators were considered for the years 2017 and 2018:
- A proportion of new enterprises from the total number;
- A proportion of liquidated enterprises in the total number;
- The prevailing ratio of the number of new and dead enterprises .
Frolova (2013), United States Small Business (2016), Ilyasov ( 2018) suggested that the economic activities of enterprises and regions have a significant impact on the levels of creation and liquidation of enterprises. Considering the fact that a comparative analysis of enterprises in Russia has not been conducted, the following hypotheses were tested in our study.
Suggested Hypothesis:
Hypothesis 1: The type of economic activity have a significant differentiation in the gravity in enterprises creation and mortality.
Hypothesis 2: The economic characteristics of each region have a significant differentiation in enterprises creation and mortality.
From the Chebyshev theorem (Kramer, 1962) follows that individual random values can have significant distinctions, in so doing, their arithmetic mean is relatively stable. A similar conclusion follows from the central limit theorem (Jenish and Prucha, 2009), which establishes that the arithmetic mean of quite a large number of independent random values loses the character of a random value. Thus, our indicators are random values that may have a significant spread, but we can foresee the significance of their arithmetic mean.
Note that in accordance with the Lyapunov theorem, the distribution of the average values of independent random values approaches the normal distribution, if the following conditions are met: all values have finite mathematical expectations and dispersion, none of the values is not sharply different from the rest. The mentioned above conditions correspond the values of relative investments in SMEs by regions. As Gmurman V.E. (2003) pointed out, the distribution of random values is fast enough (more than ten observations) approaching the normal distribution. The number of SMEs located in each region and related to specific size categories and types of economic activity ranges from hundreds to tens of thousands, which is much larger than the criterion by Gmurman V.E. In our paper, we used the methodical approach, which was based on the spatial data. Similar approach was considered in the work (Schröder and Yitzhak, 2014).
Thus, there are theoretical prerequisites for using the functions of normal distribution to describe the differentiation of relative indicators by regions of Russia.
As already indicated in the literature review, considerable experience has been gained in using of normal distribution functions to describe the distribution of empirical indicators.
Thus, the estimation of our indicators given in our paper, included the information on all enterprises in Russia and was based on functions of normal distribution.
Testing of suggested hypothesis was based on functions density of normal distribution. As shown in (Pinkovetskaia, 2015), it is advisable to model the distribution of the values of specific indicators characterizing the activity aggregates enterprises formed on a territorial basis using the density functions of the normal distribution. In our work the methodology and tools for estimating the parameters of such functions are presented, as well as the requirements for the source data that are used in the modeling process.
The initial information used in the research process was based on the official information from the Federal State Statistics Service on institutional transformations in the economy. Empirical data was generated for 19 types of economic activity and 82 regions. Such materials were used as indicators of demographics of enterprises for all 3802 thousand enterprises (in 2017) and 3434 thousand enterprises (in 2018) that operated in Russia (Federal service of state statistic, 2019).
The proportion of new and dead enterprises is determined in relation to the total number of enterprises operating in the corresponding year. The values of these indicators by the type of economic activity are given in columns 2-5 of Table 1.
Table 1
Description of Specific Gravities of New
and Dead Enterprises 2017-2018 years
Types of economic activity |
Proportion of new enterprises ,%
|
Proportion of dead enterprises ,%
|
Ratio between the number of new and liquidated enterprises |
|||
|
2017 |
2018 |
2017 |
2018 |
2017 |
2018 |
Agriculture, forestry, hunting, fishing and fish farming |
3.99 |
3.56 |
11.06 |
10.00 |
0, 36 |
0.36 |
Mining |
9.18 |
8.83 |
11.63 |
11.20 |
0.79 |
0.79 |
Manufacturing activity |
8.15 |
6.98 |
13.21 |
13.41 |
0.62 |
0.52 |
Electricity, gas and steam supply |
5.66 |
4.89 |
11.18 |
10.5 |
0.51 |
0.47 |
Water supply, water disposal, waste disposal |
7.7 |
7.03 |
11.93 |
11.25 |
0.65 |
0.62 |
Construction |
12.98 |
12.16 |
14.71 |
16.25 |
0.88 |
0.75 |
Wholesale and retail trade |
10.67 |
8.92 |
18.04 |
22.17 |
0.59 |
0.40 |
Transportation and storage |
12.37 |
10.08 |
13.1 |
14.52 |
0.94 |
0.69 |
Activities of hotels and public catering enterprises |
9.15 |
8.40 |
13.19 |
14.60 |
0.69 |
0.58 |
Information and communications activities |
9.06 |
7.31 |
11.29 |
13.75 |
0.80 |
0.53 |
Financial and insurance activities |
7.63 |
6.57 |
15.62 |
18.35 |
0.49 |
0.36 |
Real estate operations |
4.27 |
3.71 |
8.14 |
8.39 |
0.52 |
0.44 |
Professional, scientific and technical activities |
9.03 |
8.08 |
11.62 |
13.97 |
0.78 |
0.58 |
Administrative and related activities |
10.73 |
9.29 |
12.26 |
14.83 |
0.88 |
0.63 |
State administration and Security |
1.96 |
1.41 |
3.84 |
3.74 |
0.51 |
0.38 |
Education |
2.04 |
1.83 |
4.83 |
4.66 |
0.42 |
0.39 |
Health and social services |
7.27 |
6.65 |
5.82 |
6.00 |
1.25 |
1,11 |
Activities in the field of culture, sports and leisure |
7.69 |
6.85 |
9.87 |
10.67 |
0.78 |
0.64 |
Other types of services |
6.00 |
5.25 |
8.11 |
9.10 |
0.74 |
0.58 |
Source: Authors calculation, based on official statistical information (Federal service of state statistic, 2019)
According to the data presented in Table 1 in 2018 the newly created enterprises accounted for the range from 1.41% to 12.41% of the total number of enterprises in various activities. In 2017 the corresponding values ranged from 1.96% to 12.98%. The largest share of new enterprises in the total number of enterprises that functioned both in 2017 and in 2018 was noted in construction. This indicator was slightly lower for the organizations providing transport services and cargo storage. High values of specific gravities have occurred in such economic activities as wholesale and retail trade, mining and administrative activities. That is, these types of activities were most attractive when creating new enterprises. The lowest values of these indicators were in the sectors of public administration and ensuring security, as well as education. It should be noted that the weights of new enterprises in the total number of enterprises operating in 2018 for all types of activities decreased compared to 2017.
The largest share of liquidated enterprises in the total number of enterprises that functioned both in 2017 and in 2018 was noted in wholesale and retail trade. High specific weights of liquidated enterprises took place in such industries as financial and insurance activities and construction. Note that trade and construction activities are characterized by high levels of both creation and liquidation of the organization. The smallest values of specific weighs of liquidated enterprises were in state administration, healthcare and education. Specific weights of liquidated enterprises in the total number of enterprises that functioned in 2018 for most types of activities increased compared to 2017. Reducing the elimination level in 2018 was noted in agricultural organizations, water supply, state management and education.
The analysis of the data shown in Table 1 allowed us to conclude that hypothesis 1 on the existence of a significant differentiation of the specific gravities of created and liquidated enterprises in the total number of enterprises by the type of economic activity was confirmed.
The analysis make it possible to conclude:
Significant differentiation of the specific weights of created and liquidated enterprises in the total number of enterprises by types of economic activity was confirmed (Hipothesis 1).
Of considerable interest are the ratios of the number of new and liquidated enterprises, shown in columns 6 and 7 of Table 1. The analysis of the data indicates that there are fewer new enterprises, both in 2017 and in 2018, than those that were liquidated for the vast majority of activities, with the exception of health care and social services. At the same time the largest prevalence of liquidated enterprises in 2018 was noted in agriculture, financial and insurance activities, public administration, education, as well as wholesale and retail trade. The number of liquidated enterprises in these sectors was 2.5 times higher than the number of newly created. This situation seems to be negative for the country's economy and creates real threats of recession (Frenkel, 2018).
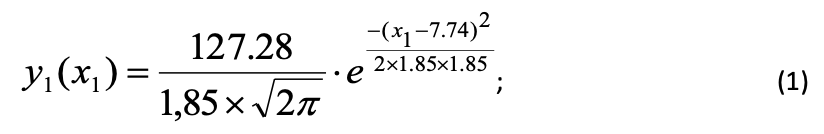
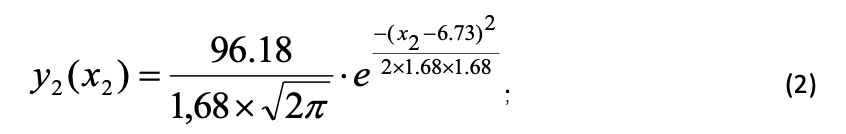
A statistical model was developed to describe the distribution by region of the specific gravities of new and liquidated enterprises in their total number for each of the regions. The models are, as indicated earlier, density functions of normal distribution. Such functions (Y) describing the distribution by region of the values of the specific gravities of new enterprises (x,%) are given below:
- according to the data for the year 2017
- according to the data for the year 2018
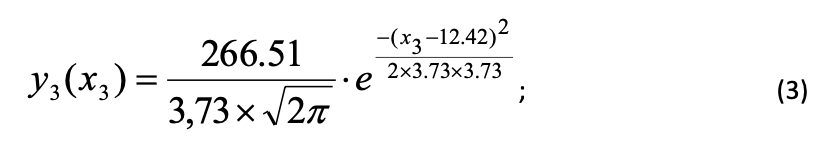
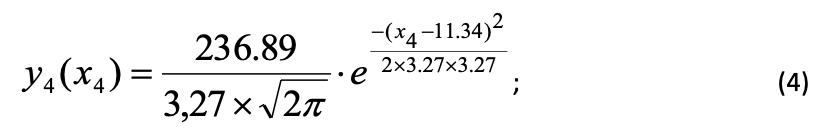
The functions (Y) that describe distribution by region of the specific gravities of liquidated enterprises (x, %) are given below:
- according to the data for the year 2017
- according to the data for the year 2018
The quality of the developed models was evaluated using three tests. A computational experiment showed that the calculated values of the statistics according to the Kolmogorov-Smirnov Test are in the range from 0,023 to 0,075 and less than the tabulated value, which at a significance level of 0.05 amounts to 0.152. The calculated values according to the Pearson test are from 0, 200 to 2,638 less than the tabulated value equal to 9.49. All calculated values of statistics on the Shapiro-Wilk Test are greater than the tabulated value equal to 0.93 with a significance level of 0.01. In addition, we carried out the logical analysis of the developed models, which showed that they approximate well the initial data over the entire range of their changes. In general, we can conclude that all the developed functions are of high quality.
This model indicated above is part of the methodology presented in paper Pinkovetskaia (2015).
The normal distribution density functions (1) - (4) make it possible to identify a number of significant regularities characterizing the considered stages of the demography of enterprises in different regions in modern conditions. The main indicators of functions (1) - (4), namely, the average values are shown in column 2 of Table 2. Column 3 of this table shows the intervals of change in the values of indicators for most (68%) regions. It is known that the borders of these intervals are calculated as follows: standard deviations are added and subtracted, respectively, from the average values, listed in column 2.
Table 2
Indicators Characterizing New
and Liquidated Enterprises, %
Indicators |
Average value |
Values typical for most regions |
Proportion of new enterprises (2017) |
7.74 |
5.89-9.59 |
proportion of new enterprises (2018) |
6.73 |
5.05-8.41 |
proportion of liquidated enterprises (2017) |
12.42 |
8.69-16.15 |
proportion of liquidated enterprises (2018) |
11.34 |
8.07-14.61 |
Source: Authors calculation, based on functions (1)-(4)
Table 2 shows no significant shifts in the average indicators and interval values characteristic for most regions for the period from 2017 to 2018. This leads to the conclusion about the stability of the obtained estimates.
As it can be seen from the data presented in column 2, over the period under review, the average regional share of new enterprises was about 7.7 % in 2017 and 6.7% in 2018. That is, on the considered regions of the country, on average, every thirteenth organization belonged to the newly established one in 2017, and in the year 2018 - every fifteenth. Accordingly, the level of new enterprises creation decreased in 2018. The downward trend in the proportion of newly created enterprises in Russia was also recorded in previous years in article (Simonova and Ovsyankina, 2016).
The average level of liquidation of enterprises in the regions was significantly higher: in 2017 every eighth organization was terminated, and in 2018 - every ninth. Accordingly, the level of liquidation of enterprises in 2018 decreased.
For most regions specific values of liquidated companies were within the range from 8% to 16 % in 2017, and from 8 % to 15 % in 2018. The levels of the mentioned indications exceed the upper limit of the intervals, shown in column 3 of Table 2. They were recorded in the cities of Moscow and St. Petersburg, in the regions of Belgorod, Voronezh, Novosibirsk, Lipetsk , Samara, Tambov, Vologda, the Republic of Bashkortostan (in 2017), as well as Moscow and St. Petersburg, Belgorod, Voronezh, Novosibirsk, Samara, Vologda, Ulyanovsk regions and republics of Bashkortostan and Tatarstan (in 2018). The values of specific weights of the new businesses less than the lower borders of intervals took place in the regions of Astrakhan, Volgograd, Leningrad, Magadan, Kirov, Vladimir, Kurgan, Arkhangelsk region, the Trans-Baikal and Stavropol regions, the Republic of Karelia (in 2017), as well as in Vladimir, Kirov, Arkhangelsk, Kostroma, Kurgan, Volgograd, Kaliningrad regions, Trans-Baikal and Stavropol Territories, the Republics of Mordovia and Komi (in 2018).
In most regions the share of liquidated enterprises ranged from 6% to 10% in 2017 and from 5% to 9% in 2018. The level of indicators index larger than the upper boundaries of the intervals listed in column 3 of Table 2, were observed in Vologda , Chelyabinsk, Tomsk, Nizhniy Novgorod, Ulyanovsk, Orel regions, republics of Tatarstan, Mari El, Khakassia and Udmurtia (in 2017), and also in Moscow and St. Petersburg, the regions of Belgorod, Voronezh , Yaroslavl, Moscow, Chelyabinsk, Vologda (in 2018). The specific weights of the liquidated enterprises smaller than the lower boundaries of the intervals took place in Kaluga, Leningrad, Pskov regions, the republics of Kabardino-Balkaria, Karachayevo-Cherkessk, Tyva the Crimea (in 2017), as well as in the Arkhangelsk, Rostov, Leningrad regions, Kamchatka territory , republics of Sakha (Yakutia), Karachaevo-Cherkessk, Tyva and the Crimea (2018).
The analysis make it possible to conclude:
Significant differentiation of the specific weights of created and liquidated enterprises in the total number of enterprises by region was confirmed (Hipothesis 2). Point that proof of Hipothesis 1 was presented earlier above. Of considerable interest are the ratios of the number of new and liquidated enterprises that have developed in the regions. The analysis showed that the values of this ratio in most regions are less than one. So, in 2017 the values in the range from 1.00 to 1.36 were observed only in 6 regions ( Smolensk, Pskov and Belgorod regions, the republics of Tyva and Kabardino-Balkaria, Chukotka Autonomous Okrug). In 2018 the values ranging from 1.00 to 1.64 were also observed in 6 regions (Leningrad region, the republics of Tatarstan, Ingushetia, Karachaevo- Cherkessia, Tyva, Chukchee autonomous terrritory). Consequently, as to 76 regions, both in 2017 and in 2018, fewer new enterprises were created than liquidated . The lower values of the ratios of the number of new and liquidated enterprises in 2018 (from 0.40 to 0.28) were recorded in the Kostroma, Volgograd, Murmansk, Chelyabinsk, Murmansk and Kaliningrad regions, as well as the Republic of Karelia. Accordingly, the number of liquidated enterprises in these regions was 2.5 to 3.6 times higher than the number of newly created ones. This situation is due to the peculiarities of the business climate in the regions, and should be taken into account when forming economic development programs in these regions of Russia.
The results of the study allow us to draw the following conclusions:
1. The values of the specific gravities of new and liquidated enterprises in their total number for 19 types of economic activity in Russia for 2017 and 2018 were determined. These values are presented in table 1.
2. The number of dead enterprises in all types of economic activity for the period under review exceeded the number of newly created enterprises in 2017 and 2018, which is concluded from column 6 and 7 table 1.
3. Using the developed functions of the normal distribution density we calculated mean values of specific weights for birth and dead enterprises as to the regions of Russia. These values are presented in column 2 table 2.
4. We proved the existence of a significant differentiation of the specific weights in both new and liquidated enterprises by types of economic activity and regions of the country.
5. The lists of regions in which high and low values of specific weights in new and liquidated enterprises in their total number were established.
6. High values birth enterprises in their whole number were in construction, wholesale and retail trade, transportation and storage, administrative and related activities. Lower values birth enterprises in their whole number were in state administration, security and education.
7. High values dead enterprises in their whole number were in wholesale and retail trade, financial and insurance activities. Lower values dead enterprises in their whole number were in state administration, security and education.
It should be noted that the high mortality rate of small and medium enterprises in Russia is due to the crisis in the economy. These crisis phenomena are related to sanctions against the Russian economy.
Overall, the obtained results suggest that Russian economy have the trend towards the concentration of production and to the reduction of the total number of enterprises. This situation is conditioned to low support small and medium enterprises from Government (Pinkovetskaia, 2018). At the same time, the main assistance is provided to large concerns related to the extraction of minerals and their processing.
The results of the research can be used in carrying out scientific work related to the substantiation of estimated number of enterprises, formation of measures to improve efficiency of their activities. The density functions of the normal distribution given in the study can be used to justify the concepts, plans, and programs for the development of the production of goods and the provision of services in various industries and regions.
The practical significance of this study is related to the possibility of their use directly by entrepreneurs (especially beginners) in assessing the possibilities of creating enterprises in specific industries and regions. The results can be applied the regional and municipal governments to monitor the business climate, as well as the formation of projects and programs for economic development. The given methodological approach and the obtained analytical estimates are of interest to financial credit and leasing institutions when substantiating their credit policy, taking into account various types of activities and regional characteristics.
Adizes, I. (1999). Managing Corporate Lifecycles: How to get and stay at the top. New Jersey: The Adizes Institute Publishing.
Bruce, D., Deskins, J.A., Hill, B.C. & Rorks J.C. (2009). Small Business Activity and State Economic Growth: Does Size Matter? Regional Studies, 43(2), 229-245.
Federal service of state statistic. (2019). Retrieved from: http://www.gks.ru/free_doc/new_site/business/inst-preob/demo-org.htm.
Frenkel, A.A., Tikhomirov, B.I., Sergienko, Y.V. & Surkov A.A. (2018). State and Trends of Socio-economic Development of Russia: between Stagnation and Recession. Questions of statistics, 25(11), 13-36.
Frolova E.A. (2013). Review of Methods and Approaches to the Assessment of the Investment and Entrepreneurial Climate in Russia. Science and society, 3(12), 82-90.
Gibson, B. & Cassar, G. (2005). Longitudinal Analysis of Relationships between Planning and Performance in Small Firms. Small Business Economics, 25(3), 207–222.
Gmurman, V.Е. (2003). Theory of Probability and Mathematical Statistic. Мoscow, High school.
Hanks, S.H., Watson, C.J., Jansen, E. & Chandler G.N. (1993).Tightening the Life-cycle Construct: a Taxonomic Study of Growth Stage Configurations in High-technology Organizations. Entrepreneurship Theory and Practice, 18(2), 5-30.
Hong, L. & Daly, V. (2005). Convergence of Chinese Regional and Provincial Economic Performance: An Empirical Investigation. International Journal of Development Issues, 4(1), 49-70.
Ilyasov, R.H. (2018). Demography of Organizations in the Chechen Republic: Analysis of Trends. Bulletin of the Chechen University, 3(31), 36-41.
Jenish, N. & Prucha, I.R. (2009). Central Limit Theorems and Uniform Laws of Large Numbers for Arrays of Random Fields. Journal of Econometrics. 150, 86-98.
Karelina, M.G. & Mkhitaryan V.S. (2018). Statistical Study of Mergers and Acquisitions Companies and Evaluation of their Integration Activity. Questions of statistics, 25(3), 15-24.
Katz, D. & Kahn, R.L. (1978). The Social Psychology of Organizations. New York: Wiley.
Kolmakov, V.V. (2016). Demography of Organizations in the Light of Business-climate Changes in Russia. European research collection of articles of V International scientific-practical conference. Penza. 53-57.
Konstantinos, K. & Triantafyllopoulos, Y. (2014). SMEs Survival in Time of Crisis: Strategies, Tactics and Commercial Success Stories. Procedia - Social and Behavioral Sciences, 148, 639-644.
Kramer, G. (1962). Mathematical Methods of Statistic. Princeton University Press.
Lester, D., Parnell, J. & Carraher, S. (2003). Organizational Life Cycle: A Five-stage Empirical Scale. International Journal of Organizational Analysis, 11(4), 339-354.
Lippitt, G.L. & Schmidt, W.A. (1967). Crisis in a Developing Organization. Harvard Business Review, 45(6), 102-112,
Miller, D. & Friesen, P.H. (1984). A Longitudinal Study of the Corporate Life Cycle. Management Science, 30(10), 1161-1183.
Miroshnikova, Т.К. (2018). Tendencies of Development Small and Medium Business in the Region: Problems and Perspectives. Azimut scientific researches: economy and management,. 7(24), 202-205.
Papaoikonomou, E., Segarra, P. & Li, X. (2012). Entrepreneurship in the Context of Crisis: Identifying Barriers and Proposing Strategies. International Advances in Economic Research, 18(1), 111-119.
Pinkovetskaia, I.S. (2015). Modeling of Indicators Activity Small and Medium Entrepreneurship in the Regions using the Density Function of the Normal Distribution. Problems development of territory, 6(80), 93-107.
Pinkovetskaia, I.S. (2018). Patterns and Trends of Business Development in Russia. Ulyanovsk, Ulyanovsk state University.
Polyakova, M.V., Eremeeva, I.S. & Polyakov, K.L. (2018). Modeling of Probability of Bankruptcy of the Enterprises of Real Sector Economy. Questions of statistics, 25(12), 12-27.
Puhakka, V. (2007). Effects of Opportunity discovering Strategies of Entrepreneurs on Performance of New Venture. Journal of Entrepreneurship, 16(1), 2-34.
Schröder C. & Yitzhak S. (2014). Reasonable Sample Sizes for Convergence to Normality. Berlin, SOEPpapers on Multidisciplinary Panel Data Research at DIW Berlin, 714.
Scott, W. (1976). The Management of Decline. Conference Board Record, 8(2), p. 56-59.
Sibirskaya, E.V., Oveshnikov, L.V. & Makhova, O.A. (2018). Statistical Analysis of Business Analysis of Business Activity. Questions of statistics, 25(10), 47-60.
Simonova, L.M. & Ovsyankina, M.V. (2016). Demography of Enterprises as a Navigator of Managerial Decision-making. Bulletin of Tyumen state University. Socio-economic and legal studies, 2(2), 209-218.
Strategy for Development of Small and Medium Entrepreneurship in the Russian Federation for the Period up to 2030. (2016). Government Order No 1083-R of June 2, 2016. Assembly of legislation of the Russian Federation, No 24, article 3549. Russia.
Thornhill, S. & Amit, R. (2003). Learning about Failure: Bankruptcy, Firm Age and the Resource-Based View. Organization Science, 14(5), 497-509.
United States Small Business Profile 2016. (2016). Washington: SBA.
Vysotskaya, T.R. (2018). Prospects of Entrepreneurship in Russia: Problems and Support. Innovative development of science and education, 1, 191-199.
Watson, J. (2003). Failure Rate for Female-controlled Businesses: are they any Different? Journal of Small Business Management, 41(3), 262-277.
Zaporogceva, L.А. (2014). The Ratio of the Theory of Cycles and Patterns of Economically Safe Development in Modern Conditions of Management. Bulletin of St. Petersburg University. Management, 2, 60-99.
1. Corresponding Author, Associate Professor, Ph.D., Ulyanovsk State University, Ulyanovsk, Russia, E-mail: pinkovetskaia@gmail.com
2. Associate Professor, Ph.D., Penza State University, Penza, Russia
3. Associate Professor, Ph.D., Penza State University, Penza, Russia
[Index]
revistaespacios.com

This work is under a Creative Commons Attribution-
NonCommercial 4.0 International License