![]() ISSN 0798 1015
ISSN 0798 1015

![]() ISSN 0798 1015
ISSN 0798 1015
 Vol. 39 (Number 43) Year 2018. Page 23
Galina KONOPYANOVA 1; Zhassulan BAIKENOV 2; Kuanysh MAMBETKAZIYEV 3
Received: 14/06/2018 • Approved: 10/07/2018
ABSTRACT: One of the factors of integration processes in higher education is the indicator of student mobility, which depends on many factors including the quality of life. Quality of life is refflected by the Gini coefficient, which characterizes income inequality. It can be assumed that the greater degree of inequality in income in a given country results in a lower degree of student mobility. The article makes an attempt to reveal the dependence between indicators of income inequality and academic mobility of students in selected countries. |
RESUMEN: Uno de los factores de los procesos de integración en la educación superior es el indicador de la movilidad de los estudiantes, que depende de muchos factores, incluida la calidad de vida. La calidad de vida se refleja en el coeficiente de Gini, que caracteriza la desigualdad de ingresos. Se puede suponer que el mayor grado de desigualdad en los ingresos en un país dado da lugar a un menor grado de movilidad de los estudiantes. El artículo intenta revelar la dependencia entre los indicadores de desigualdad de ingresos y la movilidad académica de los estudiantes en países seleccionados. |

As is well known, integration in higher education affects both internal and external aspects. These include, as a rule, student and faculty academic mobility, joint training programs, university merges, integration of business, science and education. Integration processes in general, include many factors characterizing unification of various spheres and aspects of higher education.
One of the indicators of the internationalization of the university and, consequently, the program of increasing university competitiveness is the number of foreign students enrolled in the university programs (Krasnoshchekov, 2014). In the world literature, the mobility of students is the main factor considered in characterizing integration in higher education. Depending on the number of foreign students enrolled in the programs of national universities and the number of domestic students enrolled in the programs of foreign universities, one can judge the prestige of education in a particular country, the geography of incoming students, and eventually the degree of integration in the field of education.
Some studies by foreign authors indicate that, in the process of internationalization, characteristics of the country are more important than the characteristics of certain higher education institutions. In particular, student mobility is higher in those countries that are more attractive from the economic and social point of view, not from the point of view of the ranking positions of the universities of this country (Lepori, Seeber, Bonaccorsi, 2005). International student mobility not only contributes to internationalization, but also affects the prospects and subsequent career and lifestyle of the students themselves ( Mei, Bray, 2007).
Miles Corak showed that there is a direct link between inequality and mobility. With the increase in inequality, social mobility is falling. The head of the Council of Economic Advisors, Alan Krueger, called this relationship between inequality and social mobility “the Great Gatsby Curve” (Fernos, 2016). Of course, in this case, a link is made between the elasticity of income between generations and social mobility, but that is precisely what motivates student mobility.
Many authors, examining the processes of integration in higher education, also note the human factor, noting the psychological aspects of student mobility (Marina, 2017, Sholokhov, 2002), the need to create pedagogical motivation for increasing student mobility (Rumberg, 2003).
Analyzing the factors that affect student mobility, many authors tend to believe that a direct correlation exists only between the number of students involved and the level of average wages (Antasyuk , 2016).
As a rule, each person strives to get higher education. However, as practice shows, the indicator of accessibility of higher education is different meanings in different countries and depends on many factors. Getting an education abroad or at least having an internship abroad appears to be quite difficult. In this case, two options are possible: obtaining a grant, which means a high level of language proficiency, certain training sphere or the availability of money in the family, which allows you to pay for the training in another country. In the first case, one way or another, the issue again rests on the standard of living, as numerous studies on the accessibility of higher education (especially the OECD study) show, the higher is the standard of living of the population, the greater is the accessibility of higher education. Thus, it can be noted that mobility, in one way or another, depends to a certain degree on the population living standards and on other indicators deriving from them.
Having this hypothesis, it makes sense to analyze this dependence; for the analysis we can take the Gini coefficient in different countries and the student mobility rate by country as indicators. To begin with, let us consider the dynamics of these indicators for 5 years. Unfortunately, the world statistics significantly lags behind modern dynamics and the latest data available is the one for 2015; besides, it is available not for all countries.
As is known, income inequality remains one of the most important problems in all countries of the world; only in some countries this problem is more noticeable than in the others. One of the most commonly used indicators that characterize the level of income inequality in the country is the Gini coefficient.
The Gini index or Gini coefficient is a statistical measure of the distribution developed by the Italian statistician Corrado Gini in 1912 and is used as an indicator of economic inequality, a measure of the distribution of the population income. The coefficient varies from 0 (or 0%) to 1 (or 100%), with 0 representing an ideal equality and 1 representing an ideal inequality. Values greater than 1 are theoretically possible due to negative income or wealth [9].
Thus, for the period under consideration, the Gini coefficient had the following values (Fig. 1).
Figure 1
Gini coefficient by country, %
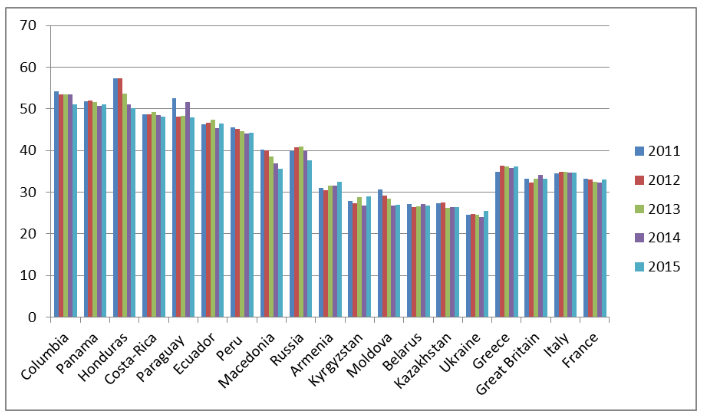
Source: [6]
The greater the value of the Gini index, the more income is concentrated in the hands of certain groups of the population. We can say that Gini coefficient (index) is a macroeconomic indicator characterizing the differentiation of the population's monetary income in the form of the deviation of the actual distribution of income from an absolutely equal distribution among the inhabitants of the country (Galperin, 2004).
According to Figure 1, the former Soviet countries have the lowest Gini coefficient values, and they are approximately the same. The highest values are typical for the countries of Latin America, and slightly lower - for the countries of Europe. There is no clearly defined growth or decline of this index. Kazakhstan has a very good standing of an average 26.5%.
Let us consider the mobility ratios for these countries over the same period of time (Figure 2).
Figure 2
Student mobility by county, %
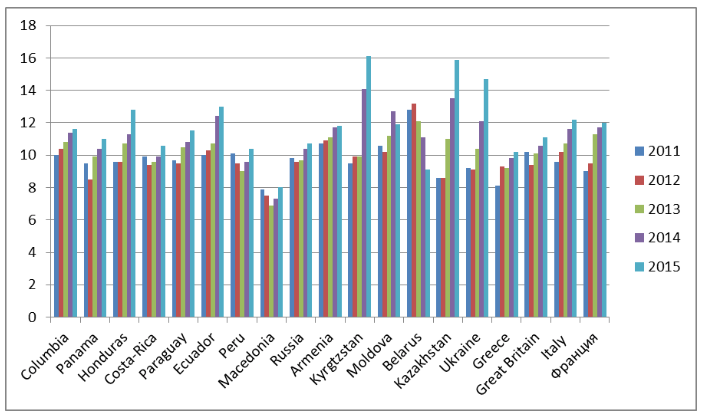
Source: [7]
It should be noted that mobility is increasing year by year in almost all countries, and in 2015 the highest indicators were characteristic of such countries as Kyrgyzstan (from 9.5% in 2011 to 16.1% in 2015), Kazakhstan (from 8.6% in 2011 to 15.9% in 2015) and Ukraine (from 9.2% in 2011 to 14.7% in 2015). What concerns the other countries, it can be said that the percentage of students’ mobility is approximately equal. At the same time, for the countries of Latin America, the highest rates are characteristic of the countries such as Honduras (from 9.6% in 2011 to 12.8% in 2015) and Ecuador (from 10% in 2011 to 13% in 2015). In Europe, the countries with the highest mobility rate are Italy and France that have a high positive dynamics in mobility estimated at 9.6% and 9% in 2011 and 12.2% and 12% in 2015, respectively.
To assess the relationship between the factors of inequality in the distribution of income and the mobility of students across countries, data for 1998-2015 were analyzed. Unfortunately, for this period for some of the countries under study there were no data for certain years in this period, which may have somewhat distorted the results. At the same time, the results of the correlation analysis showed the following results (Table 1).
Table 1
Results of the correlation analysis by country
Country |
Correlation coefficient |
Columbia |
-0,75655 |
Panama |
-0,81284 |
Honduras |
-0,94758 |
Costa Rica |
-0,69268 |
Paraguay |
-0,2615 |
Ecuador |
-0,3826 |
Peru |
-0,19256 |
Macedonia |
-0,11799 |
Russia |
-0,86534 |
Armenia |
-0,0348 |
Kyrgyzstan |
0,060169 |
Moldova |
-0,86814 |
Belarus |
-0,08625 |
Kazakhstan |
-0,75916 |
Ukraine |
-0,93304 |
Greece |
-0,15591 |
Great Britain |
-0,20241 |
Italy |
-0,58486 |
France |
-0,68008 |
Note: based on the calculations |
|
The results of the correlation dependence for all countries (with the exception of Kyrgyzstan) show that the coefficients have negative values, which indicates there exists an inverse relationship between the Gini index and the mobility of students in those countries. In other words, with the growth of the index, the mobility rate is decreasing. What concerns the Kyrgyz Republic, it can be noted that the correlation coefficient is very low and is next to zero. Knowing the situation in this country, we can state that in different periods of time the outcoming mobility of students was characteristic of only a certain group of the population who possessed the bulk of the population’s incomes, which creates a kind of privilege in the possibility of studying abroad for them. In addition, it should be noted that a significant proportion of students receive higher education primarily in the CIS countries (Russia, Kazakhstan). Perhaps this situation determines such a value of the correlation coefficient.
In the following figure, countries are divided into two groups: the ones with a high (more than 0.5) and low (less than 0.5) degree of dependence of academic student mobility on income inequality in the country (Figure 3).
Figure 3
Countries with a high and low degree of dependence of mobility on income inequality
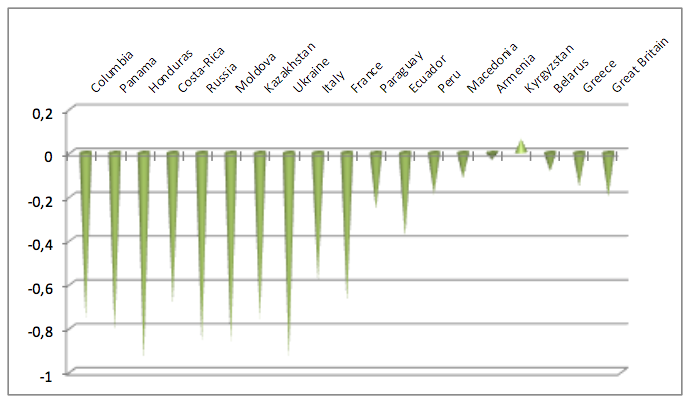
As can be seen, countries with a high and low degree of dependence can be found on all continents. On the post-Soviet territory, Russia, Kazakhstan, Ukraine and Moldova have a high dependence rate, while Armenia, Kyrgyzstan and Belarus are the countries with a low dependence. In Europe, high dependence is characteristic of Italy and France, low - of Greece and Great Britain.
Kazakhstan also has a high degree of dependence, with the correlation coefficient of 0.76 negative. Despite the fact that Kazakhstan has a relatively low Gini index, the dependence of the possibility of studying abroad is quite high. The same situation is typical for many other countries: Russia, Ukraine, Italy, France, etc.
The average coefficient of elasticity shows how much the student’s mobility will change from its average value when the Gini index factor changes by 1% of its average.
Calculations resulted in elasticity indicators by country that are shown in Table 2.
Table 2
Coefficients of elasticity by country
Country |
Coefficient value |
Columbia |
0,975 |
Panama |
1,041 |
Honduras |
0,99 |
Costa-Rica |
1,022 |
Paraguay |
0,974 |
Ecuador |
0,99 |
Peru |
1,017 |
Macedonia |
1,02 |
Russia |
1,022 |
Armenia |
0,97 |
Kyrgyzstan |
0,956 |
Moldova |
0,993 |
Belarus |
0,935 |
Kazakhstan |
1,003 |
Ukraine |
1,017 |
Greece |
0,951 |
Great Britain |
1,036 |
Italy |
0,97 |
France |
0,963 |
Note: compiled by the author based on the calculations |
|
Note: compiled by the author based on the calculations
It should be noted that the coefficients obtained are all either slightly lower than 1 or slightly more than 1. Such a situation indicates a relatively small effect of income inequality on student mobility. This is quite understandable, since income inequality can be called indirect rather than a direct factor that affects student mobility. It is remarkable that in some countries this dependence manifests itself more clearly than in the other countries. According to the received data, the weakest influence is observed in Greece, Belarus and Kyrgyzstan.
Why, then, with the existence of a high correlation between these indicators, is the influence insignificant? It is necessary to mention not only objective realities, but also subjective features. Speaking of objective reasons, we mean the results of analysis carried out, connections derived, and the degree of dependence determined, etc., which we did during this research. The objective parameters explain whether there is a relationship between certain factors, in our case between income inequality and student mobility, how strong this relationship is and whether there is a direct or reverse dependence. Objective aspects can be explained. In our case, this is the hypothesis that, since according to Great Gatsby’s theory there is a direct inverse relationship between inequality and social mobility (social heredity), it is quite possible that the accumulation of incomes with only a part of the population, the inequality of income distribution can influence the possibility of studying abroad in more prestigious universities. And the point here is not only in the fact that someone is able to pay for such training, and the other is not. As experience and research show, the population with a higher standard of living receives better education, and hence the possibility of receiving grants for studying abroad. Although, there are certain exceptions.
The main exceptions are subjective features of academic mobility of students. As is known, peoples’ behavior is largely determined by their subjective perceptions, and their perceptions often differ from what the surrounding world is. For example, the way the population perceives the interest rate policy of the Central Bank can differ significantly from the actual policy. In this case, consumer behavior of the population will depend more on subjective perceptions and expectations than on objective reality. In a similar way the situation with the perception of inequality often disagrees with the estimates of actual inequality measured by standard statistical coefficients (Gimpelson, Triesman, 2016). The attitude towards the necessity to get higher education is also rather subjective. The perception of inflation by the population differs from the actual state of affairs in the country, with the consumer price index. Thus, subjective factors have a significant effect on the existing objective factors. This kind of disagreement, in addition, varies from country to country.
It should be noted that, according to the results of the analysis, the objective factors in different countries vary insignificantly: the greater is the stratification of society in the country; the lower is the rate of academic mobility of students. At the same time, the results also indicate that in countries the mobility is higher or remains practically at the same level, while in other countries it clearly depends on the income inequality indicator.
Under conditions of globalization and internationalization, similar processes in various countries become increasingly evident, and the boundary between the continents become increasingly blurred; the society develops common patterns of socio-economic positions in are emerging. If we examine the statistics over the recent decades, we shall see an increase in the educational level of the population (education index) in different countries. And subjective factors play a significant role in this process.
It's not always that a child growing up in a low-income family will not strive for higher education, or even higher education in a prestigious foreign university. This is quite possible if we take into account the aspirations of the child and his self-education. Or the desire of parents to give their child a prestigious education at all costs. Such factors can contribute to the growth of student mobility regardless of the quality of life and be a subjective cause that affects statistics.
In addition, as it was said earlier, the attractiveness of the country has a greater impact on student mobility than the ranking position of higher education institutions. Also, developed countries demonstrate higher subjective mobility than transitional economies and developing countries. The economic attractiveness of these countries becomes the major factor that attracts students to get higher education in these countries despite the fact that many developing countries outperform the universities of developed countries in developing new courses, integrating business and education, creating favorable conditions for attracting students, etc.
Thus, the analysis shows the existence of a relationship between income inequality and student mobility, which needs to be examined more closely in order to determine objective and subjective factors that affect the integration parameters in higher education in general.
1. Antasyuk, V.I. (2016). Analysis of factors Influencing the Coice of International Students while Choosing a Country to Get Higher Education. Izvestiya Vostochnogo Instituta, 2 (30), 65- 78.
2. Fernos, A. (16 April 2016). Inequality and Social Mobility [Live journal post]. Available at https://mayakruha.livejournal.com/7990.html
3. Galperin, V.V., Galperin, V.M. (2004). 50 Lectures in Economics. [On-line Resource]. Available at http://50.economicus.ru/index.php?ch=5&le=44&r=2&z=1
4. Gimpelson, V., Triesman, D. (2015). Misperceiving Inequality (NBER, № 21174).
5. Gini index [Investopedia Web Site]. Available at https://www.investopedia.com/terms/g/gini-index.asp
6. Gini Index [World Data Atlas]. Available at https://knoema.ru/atlas/topics/Бедность/Неравенство-доходов/Коэффициент-Джини
7. Global mobility flows [On-line source]. Available at https://www.nuffic.nl/en/internationalisation/mobility-statistics/global-mobility/global-mobility-flows
8. Krasnoshchekov, V.V. (2004). Problema obucheniya studentov luchshikh Amerikanskikh universitetov v Rossii [Problems of students of best American universities studying in Rssia]. Actual Problems of Arts and Natural Sciences, (66), 94-96.
9. Lepori, B., Seeber, M., Bonaccorsi, A. (2005). Competition for Talent. Country and Organizational-level Effects in the Internationalization of European Higher Education Institutions. Research Policy, 44 (3), 789-802.
10. Marina, L. (2017) .The Development of Social and Educational Mobility of Students Using Effective Functioning of the Educational Units. International Journal of Clinical and Experimental Physiology, 4, 166-169.
11. Mei, L., Bray M. (2007). Cross-border Flows of Students for Higher Education: Push–pull Factors and Motivations of Mainland Chinese Students in Hong Kong and Macau. Higher Education, 53, 791–818.
12. Rumberger, R.W. (2003). The Causes and Consequences of Student Mobility. The Journal of Negro Education; 72, 6-21.
13. Sholokhov, I.A. (2002). Problemy psikhologicheskoi adaptatsii Uchashcheisya Molodezhi za Rubezhom [Problems of Psychological Adaptation of Youth Studying Abroad]. Razvitiye Lichnosti, 4, 161-167.
1. Candidate of Economic Sciences, Associate Professor, First Vice-President of Kazakh American Free University. galina.kafu2004@mail.ru
2. PhD student, Head of President’s Office of Kazakh-American Free University, zhas86kz@mail.ru
3. PhD student at Kazakh American Free University, mambetkaziyev88@gmail.com