![]() ISSN 0798 1015
ISSN 0798 1015

![]() ISSN 0798 1015
ISSN 0798 1015
 Vol. 40 (Number 44) Year 2019. Page 18
ARANGO, Iván 1 & HERRERA, Alejandro 2
Received: 14/10/2019 • Approved: 12/12/2019 • Published 28/12/19
ABSTRACT: This paper introduces a method of dynamic simulation that uses icons to represent functional elements that manage energy. Each functional element is represented by a programming object in 3D animation and is connected in the common workspace to form a diagram that automatically assembles the 3D representation of the machine that is being built. |
RESUMEN: Este artículo exhibe un método de simulación dinámica que utiliza iconos para mostrar elementos funcionales que gestionan la energía. Cada elemento funcional es mostrado por un objeto de programación que posee representaciones de animación 3D, las cuales se conectan en su espacio de trabajo común para formar un diagrama que ensambla automáticamente la figura 3D de la máquina en construcción. |

The design of machines, devices and equipment encompasses two correlated processes. One is the calculation to determine the values of the forces, torques, speeds and functional variables involved in a system. The second is the spatial organization of the elements in a three dimensional mode. In the past, the two processes were developed independently due to the computational limits experienced at first, but it is now possible to develop both processes simultaneously and see the first approximations beginning to take place.
Simulation tools for machine design optimization reduce the time required for programming and conceptual design, while at the same time allowing for a deeper analysis of dynamic behavior phenomena and maximum values for decision-making.
The following is a taxonomic analysis of those simulation tools that are more related and oriented to design optimization. Simulation started in the fifties when the development of computer tools was the task of researchers with software expertise. This same principle is currently maintained but with greater challenges; for example, nowadays toolboxes are being developed for very specific applications. Thus, some scientists learn to develop software and do their researches with the help of their own tools, which later become freely usable or commercial tools due to their usefulness (Hollocks, 2008; Nance & Sargent, 2002).
The methodology developed in the sixties by the engineering professor Jay W. Forrester at the MIT Sloan School of Management (Lin, Tung & Huang, 2006) is one of the main references for the analysis of complex systems dynamics. The method is used to analyze simulation models in several areas (Forrester, 1993) through the application of a scheme known as the Forrester diagram. This diagram uses graphic representations of the elements to form dynamic systems through symbol structures and interconnections among them (Yang & Kuo, 2003; Cardiel, Baeza & Lizárraga, 2017). This procedure needs both the user and the computer to do what they do best: the user creates the models and the computer simulates them (Medín, 2013).
In 1978, Hilding Elmqvist developed a new approach as part of his doctoral studies for the modeling of physical systems through the design and implementation of a graphic language called Dynamic Modeling Laboratory (Dymola) (Zupančič & Sodja, 2013). This language uses multiple-object elements whose dynamic is represented by differential and algebraic equations. These programming elements allow for direct communication among them, and they offer a physical perspective that brings the user closer to reality (Elmqvist, 1978).
In 1986 the software Laboratory Virtual Instrument Engineering Workbench (LabVIEW) is introduced with the initial objective of obtaining, managing and controlling data in an easy and efficient way by means of a graphic programming language (Mahmoodi, James & Johansen, 2018; Pérez, Begovich & Ruíz, 2018). Graphic design using cable-connected functional boxes and toolboxes, where an object is passed to the design area via Drag and Drop, reduces the programming time. LabVIEW has mathematical, logical and control components, which facilitate the development of complex systems and the immediate visualization of results (Fitzpatrick & Ley, 2017).
In 1983, Jack Little, Cleve Moler and Steve Bangert introduced Matrix Laboratory (MATLAB) in C language as a programming tool with new functions organized in libraries. Subsequently, in 1990, MathWorks, owner of MATLAB, introduced Simulink as an applied extension of this programming tool. This extension is characterized by a graphic programming environment of block diagrams for simulation and design based on models or systems (Moler, 2006). Simulink provides the environment for modeling and simulating complex systems, using libraries with functional blocks (Chermitti, Boukli & Mouhadjer, 2012; Bender et al, 2015). It offers a natural method of physical connections for the blocks with the capacity for varying the parameters and conducting high-level model analysis with object-oriented language (Joshi, Mohanty & Kougianos, 2016).
In 1997, Hilding Elmqvist presented an update of his work with an object-oriented language called Modelica, which was developed to describe complex physical systems in a simple way, through the use of tools that implement mathematical models and computer simulation (Mattsson, Elmqvist & Otter, 1998; Fritzson, 2010). This language enables the management of several levels of detail, flexibility and model development with maximum ease (Casella, Bartolini & Leva, 2017). Currently, Modelica is used as a platform for developing other simulation tools such as SimulationX and MapleSim (Li, Seem, Qiao & Winkler, 2014). These modern programs for graphic simulation use connected block diagrams, and they have commercial libraries with mathematical and kinematic functions, among others, which allow the development of fast prototypes and validation of different dynamic systems (Tian, Sevilla, Zuo, W. & Sohn, M. 2017; Tian & Voskuijl, 2015; Wetter, Zuo, Nouidui & Pang, 2014).
The 2017 version of Dymola became a strong simulation and modeling environment based on Modelica language (Kauko, Kvalsvik, Rohde, Hafner & Nord (2017). It is a tool developed to analyze simulations of complex integrated systems, with symbolic manipulation capacity, which provides modular computational efficiency (Ferretti, Magnani, Rocco, & Viganó, 2006; Cunha, Veiga, Silva. & Seabra, 2017). Dymola provides several object-oriented libraries such as mechanical, electrical, electronic, hydraulic, thermal, and control systems or process-oriented subcomponents (Nesarajah & Frey, 2016).
Currently, Open Modelica is an open-code graphic and modeled simulation environment that is also based on Modelica. It is used to analyze and optimize advanced dynamic systems with the benefit of permitting access to its source code (Cafferkey & Provan, 2015). The flexibility to access the code in order to modify the mathematical model provides the user with new approaches for simulations and several alternatives for solutions (Liu & Huang, 2015; Králik, & Žáková, 2015). Beyond the fact of counting on robust platforms for specialized dynamic simulations, the tendency of these tools is moving towards the verification of specific engineering problems based on several libraries (Fritzson & Bunus, 2002), putting aside basic design processes.
Dynamic simulators have been gradually incorporating 3D-file imports which are created using Computer-Aided Design (CAD) and connected in a way that allows for movement in relation to linear and angular variables; for example, Simscape, which is an extension of Simulink (Tejado, Torres, Pérez & Vinagre, 2016).
In the last 10 years there has been a tendency to pioneer companies in the field of software design development, as well as a tendency in dynamic system simulation towards the improvement of existing software rather than the creation of new tools. The focus of these upgrades is to meet the needs of industry and academia in order to be at the leading edge of technology and carry out the kind of specialized analysis demanded by scientific progress.
This context provides an opportunity to develop dynamic simulation alternatives focused on design methods, as well as to take advantage of the thousands of commercial items that can be used in programming objects where it is possible to simultaneously connect the mathematical model with the three-dimensional model. Combining a three-dimensional graphical method with the programming objects for system design and analysis can have didactic potential for approaching and explaining common engineering problems (Provitera, & Esendal, 2008).
This paper introduces a different approach that is oriented towards the learning of the design method. The wide array of commercial elements is arranged in functional groups. A software object is built for each element in which the mathematical model and an environment of tridimensional visualization are included. This tool has been called Sim - Methodic.
The implemented methodology is presented below and is based on the basic concepts of the object-oriented programming method. Variables of potential, flow variables, symbology classification, description of the programming objects, validation of technical systems, tridimensional model, methodology of the experiment and feedback of results are considered.
The Sim-Methodic general methodology is framed within the design method proposed by Pahl & Beitz O'Shaughnessy & Sturges (1991), which uses a function holder for each basic subsystem that is determined during the phase of conceptual design. This methodology enables the usual design process (which focuses on the design of elements that are to be built afterwards) to be inverted. It offers the possibility of seeking commercial elements that can be integrated into a more complex sub-system. This involves the methodology of design for sub-system integration that is common for short productions and prototypes.
Representative objects of the main fields of the engineering knowledge are included in Sim-Methodic. These are customized through their mathematical model and they use tridimensional representations in a CAD file. The mathematical Model-Cad pair has parameters which correspond to commercial elements.
As shown in Figure 5, the relations between subsystems or programming objects are connected by means of information streams to form diagrams that represent complex systems. Also, an animated image of the sum of all the fundamental 3D elements is obtained, as observed in Figure 8.
Each programming object that is dragged and subsequently placed by double clicking the mouse displays several windows in which digital and graphic controls and indicators are found. In addition, a window containing the 3D individual animation of the element is displayed; from there it is possible to spatially place it and each one of them is oriented to form an entire assembly with the other elements (see Table 3).
Each object on the Sim-Methodic library has four dependent variables that change according to time and the type of equations implemented within the object. These variables are classified as: potential variable, flow variable, inertia variable and the total of the flow variable (Schiavo, Viganó & Ferretti, 2006). There is also an independent variable: time. As a result of the growing interest in the correct use of energy, the sum of wasted energy for each element has been added. This is calculated at every instant of time according to the efficiency map.
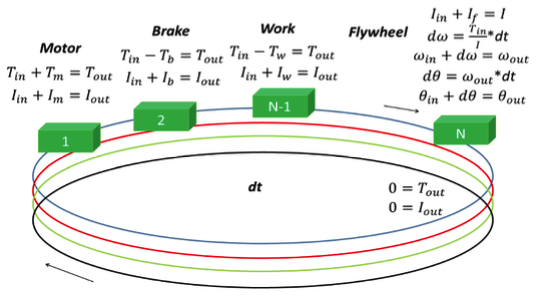
Figure 1 shows the graphic example of programming N objects for a generic rotational system, where T is the torque, ω is the angular speed, I is the moment of inertia, and ϴ is the angular position. In summary, the effect that is generated by each object on the variables is presented. To avoid the confusion that might be created by a large number of inexistent lines in a real physical system, the information is correlatedly packed into only one line of information. To solve the dynamics through numerical methods several types of analysis are used, such as Euler’s method for didactic demonstrations or high order Runge-Kutta for greater precision tasks.
Figure 1
N programming objects of
generic rotational system
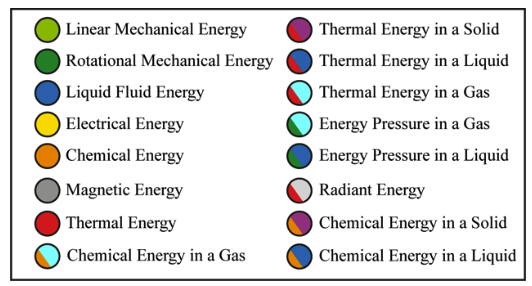
Color classification has been widely used in the industry for several purposes; for example, to differentiate types of fluids in piping, electric resistance values, types of gas in cylinders, and types of material, among others. It is for this reason that a color code was added to the symbology of programming objects to help the user to differentiate the type of energy that is crossing the object.
The implementation of colors within the programming environment makes it possible for the user to identify the field of knowledge of the several function holders. Object-oriented programming is characterized by a color code according to the type of energy they use. Table 1 shows the color code for the type of energy and the energy in the matter.
Table 1
Color code for several types of energy and matter
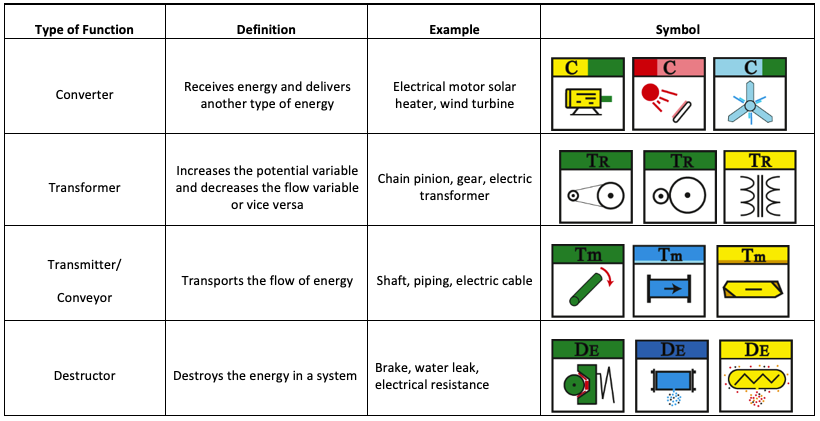
Programming objects can be classified according to their function. This is how the physical laws that describe their behavior independent of the type of energy they work with are known. The main types of function that are managed in a system are: sources of energy, energy converters, motion converters (in mechanics), energy transformers, switches and transmitters. Due to the importance of the correct use of energy, in this case energy destructors (brakes) and anti-destructors have been introduced (bearings, linear guides, ball screws, among others). In Table 2 objects which are topologically similar are observed, but they work with different types of energy.
Table 2
Classification according to function
The icon that represents a programming object is divided into two sections as shown in Figure 2. The color of section A indicates the type of energy the object is fed with. Section B serves to represent the type of energy the element delivers. Section C shows the symbolic representation of the object. A text with various letters that show the type of function of the object is overlapped in sections A and B. For example, a two-wheel gear in section A and B only has a dark green color (Table 1), since the input and output of the element is mechanic rotational energy. In turn, section C has a symbolic representation of a pair of gears. When the objects use two different kinds of energy, as is the case of the electrical motor which has an input of electrical energy and an output of rotational mechanical energy, section A is yellow in color (Table 1) and section B is dark green, which corresponds to the type of energy that delivers the object.
Figure 2
General representation of
the programming objects
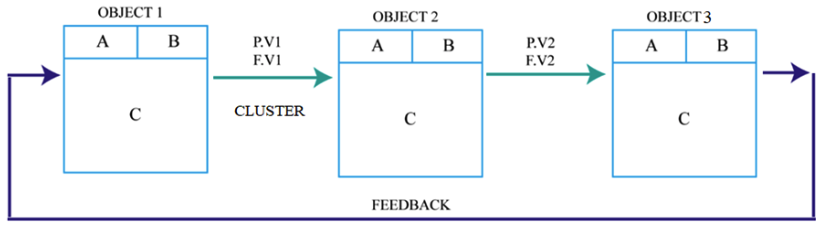
Between each object and the next one there is a cluster in which information travels; among the most important information here are the variables of potential (P.V), the variables of flow (F.V), and the accumulated mass or inertia. Other variables depend on the type of system. Each object, according to its nature, modifies the potential variable, but the flow variable remains constant unless it is a distributor or a collector that does the opposite. Given that a system can have multiple interlaced cycles, there is a connection that gives feedback of the results of the iteration in order to convert them into initial values of the next iteration between the first and the last object of a cycle. The type of energy that the output terminal of an object uses should coincide with the type of energy of the input terminal of the adjacent programming object (same color).
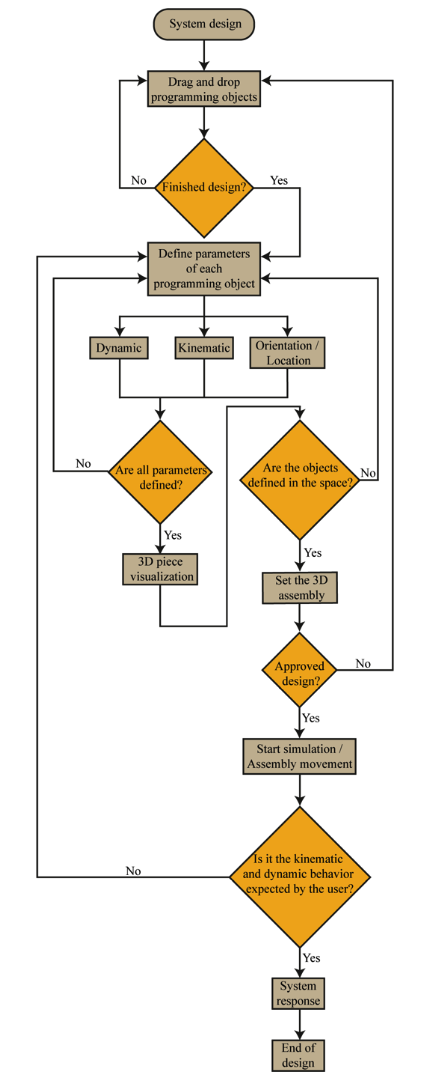
Figure 3 presents a flow chart of the procedure that follows Sim-Methodic for the design of machines or equipment.
The user establishes the selection of the programming objects, initial parameters and conditions. The relations among objects are defined through thread connections among symbolic icons used for the design of machines or equipment.
Figure 3
Diagram of the process for developing
a design with Sim-Methodic
The traditional design for mechanical engineers and other related programs makes use of safety factors that are empirically found and are represented in charts according to the type of work the team is conducting. The objective is to keep a record of those dynamic loads that are not described by algebraic equations and with which the designs are measured. Due to their empirical nature, they provide low efficiency, hence the need to use modern tools.
In modern design, system modeling and simulation enable the identification of torque peaks or strength in terms of time, frequency and other relevant factors such as fatigue, which affect the load of a part or a system. As a result, the size of the elements is set according to need, leading to a reduction in the cost of manufacturing.
The goal of Sim-Methodic is to offer an innovative learning tool that supports the development of designs in the engineering field, without the need for advanced knowledge on the part of the user. This makes it an appropriate application for undergraduate students whose detailed knowledge of technical and industrial systems is still limited. Furthermore, the equipment that students are familiar with in university laboratories is of a generic nature. This tool provides students with the possibility to familiarize themselves with, study and interact virtually with other types of equipment that are more similar to that used in modern day industry. To illustrate, the metal-mechanic laboratories of the EAFIT University only have rotary-screw compressors; the tool we present allows the student to make designs using other types of industrial compressors such as piston compressors, centrifugal compressors and scroll-type compressors.
The implementation of this tool is directly related to the knowledge acquired through subjects that study the calculation of machine elements, material selection, dynamic systems and design method. It allows students to develop generic designs aimed at the productive and industrial sectors, facilitating analysis of how the system works and enabling students to draw their own conclusions, which leads to continuous learning.
The first stage in using this learning tool in the classroom is to deliver a general explanation of the main functional elements of a machine or piece of equipment and associate them with the Sim-Methodics programming objects. A good example of this would be to provide the mathematical and dynamic explanation of a conveyor, a gearbox or an electric engine. Next, students join up these three programming objects and design, for example, a food conveyor and seek an optimal combination of speed versus energetic efficiency through the change of parameters in the simulation.
The possibility of real-time observation of the behavior of the results of the design, depending on the change of each parameter, provides the student with an understanding of how technical systems work together and how the changes made to the system can optimize the results.
There are representative and didactic examples used in teaching machine design, which are found in most textbooks. Examples of this are the motorcycle and the car, which are very useful for studying machines with highly efficient energy converters (combustion engine) and because they use switches (clutch). Electric transport as a non-pollutant energy requires the design of gearboxes that include the differential (transaxle). All the above-mentioned elements are included in the Sim-Methodic tool so that it is possible to develop academic examples focused on the industry.
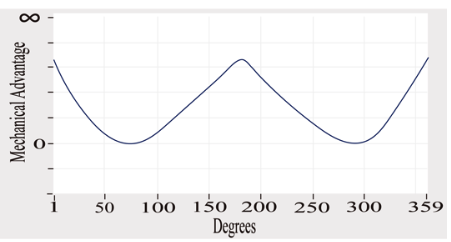
In the following exercise, Figure 4 shows how Sim-Methodic works. An example taken from the mechanical engineering field is presented in order to look at the kinematic, dynamic relations and the parameters associated with each programming object. A general design is validated and is connected to a common mechanism for several kinds of industrial equipment; in this case, the connecting rod, crank and slider (slider crank) have a dynamic behavior that provides a variable mechanical advantage regarding the turning angle.
Figure 4
Graphic of the mechanical advantage
of the slider crank mechanism
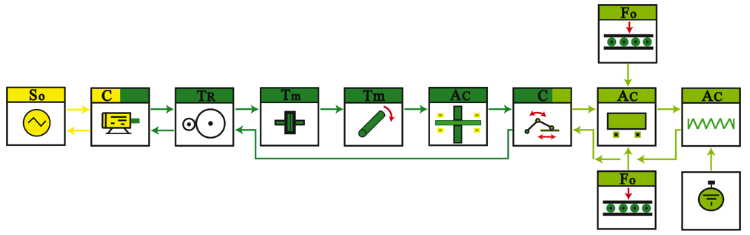
A summarized example is displayed, as shown in Figure 5, that includes programming objects located and connected as follows: source of electrical energy, a converter from electrical energy to rotational mechanical energy, a gear-type transformer, a rotary-coupling transmitter, a shaft transmitter, a rotational mechanical energy accumulator, a connecting rod and crank motion converter, a linear mass accumulator, a force to linear ball bearing, a spring-type accumulator and position reference.
Figure 5
Simplified symbol diagram containing the programming
objects of a connecting slider crank system
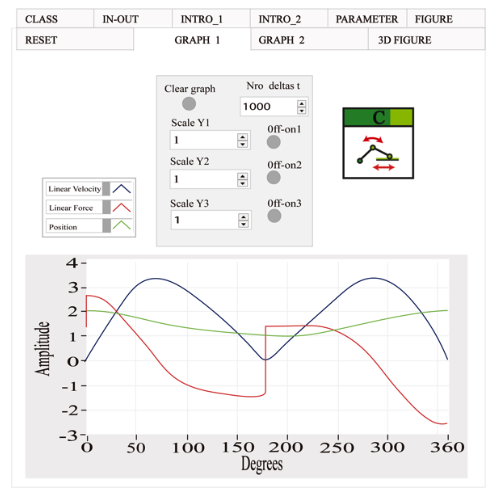
The reaction of the slider crank system is represented by graphics in Figure 6. The parameters are: radius, 50 mm and 150 mm for the crank. Each of the other programming objects has its own graphics. The speed, inertia force and linear position of the car in relation to the degrees of rotation of the crank are outlined.
Figure 6
General behavior of the connecting slider crank system
The functional box of the object connecting rod and crank is presented in Figure 7. This mechanism is reversible, so it can function as a converter of linear rotational movement. A diagram of a programming object is seen, where T is the torque, ω is the angular speed, I is the inertia movement, F is the force, V is the linear velocity, m is the mass of the linear car, Ɵ the angle of the connecting rod, n the efficiency, X the linear movement of the car, R the radius of the connecting bar, and MA is the mechanical advantage of the mechanism.
Figure 7
Functional box of the connecting rod and crank mechanism
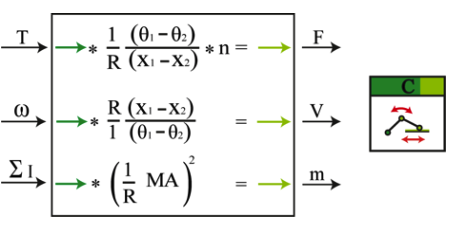
The parameters of the differential equations common to this programming object are based on trigonometrical relations. The MA of the mechanism can be found as a function of the change in the angular displacement of the crank and linear displacement of the car. Thus, the lineal position of the car can be determined by knowing the angular position of the crank, as shown in equations 1 and 2.
There is a 3-D representation of the programming objects in the main display. Table 3 shows the 3-D representations of some of the objects. As each representative icon of the programming object is added in the common working space, the 3D representation of the programming object is added simultaneously in the same space. Thus, the final assembly of the system is shown in Figure 8.
Table 3
Tridimensional representation
of programming objects
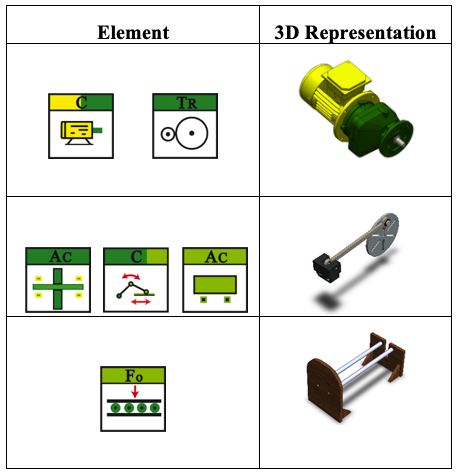
Upon completion of the symbol design the parameters for the position of the 3D-elements are set to fit in the general assembly. After this, the dynamic behavior of the design can be simulated. Once the simulation has started, the value of the parameters can be changed without stopping the simulation, allowing obtainment of results that more closely resemble real world operation.
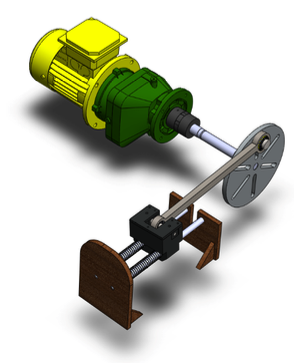
Figure 8
General assembly of the slider crank system
In order to assess the didactic utility of the new method using the Sim-Methodic tool, students’ opinions were assessed in relation to items such as functionality, simplicity in parameterization, user-friendliness and the importance of the tridimensional pieces during the design of the system. Several 5-year engineering programs were included in part of a survey conducted at EAFIT university.
The deepest survey was focused on undergraduate students of the Mechanical Engineering degree program. A sample of 120 students in 7th semester and above was the target population. The calculation was made for a 95% level of trust and a 10% margin of error. A random 54-student sample size was obtained.
A test protocol was structured in order to develop a mechanical design using two simulation tools: the commercial software of the dynamic modeling Dymola to ensure that they have at least one reference, and the tool to be tested, Sim-Methodic. Since the main characteristic to be analyzed is new in this type of tool (the 3-D representation of the programming object), it is not possible to make a direct comparative analysis with other tools of reference. Furthermore, Sim-Methodic is in its first stage of academic analysis and it is necessary to validate its mathematical models and the impact on users to try to migrate to professional or industrial organizations.
Each of the 54 students had to answer two types of question: qualitative questions with two groups of answers- one that indicates “reduces or increases” and another that reports “Yes” or “No”. There are also quantitative questions with a group of answers with a numerical assignment between 1 and 10, where 10 is the maximum value, as shown in Table 4.
Table 4
Examples of questions found in the survey
Type of question |
Description of the question |
Answer |
Qualitative |
Does the programming methodology object reduce or increase the time taken to design compared to the normal design process during the test? |
Reduces / increases |
In the test, do you find the Sim-Methodic tool useful for academic learning within the field of design? |
Yes / no |
|
Quantitative |
How important is it for you to see a 3-D design of what you are currently calculating and simulating? |
Values between 1 and 10 |
How easy did you find it to develop designs? |
Values between 1 and 10 |
|
In the test, how complicated did you find the parameterization and object connections did you find? |
Values between 1 and 10 |
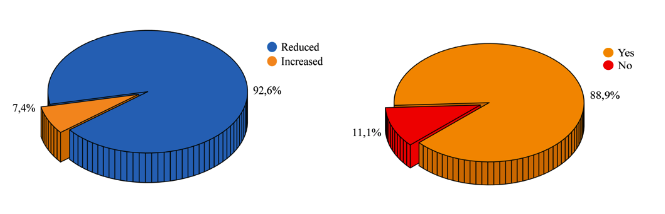
Figure 9 provides the answers to the qualitative questions, that is to say, the test of functionality and versatility on which the Sim-Methodic design method is based, with programming objects and the acceptance of the tool for accompanying academic learning.
Figure 9
Qualitative questions:
a) regarding the methodology of object programming;
b) utility of the tool for academic learning
In addition, Figure 10 provides the groups of answers to the quantitative questions with values between 1 and 10 (10 is the maximum value), for the level of complexity of the variable parameterization, user-friendliness level of the tool and utility of seeing the model in a 3-D design in real time.
Figure 10
Evaluation of the distinctive
characteristics of Sim-Methodic
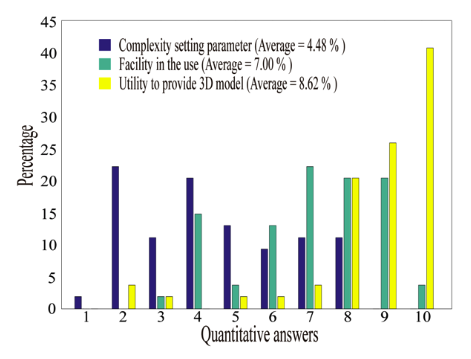
Dark blue represents the students’ opinions concerning the degree of complexity of the parameterization of the tool. It is then possible to analyze that the highest percentage of responses is located in the lower numbers, which indicates a positive impact in terms of the way the values of the design parameters of programming objects are introduced.
Light green refers to the degree of user-friendliness of the tool in the task of designing. It is observed that using Sim-Methodic for design is perceived as intuitive and user-friendly. These responses are in line with Figure 9, which introduces a tool with a feasible methodology for academic learning and uses a structure of appropriate programming objects.
Yellow shows that the students perceive a high degree of utility in visualizing the 3D model of a design simultaneously, which indicates that it is useful for academic learning and improves the analysis of each design.
The implementation of a simulator with the characteristic of a 3D module that incorporates commercial elements and is accompanied by an automatic CAD assembly while the general design is made, is not reported in the literature or in the market. Therefore, the initial tests seek to assess the perception of the client about this innovation before measuring the effect on the learning curve or its potential compared to other products. Once the corrections in the product suggested by the feedback of the perception test have been made, the evaluation stage of the effect of the tool on the learning curve will begin with a control group. This stage takes three or four semesters in the field of machine design, which is the most demanding in three-dimensional assemblies.
The starting point is the experience of students on the machine design course at EAFIT University who are using Sim-Methodic in 2019 to develop machine designs for their final projects. These have obtained a greater scope and quality in their equipment manufacturing compared to the previous year. For example, continuous variable transmissions (CVT) have been built. This equipment in 2019 is more robust, reliable and has many more engineering details. The course content has not changed and it is taught by the same teacher, hence the only differentiating factor is the use of Sim-Methodic, which suggests that these improvements can be at least partially attributed to this new tool.
The feedback of the results is the basis for improving Sim-Methodic. Future research should focus on: the optimization of the programming codes, the expansion of the library of programming objects and allowing students not only to participate in the improvements of the programming objects, but also in the design and development of the programming objects.
A dynamic simulation method that uses icons to represent functional elements that handle energy is introduced. Each programming object has an animated 3D representation; these connect with the common workspace to form a diagram that automatically assembles the 3D representation of the equipment that is being created. It originated in the need of the academy to maximize the compression of dynamic systems and to connect the student with the realities of industry. This is why the work to perfect it will continue until it has the reliability required to be used at an industrial level.
It is expected that designs using functional integrating subsystems derived from the market will continue to grow and, therefore, the potential of tools like the one we have presented is also expected to increase.
According to the results, the symbols for programming objects seemed difficult to handle at the beginning due to the range of colors and their associated meanings, but as the user builds up working hours, the difficulty dissipates and the symbols demonstrate their utility because of their similarity to real elements.
Using colors to differentiate the types of energy shows the importance of energy converters, which have efficiency curves and maps based on the flow variable and energy loss meters that reinforce the utility of the adjusting methods of the equipment in the RPM of higher efficiency.
Nowadays it is mandatory for an engineer to confidently handle all the neighboring fields of his own field of knowledge. Since the number of functions is small and there are thousands of commercial elements, the user understands how simple and useful the design method is considering that all the elements with a similar function that use any type of energy share a very similar mathematical model.
The main point to test was the inclusion of 3D figures, both in individual objects and in the window that integrates the whole system. The result was positive as it connects undergraduate students with the industrial environment since most of them have not visited enough factories to be able to recognize different types of engines, reducers, fans, pulleys and pinions, among others.
Team-based design of functional programming objects with parameters and 3D display for commercial elements is considered useful. It reduces time and increases the degree of acceptance of students of Mechanical Engineering since they consider this methodology provides the opportunity to learn how to design machines, devices and equipment.
On the operational side, the graphic representations of the principal variables for each object, which were supposed to be more efficient, were not accepted. However, they were accepted when they were grouped into a single interface.
The processing speed of the results and tridimensional models were found to be linked to the computer resources that the tool needs to process numerical data, graphics and 3D pieces.
Bender, M. et al (2015). Signature required: Making Simulink data flow and interfaces explicit. Science of Computer Programming. 113, 29-50.
Cafferkey, N. & Provan, G. (2015). An Analysis of Performance-critical Properties of Modelica Models. IFAC-PapersOnLine. 48(1), 210-215.
Cardiel, J., Baeza, R. & Lizárraga, R. (2017). Development of a system dynamics model based on Six Sigma methodology. Ingeniería e Investigación. 37(1), 80.
Casella, F., Bartolini, A. & Leva A. (2017). Equation-Based Object-Oriented modelling and simulation of large-scale Smart Grids with Modelica. IFAC-Papers On Line. 50(1), 5542-5547.
Chermitti A, Boukli-Hacene O, Mouhadjer S. (2012). Design of a Library of Components for Autonomous Photovoltaic System under Matlab/Simulink. International Journal of Computer Applications. 53(14), 13-19.
Cunha, A., Veiga, J., Silva, L. & Seabra, E. (2017). Analysis and comparison of a hydraulic and pneumatic system using the dymola software. International Journal of Mechatronics and Applied Mechanics. 1, 230-237.
Elmqvist, H. (1978). Structured model language for large continuous systems. PhD Theses, Lund University Publications, 1-226.
Ferretti, G., Magnani, G., Rocco, P. & Viganó, L. (2006). Modelling and simulation of a gripper with Dymola. Mathematical and Computer Modelling of Dynamical Systems. 12(1), 89-102.
Fitzpatrick, D. & Ley, S. (2017). Engineering chemistry for the future of chemical synthesis. Tetrahedron. 74, (25), 3087-3100.
Forrester, J. (1993). System dynamics and the lessons of 35 years. Systems-based approach to policymaking, 199-240.
Fritzson, P. (2010). Principles of object-oriented modeling and simulation with Modelica 2.1. John Wiley & Sons, 1- 944.
Fritzson, P. & Bunus, P. (2002). Modelica-a general object-oriented language for continuous and discrete-event sys-tem modeling and simulation. IEEE Xplore, Conference on Simulation Symposium, 1-13.
Hollocks, B. (2008). Intelligence, innovation and integrity— KD Tocher and the dawn of simulation. Journal of Simulation. ;2(3), 128-137.
Joshi, S., Mohanty, S. & Kougianos, E. (2016). Based ultra-fast design exploration: graphene-nanoelectronic circuit case studies. Analog Integrated Circuits and Signal Processing. 87(3), 407-420.
Kauko. H., Kvalsvik, K., Rohde, D., Hafner, A. & Nord, N. (2017). Dynamic modelling of local low-temperature heating grids: A case study for Norway. Energy. 139, 289-297.
Králik, M. & Žáková, K. (2015). Interactive WebGL Model of Hydraulic Plant. IFAC-PapersOnLine. 48(29), 146-151.
Li, P., Li, Y., Seem, J., Qiao, H., Li, X. & Winkler, J. (2014). Recent advances in dynamic modeling of HVAC equipment. Part 2: Modelica-based modeling. HVAC&R Research. 20(1), 150-161.
Lin C., Tung C., Huang C. (2006). Elucidating the industrial cluster effect from a system dynamics perspective. Technovation. 26(4), 473-482.
Liu, C. & Huang, Y. (2015). An empirical investigation of computer simulation technology acceptance to explore the factors that affect user intention. Universal Access in the Information Society. 14(3), 449-457.
Mahmoodi, M., James, L., Johansen, T. (2018). Automated advanced image processing for micromodel flow experiments; an application using labVIEW. Journal of Petroleum Science and Engineering. 167, 829-843.
Mattsson S, Elmqvist H, Otter M. (1998). Physical system modeling with Modelica. Control Engineering Practice. 6(4), 501-510.
Medín, M. (2013). Modelado de sistemas dinámicos y educación en ciencias e ingeniería. Latin American and Caribbean Journal of Engineering Education. 1(2), 75-82.
Moler, C. (2006). The growth of Matlab and the mathworks over two decades. MATLAB Digest, 22-24.
Nance, R. & Sargent, R. (2002). Perspectives on the Evolution of Simulation. Operations Research. 50(1), 161-172.
Nesarajah, M. & Frey, G. (2016). Multiphysics Simulation in the Development of Thermoelectric Energy Harvesting Systems. Journal of Electronic Materials. 45(3), 1408-1411.
O'Shaughnessy, K. & Sturges, R. (1991). A Systematic Approach to Conceptual Engineering Design. Carnegui Mellon University, 66.
Pérez, A., Begovich, O. & Ruiz, J. (2018). Modeling of a greenhouse prototype using PSO and differential evolution algorithms based on a real-time LabView™ application. Applied Soft Computing. 62, 86-100.
Provitera, M. & Esendal, E. (2008). Learning and Teaching Styles in Management Education: Identifying, Analyzing, and Facilitating. Journal of College Teaching & Learning (TLC). 5(1).
Schiavo, F., Viganó. L. & Ferretti, G. (2006). Object-Oriented Modelling of Flexible Beams. Multibody System Dynamics. 15(3), 263-286.
Tejado, I., Torres, D., Pérez, E. & Vinagre, B. (2016). Physical modeling based simulators to support teaching in automatic control: the rotatory pendulum. IFAC-PapersOnLine. 49(6), 75-80.
Tian, F. & Voskuijl, M. (2015). Automated generation of multiphysics simulation models to support multidisciplinary design optimization. Advanced Engineering Informatics. 29(4), 1110-1125.
Tian, W., Sevilla, T., Zuo, W. & Sohn, M. (2017). Coupling fast fluid dynamics and multizone airflow models in Modelica Buildings library to simulate the dynamics of HVAC systems. Building and Environment. 122, 269-286.
Wetter, M., Zuo, W., Nouidui, T. & Pang, X. (2014). Modelica Buildings library. Journal of Building Performance Simulation. 7(4), 253-270.
Yang, W. & Kuo, N. (2003). A technique for improving readability of Forrester diagram in system dynamics. Yugoslav Journal of Operations Research. 13(1), 107-130.
Zupančič, B. & Sodja, A. (2013). Computer-aided physical multi-domain modelling: Some experiences from education and industrial applications. Simulation Modelling Practice and Theory. 33, 45-67.
1. School of Engineering, Mechanical Engineering Department, EAFIT University. iarango@eafit.edu.co
2. Mechatronics and Machine Design Research Group, EAFIT University. aherre14@eafit.edu.co
[Index]
revistaESPACIOS.com

This work is under a Creative Commons Attribution-
NonCommercial 4.0 International License